HAL Id: hal-01741289
https://hal.archives-ouvertes.fr/hal-01741289
Submitted on 26 May 2020
HAL is a multi-disciplinary open access
archive for the deposit and dissemination of
sci-entific research documents, whether they are
pub-lished or not. The documents may come from
teaching and research institutions in France or
abroad, or from public or private research centers.
L’archive ouverte pluridisciplinaire HAL, est
destinée au dépôt et à la diffusion de documents
scientifiques de niveau recherche, publiés ou non,
émanant des établissements d’enseignement et de
recherche français ou étrangers, des laboratoires
publics ou privés.
Distributed under a Creative Commons Attribution - NonCommercial - NoDerivatives| 4.0
International License
amino acid levels and metabolism in obese Yucatan
minipig
Sergio Polakof, Didier Rémond, Jérémie David, Dominique Dardevet, Isabelle
Savary-Auzeloux
To cite this version:
Sergio Polakof, Didier Rémond, Jérémie David, Dominique Dardevet, Isabelle Savary-Auzeloux.
Time-course changes in circulating branched-chain amino acid levels and metabolism in obese Yucatan
minipig. Nutrition, Elsevier, 2017, 50, pp.66-73. �10.1016/j.nut.2017.11.004�. �hal-01741289�
Basic nutritional investigation
Time-course changes in circulating branched-chain amino acid
levels and metabolism in obese Yucatan minipig
Sergio Polakof Ph.D.
*
, Didier Rémond Ph.D., Jérémie David Ph.D., Dominique Dardevet Ph.D.,
Isabelle Savary-Auzeloux Ph.D.
INRA, UNH, Unité de Nutrition Humaine, CRNH Auvergne, Université Clermont Auvergne, Clermont-Ferrand, France
A R T I C L E I N F O Article history:
Received 1 June 2017 Received in revised form 24 July 2017
Accepted 1 November 2017
Keywords:
Insulin resistance Obesity
Branched-chain amino acids Adipose tissue
Postprandial Minipig
A B S T R A C T
Objectives: High-fat high-sucrose diet (HFHS) overfeeding is one of the main factors responsible for the
increased prevalence of metabolic disorders. Elevated levels of branched-chain amino acids (BCAAs) have been associated with metabolic dysfunctions, including insulin resistance (IR). The aim of this study was to elucidate whether elevated BCAA levels are the cause or the consequence of IR and to determine the mechanisms and tissues involved in such a phenotype.
Methods: We performed a 2-mo follow-up on minipigs overfed an HFHS diet and focused on kinetics
fasting and postprandial (PP) BCAA levels and BCAA catabolism in key tissues.
Results: The study of the fasting BCAA elevation reveals that BCAA accumulation in the plasma
com-partment is well correlated with IR markers and body weight. Furthermore, the PP excursion of BCAA levels after the last HFHS meal was exacerbated when compared with that of the first meal, suggesting a reduced amino acid oxidation potential. Although only minor changes in BCAA metabolism were ob-served in liver, muscle, and the visceral adipose tissue, the oxidative deamination potential of the subcutaneous adipose tissue was blunted after 60 d of HFHS feeding.
Conclusions: To our knowledge, the present results demonstrated for the first time in a swine model of
obesity and IR, the existence of a phenotype related to high-circulating BCAA levels and metabolic dysregulation. The oxidative BCAA capacity reduction specifically in the subcutaneous adipose tissue emerges, at least in the present swine model, as the more plausible metabolic explanation for the el-evated blood BCAA phenotype.
© 2017 Elsevier Inc. All rights reserved.
Introduction
The consumption of high-energy diets rich in fat, sugars, or both is increasing worldwide, paralleling the increases in obesity and metabolic diseases like type 2 diabetes mellitus and cardio-vascular diseases[1]. High-fat high-sugar (HFHS) diets are highly palatable and have a poorly controlled intake[2]. Despite the high interindividual variability in the sensitivity to weight and adi-posity gains, HFHS overfeeding is one of the main factors responsible for the increased prevalence of adiposity and met-abolic disorders involving insulin resistance (IR) and leading to chronic metabolic diseases[3].
Among the most recently studied metabolic dysfunctions and plasma metabolites alterations associated with IR occur-rence, the place of branched-chain amino acids (BCAA) is questioned[4]. An increased level of plasma BCAA is observed in individuals who are insulin resistant and shown to be altered simultaneously with IR and diabetes installation [5]. To date, the underlying mechanisms explaining these increased BCAA levels is still under debate [6,7] and whether the increased level of BCAA should be considered as causal of IR or a conse-quence of its installation remains controversial[7]. Indeed, a BCAA-altered metabolism in adipose tissue (AT) associated with a reduction of the capacity of the BCAA catabolic enzymes has been clearly shown in case of obesity-associated IR[4,6]. However, the role of other tissues in BCAA metabolism or their metabolite production has been less studied in such situations. This is the case of the liver, which is poorly involved in BCAA transamination (BCAA→ keto acids [KA]) but is a major actor in KA catabolism[8]. Finally, it is unclear whether increased BCAA
SP, DR, JD, and IS-A performed the experimental trial and analysis. SP wrote the manuscript, which was reviewed and approved by DD, DR, and IS-A.
* Corresponding author. Tel.:+33 473 624895; fax: 33 473 624638.
E-mail address:Sergio.polakof@inra.fr(S. Polakof).
https://doi.org/10.1016/j.nut.2017.11.004
0899-9007/© 2017 Elsevier Inc. All rights reserved.
Contents lists available atScienceDirect
Nutrition
results from altered AT metabolism associated with obesity or if it is the consequence of the IR development, which will ultimately lead to obesity and dysfunction of adipose cells in BCAA metabolism[4].
Despite the fact that elevated levels of BCAAs have been re-peatedly correlated to IR in human cohort studies, the data concerning the mechanisms by which BCAA would increase in plasma came mainly from rodents that were genetically modi-fied in many cases. Additionally, little is known about the time-course increase of BCAA, and only a few studies were focused on a longitudinal follow-up[9]. To determine whether in-creased circulating levels of BCAAs are at the origin of the IR phenotype, we explored the BCAA metabolism on an animal model that is close to humans, allowing the accession to repeat-ed sampling over long periods. Therefore, we performrepeat-ed a 2-mo follow-up on Yucatan minipigs overfed an HFHS diet, previ-ously shown to induce a human-like obese/IR phenotype[10]. We focused on both fasting and postprandial (PP) glucose, lipids, and BCAA metabolisms at the plasma level. BCAA catabolism was explored in key tissues at the enzyme, protein, and gene expression levels.
Materials and methods
Animals and experimental procedure
The study involved five female adult Yucatan minipigs (30± 1 kg). Three weeks before the experiment, minipigs were surgically fitted with a catheter in the ab-dominal aorta. During surgery, tissue biopsies were collected and frozen at−80°C, including liver, skeletal muscle (semimembranous), visceral (VAT), and subcu-taneous (SCAT) adipose tissue. Animals were housed in subject pens in a ventilated room with controlled temperature (21°C) and regular light cycle. They were fed once daily with 400 g of a concentrate feed (Porcyprima, Sanders, France) and had free access to tap water. All procedures were approved by the Auvergne Ethical Committee (authorization 02090.01).
After the recovery period, minipigs were fed an HFHS diet consisting of a regular pig diet enriched with fat (13% palm oil) and sugar (10% sucrose; 1 kg/ d, 15.5 kJ/d) for 2 mo. A PP kinetic sampling was performed after the first (day 0) and last (day 60) meals. Blood was collected through the catheter on hepa-rinized tubes before (0) and 60, 180, 330, and 510 min after meal ingestion. Furthermore, blood also was sampled after an overnight fast before (0), and 7, 14, 21, 30, 45, and 60 d after HFHS feeding. Blood was centrifuged at 4500 g for 10 min; plasma was collected and stored at−80°C. Body weight was deter-mined weekly. After 2 mo, minipigs were sacrificed after an overnight fasting period and tissues collected as above.
Analytical procedures
Plasma insulin, metabolite, and enzyme activities determinations
Glucose, triacylglycerol (TG), high-density lipoprotein cholesterol (HDL-C), low-density lipoprotein cholesterol (LDL-C), total cholesterol (TC), and urea con-centrations were enzymatically measured using commercial kits on an ABX Pentra 400 (Horiba Medical, France) test system. Plasma insulin levels were assessed using a commercial enzyme-linked immunosorbent assay kit (Mercodia, Sweden). Total BCAA and α-KA levels were determined enzymatically as in[11]. Branched-chain aminotransferase 2 (BCAT2) enzyme activity was determined by following the NADH consumption at 340 nm, as done previously[12]. Protein was deter-mined by the BCA method. The homeostatic model assessment (HOMA)2-IR, HOMA2-%B, and HOMA2-%S indices were calculated by the program HOMA Cal-culator v2.2.3 (http://www.dtu.ox.ac.uk/ToolsSoftware/).
Polymerase chain reaction and Western blot analyses
Total RNA was extracted using RNEasy Mini Kit (Qiagen, Gaithersburg, MD, USA) and mRNA levels were determined by reverse transcription polymerase chain reaction (RT-PCR). cDNA was generated from 1 μg RNA using high-capacity cDNA reverse transcription kit (Life Technologies, France). Real-time PCR was per-formed in the CFX96 Touch Real-Time PCR Detection System (BIO-RAD, Hercules, CA, USA), as previously discussed[13]. For Western blot analyses, total protein lysates (20 μg for liver, 30 μg for VAT and SCAT, and 40 μg for muscle) were sub-jected to sodium dodecyl sulfate polyacrylamide gel electrophoresis, electrotransferred on a polyvinylidene fluoride membrane and probed with the
phosphor-branched-chain α-KA dehydrogenase (pBCKDH)-α at serine 293 an-tibody (Abcam, Cambridge, UK). Bands were visualized by infrared fluorescence using the Odyssey imaging system. The signal of each protein was normalized to the glyceraldehyde-3-phosphate dehydrogenase (muscle, liver; Sigma, Raleigh, NC, USA) and β-actin (VAT, SCAT; Cell Signaling Technology, Beverly, MA, USA) signal.
Statistical analyses
The differences between groups were analyzed using a repeated-measures one-way analysis of variance (ANOVA) test for the fasting data and a repeated-measures two-way ANOVA test (time and diet as variables) for the PP data, followed by post hoc Holm-Sidak comparison for the kinetics comparison, and a t test for the day 0 versus day 60 comparisons (SigmaPlot 12, Systat Software, San Jose, CA, USA). The P value significance threshold was set at<0.05.
Results
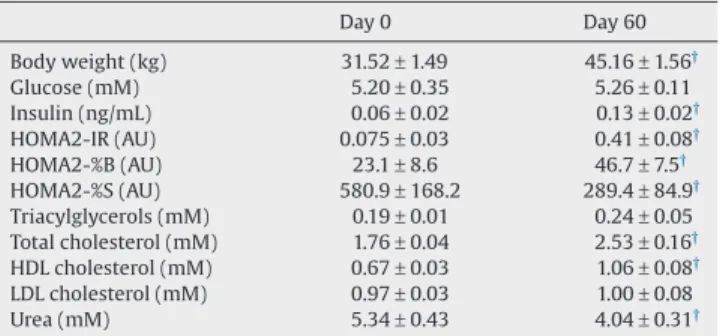
Table 1presents the metabolic phenotype of obese minipigs. After 60 d of HFHS feeding, minipigs not only showed an in-creased body weight (+45%), but also a perturbed glucose homeostasis, with higher insulin levels (about+2-fold), HOMA-IR (+5.5-fold), and HOMA-%B (2-fold) indices and a reduced HOMA-%S index (−2-fold). Other metabolisms also were affect-ed, as shown by increased TC (+1.4-fold) and HDL-C (+1.5-fold) levels, and reduced urea levels (−1.3-fold).
BCAA and KA levels in plasma are shown inFigure 1. We ob-served that BCAA levels increased in two steps, with similar levels between days 0 and 7, and then increased at day 14, which re-mained steadily elevated to the end of the trial. The plasma KA profile followed a similar trend. However, we did not observe the two steps in the kinetics; KA levels increased progressively up to day 60. The PP BCAA profile also showed that BCAA handling was different after 60 d of HFHS feeding. Not only was the basal level higher in the HFHS-fed minipigs, but the entire profile after the meal was higher than after a regular meal, especially during the first 3 h.
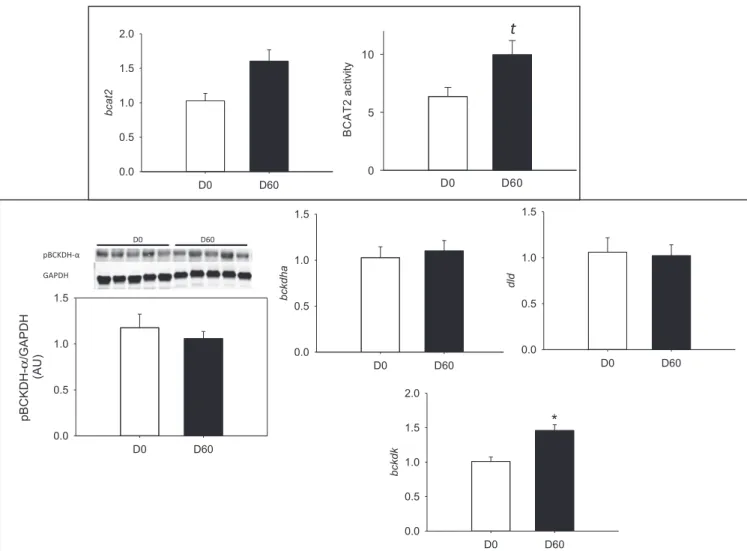
Liver BCAA metabolism is represented inFigure 2. The BCAA metabolism was differentially regulated by HFHS feeding accord-ing to the different steps of their catabolism. The transamination potential was reduced by the HFHS diet, with a twofold reduc-tion in bcat2 mRNA levels and 21-fold diminureduc-tion in BCAT activity. Concerning the oxidative deamination, although no changes were
Table 1
Morphometric data and fasting plasma biochemical parameters from minipigs before (control diet, day 0) or after 2 mo (day 60) a high-fat-high-sucrose diet feeding* Day 0 Day 60 Body weight (kg) 31.52± 1.49 45.16± 1.56† Glucose (mM) 5.20± 0.35 5.26± 0.11 Insulin (ng/mL) 0.06± 0.02 0.13± 0.02† HOMA2-IR (AU) 0.075± 0.03 0.41± 0.08† HOMA2-%B (AU) 23.1± 8.6 46.7± 7.5† HOMA2-%S (AU) 580.9± 168.2 289.4± 84.9† Triacylglycerols (mM) 0.19± 0.01 0.24± 0.05 Total cholesterol (mM) 1.76± 0.04 2.53± 0.16† HDL cholesterol (mM) 0.67± 0.03 1.06± 0.08† LDL cholesterol (mM) 0.97± 0.03 1.00± 0.08 Urea (mM) 5.34± 0.43 4.04± 0.31†
AU, arbitrary units; HDL, high-density lipoprotein; HOMA, homeostatic model assessment; IR, insulin resistance; LDL, low-density lipoprotein.
* Each value is the mean± SEM of four to five animals before and after 60 d of high-fat high-sucrose feeding.
observed in the pBCKDH complex, the mRNA levels of some of its subunits were significantly reduced (30 to 40%), including
bckdha, dbt, dld.
The BCAA metabolism in the AT is shown inFigure 3. In VAT, despite the absence of changes in the pBCKDH status, BCAT2 activity was enhanced by the HFHS feeding by 15-fold. A smaller (fivefold) but significant increase in BCAT2 activity also was ob-served in SCAT, accompanied by a 50% increase in the pBCKDH complex and the mRNA levels of dld (P= 0.092).
Finally, we explored the skeletal muscle BCAA metabolism (Fig. 4). We noticed only a few changes in BCAA metabolism induced by the HFHS diet, including a 50% increase in the mRNA levels of bckdk and a 40% increase in BCAT activity and mRNA levels.
Spearman correlations between fasting and PP (0→ 510 min after the meal) BCAA levels and variables related to glucose and lipid homeostasis are shown inTable 2. Two clear and different correlation patterns were observed. First, fasting BCAA levels sig-nificantly correlated with variables related to glucose homeostasis, including HOMA-IR (r= 0.46), HOMA2-%B (r = 0.46), HOMA2-%S (r= −0.46), fasting plasma glucose (r = −0.65), and insulin (r = 0.54) levels, although only fasting glucose (r= 0.74) correlated with the PP BCAA levels. In contrast to the fasting BCAA, PP BCAA area under the curve (AUC) correlated with biochemical variables related to dyslipidemia, including fasting TGs (r= 0.69), TC (r= 0.95), and HDL-C (r = 0.93). Finally, we found a strong cor-relation of body weight with both fasting (r= 0.71) and PP (r = 0.91) BCAA levels.
Fig. 1. (A) Fasting plasma BCAA and α-KA (inlet figure) levels in Yucatan minipigs fed an HFHS diet over 2 mo. (B) Postprandial plasma BCAA levels in Yucatan minipigs after day 0 and day 60 HFHS meal. Inlet figure represents the area under the curve obtained after integration of the whole postprandial period (0→ 510 min). BCAA, branched-chain amino acid; HFHS, high-fat high-sucrose; KA, keto acid. Data presented as mean± SEM (n = 4–5). Different letters represent significant (P < 0.05) dif-ferences between times (panel A). *Significant (P< 0.05) differences between day 0 and day 60 (panel B).
We also performed correlations between the major variable related to BCAA catabolism altered in the present study (pBCKDH in SCAT) and glucose and lipid homeostasis biomarkers (Table 3). SCAT pBCKDH correlated positively with both fasting (r= 0.77) and PP (r= 0.76) plasma BCAA levels, and also with body weight
(r= 0.77) and two markers of dyslipidemia: fasting TC (r = 0.73) and HDL-C (r= 0.71).
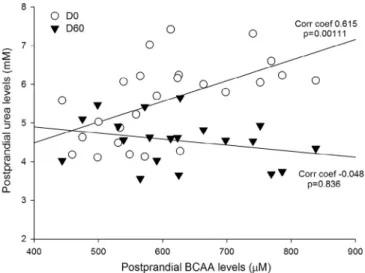
Finally, we found a correlation between PP BCAA and urea-level excursions after the meal (Fig. 5). A good positive correlation was found between both parameters but only
Fig. 2. BCAT2 activity and mRNA levels (bcat2) and BCKDH complex phosphorylation status (Ser293) and mRNA levels (bckdha, bckdhb, dld, dbd) in the liver of Yucatan
minipigs fed an HFHS diet over 2 mo. BCAT2, branched-chain aminotransferase 2; BCKDH, branched-chain α-keto acid dehydrogenase; HFHS, high-fat high-sucrose. Data presented as mean± SEM (n = 4–5). *Significant (P < 0.05) differences between day 0 and day 60.
Table 2
Results from the Spearman correlations between fasting or postprandial (AUC0–510 min) BCAA levels in Yucatan minipigs fed a high-fat high-sucrose diet over 2 mo*
Fasting BCAA (μM) Postprandial BCAA (AUC)
Spearman coefficient P value Spearman coefficient P value
HOMA2-IR (AU) 0.46 0.032 0.62 0.086
HOMA2-%B (AU) 0.46 0.042 0.81 0.083
HOMA2-%S (AU) −0.46 0.039 −0.04 0.91
Fasting plasma glucose (mM) −0.65 0.001 0.74 0.029
Fasting plasma insulin (ng/mL) 0.54 0.0123 0.62 0.086
Body weight (kg) 0.71 <0.001 0.91 <0.001
Fasting plasma triacylglycerols (mM) 0.11 0.795 0.69 0.047
Fasting plasma total cholesterol (mM) 0.462 0.250 0.95 <0.001
Fasting HDL cholesterol (mM) 0.427 0.292 0.93 <0.001
Fasting LDL cholesterol (mM) 0.093 0.830 0.143 0.705
Values in bold denotes P values<0.05 and values in italics denotes P values between 0.05 and 0.1.
AUC, area under the curve; BCAA, branched-chained amino acids; HDL, high-density lipoprotein; HOMA; homeostatic model assessment; LDL, low-density lipoprotein. * Data from days 0, 7, 14, 30, and 60 were compared for each parameter.
after the first HFHS meal at day 0 (r= 0.615; P = 0.001). In contrast, after 2 mo of HFHS feeding, the variables were no longer correlated (r= −0.048; P = 0.836). Furthermore, no corre-lation was found between fasting BCAA and urea (data not shown).
Discussion
The present study explored the BCAA metabolism in se-lected tissues of HFHS-fed minipigs. To our knowledge, this was the first time that a time-course follow-up of BCAA and KA levels
Fig. 3. BCAT2 activity and mRNA levels (bcat2), BCKDH complex phosphorylation status (Ser293) and mRNA levels (bckdha, dld) and branched-chain keto acid
dehy-drogenase kinase (bckdk) in the visceral and subcutaneous adipose tissues of Yucatan minipigs fed an HFHS over 2 mo. BCAT2, branched-chain aminotransferase 2; BCKDH, branched-chain α-keto acid dehydrogenase; HFHS, high-fat high-sucrose. Data presented as mean± SEM (n = 4–5). *Significant (P < 0.05) differences between day 0 and day 60.
was performed in a swine model at the onset of obesity and IR installation. Observations from the present study revealed in-creased BCAA accumulation in blood regardless of the feeding status (fasted or fed), with particularly exacerbated PP BCAA ex-cursion after 2 mo of HFHS feeding. This profile was associated with minor changes in BCAA catabolism in liver, VAT, and skel-etal muscle despite changes in their transamination capacities. In contrast, an important reduction in BCAA catabolism was noticed in SCAT, which could at least in part explain the el-evated BCAA profile in blood.
Elevated blood BCAA levels are a common feature of a devel-oped pathophysiological state characterized by obesity and IR[4]. It has been suggested that this profile is part of a panel of biomarkers able to predict the onset of more severe complica-tions like diabetes in humans[14]. In the present study, we observed that after 2 mo of HFHS feeding, the BCAA augmenta-tion at the fasting state was visible only after 14 d, reaching statistical significance at 1 mo. After this period, blood BCAA levels remained stable to the end of the trial. A similar profile was ob-tained for KA. After 2 mo of HFHS feeding, minipigs became obese with a marked hyperinsulinemia, increased HOMA-IR and dyslipidemia, and displayed elevated blood BCAA and KA levels. The fact that TG levels did not change and HDL levels were
Fig. 4. BCAT2 activity and mRNA levels (bcat2), BCKDH complex phosphorylation status (Ser293) and mRNA levels (bckdha, dld) and branched chain keto acid
dehy-drogenase kinase (bckdk) in skeletal muscle of Yucatan minipigs fed an HFHS diet over 2 mo. BCAT2, branched-chain aminotransferase 2; BCKDH, branched-chain α-keto acid dehydrogenase; HFHS, high-fat high-sucrose. Data presented as mean± SEM (n = 4–5). *Significant (P < 0.05) differences between day 0 and day 60.
Table 3
Results from the Spearman correlations between the phosphorylation status of the SCAT BCKDH complex (pBCKDH) and several morphologic and biochemical parameters before (day 0) and after (day 60) 2 mo of high-fat high-sucrose feeding in Yucatan minipigs
SCAT pBCKDH levels (AU) Spearman coefficient P value
Fasting BCAA levels (μM) 0.77 0.02 Postprandial BCAA (AUC 0→ 510 min) 0.76 0.03
HOMA-IR (AU) 0.38 0.29
HOMA2-%B (AU) 0.47 0.19
HOMA2-%S (AU) –0.18 0.66
Fasting plasma glucose (mM) 0.02 0.95 Fasting plasma insulin (ng/mL) 0.38 0.29
Body weight (kg) 0.77 0.012
Fasting plasma triacylglycerols (mM) 0.52 0.14 Fasting plasma total cholesterol (mM) 0.73 0.02 Fasting HDL cholesterol (mM) 0.71 0.04 Fasting LDL cholesterol (mM) 0.17 0.64 Values in bold denotes P values<0.05.
AU, arbitrary units; AUC, area under the curve; BCAA, branched-chain amino acid; BCKDH, branched-chain α-keto acid dehydrogenase; HDL, high-density lipoprotein; HOMA; homeostatic model assessment; IR, insulin resistance; LDL, low-density lipoprotein; pBCKDH, phosphor-branched-chain α-keto acid de-hydrogenase; SCAT, subcutaneous adipose tissue.
increased after this period supports the idea that minipigs were at an early stage of metabolic syndrome onset, as shown in pre-vious studies[15], where both parameters increased after longer exposure to similar diets. Of note, we found that fasting BCAA levels were correlated with body weight, in accordance with a recent study in a human cohort[16].
Fasting metabolism of BCAA and relation to the IR phenotype
As explained previously, we observed for the first time a pro-gressive increase in blood BCAA levels in a swine model of dietary-induced obesity and IR. After 2 mo of HFHS feeding, BCAA metabolism was explored in key tissues known to be important in BCAA catabolism (liver, skeletal muscle) and the in AT.
The modifications induced by 2-mo of HFHS feeding on the hepatic BCAA metabolism were overall minor. In the liver, a reduced activity and mRNA levels of the first step of BCAA me-tabolism (transamination) was observed, followed by a reduction in gene expression of some of the subunits of the BCKDH complex. This could lead one to determine that the already minor catabo-lism of BCAA in the liver[17]was further reduced. However, the phosphorylation status of the BCKDH complex remained unal-tered, suggesting that the contribution of the hepatic BCAA and KA metabolism to their elevation would be negligible in the present swine model. Results of the present study are in oppo-sition to those reported in obese rodents, where the opposite trend was observed. However, this feature was only observed in animals with a genetic background modified (ob/ob mice, Zucker rat)[7]. The available data from nonhuman primates and humans avail-able[18]confirm our results. In the first case, after 1.5 y of HF feeding, no alteration of the complex phosphorylation was ob-served, whereas in obese women the phosphorylation status of the complex remained unaltered, as in our female minipigs.
Similar to the results obtained at the hepatic level, the ex-ploration of the skeletal muscle BCAA metabolism suggests that this tissue would play only a minor role in the elevated BCAA levels in HFHS-fed minipigs. Only the transamination was af-fected by the diet, whereas the oxidative deamination did not confirm this trend, as previously shown in other animal models [7]and in line with the low capacity of this tissue to oxidize BCAA in nonobese animals. This does not mean that the muscle
metabolism was not altered, as other studies showed that BCAA oxidation defects could participate to IR[19,20], but at least in the present study it does not yet seem to be visible.
Perhaps one of the most explored hypotheses aiming at ex-plaining the elevated BCAA levels in obesity is the role of AT[4]. Both gene expression and protein concentration of enzymes in-volved in BCAA catabolism have been shown repeatedly to be blunted on VAT of obese individuals[21]and animal models[7,22], at least those genetically modified. In the present study, the BCAA transamination capacity of VAT and SCAT increased signifi-cantly with the obesity phenotype induced by the HFHS. However, the phosphorylation of the BCKDH complex was increased only in SCAT, suggesting a reduced oxidative capacity. In contrast to what has been described in rodents[23], the present results suggest for the first time the existence of a SCAT-specific regu-lation. This discordance with other species might be explained by the fact that in humans, increased VAT deposition is associ-ated with an increased risk for IR and although SCAT is associassoci-ated with improved or preserved insulin sensitivity, and mitigated risk for developing type 2 diabetes and other metabolic derange-ments[24]. In contrast, the major site of fat deposition in the pig is in SCAT[25]. It has been suggested that SCAT accumulation could be relatively beneficial by acting as a sink, and then buff-ering the daily influx of nutrients by providing long-term energy storage, thereby protecting against ectopic fat deposition and as-sociated lipotoxicity[24]. However, although in pigs SCAT seems to develop rapidly in contrast to VAT, the protective role does not seem to apply to the BCAA metabolism. In the present study, SCAT is actually the only variable showing a differential regulation of the BCKDH complex, that could explain the elevated blood BCAA levels. Taking into account that 2 mo of HFHS feeding may lead to a sevenfold increase in SCAT[10], a reduction in BCKDH ac-tivity could have important systemic consequences. In this sense, we noticed that the phosphorylation levels of the SCAT BCKDH complex was positively correlated with both fasting and PP blood BCAA levels, suggesting that the circulating BCAA levels accu-rately reflect the SCAT capacity to oxidize these AA. Further support for such association was found in the strong correla-tion of the pBCKDH status and body weight, which in the present protocol (adult animals) likely correspond to the fat accretion. As a whole, our data collected from fat tissues confirms the cap-tivity of the minipig AT to catabolize circulating BCAA and modulate their levels, as shown in rodents and humans[21,26].
Postprandial BCAA metabolism and HFHS feeding
Recently, it was shown that the PP handling and metabolism of BCAA in healthy humans should not be ignored, as it could explain the increased blood augmentation in BCAA levels. Ottosson et al. explored the PP response in BCAA and other AAs after a complex meal, and reported that the AUC of these AAs was cor-related with the overnight fasting glycemia and HOMA-IR[27]. In the present study, we observed both increased fasting BCAA levels at baseline (after 60 d of HFHS feeding), and a more im-portant AUC after the HFHS meal. Imim-portantly, minipigs consumed the same amount of protein during the meal challenge, high-lighting the importance of evaluating the PP BCAA metabolism and allowing us to hypothesize about a possible default of BCAA handling after a HFHS meal. In this sense, we found that the PP BCAA profile correlated with the urea excursions, but only at day 0, whereas no further association was found by the last meal. This suggests a direct and dynamic link between these parameters, evidencing of a default/reduction of AA catabolism following the chronic HFHS feeding that could result in increased BCAA levels.
Fig. 5. Spearman correlation between postprandial urea BCAA after day 0 and day 60 meals in Yucatan minipigs fed on HFHS diet over 2 mo. BCAA, branched-chain amino acids; HFHS, high-fat high-sucrose.
Furthermore, we found that the AUC for the PP BCAA excursion was significantly correlated with several features characteriz-ing the long-term phenotype, includcharacteriz-ing those related to obesity, such as body weight, fasting TG, and cholesterol, and those related to glucose homeostasis, such as fasting glucose levels. These cor-relations suggest that the perturbed handling of BCAA after an HFHS meal may be related to an obesity-prone phenotype and the onset of an impaired glucose homeostasis. In the latter case, only an impaired fasting glucose profile was significantly corre-lated, whereas the other correlations with IR markers (fasting insulin levels or HOMA-IR and HOMA-%B) remained as a trend (P< 0.1).
Conclusions
Overall, the results from the present study demonstrate to our knowledge, for the first time in a swine model of obesity and IR, the existence of a phenotype related to high-circulating BCAA levels and metabolic dysregulation. This is further illustrated by two sets of original data, including the time-course follow-up of the BCAA and KA levels during 2 mo of HFHS feeding and the ex-ploration of the PP BCAA metabolism. We demonstrated that PP BCAA levels showed an exacerbated response to the HFHS meal, and this could be related to a reduced AA oxidation capacity. Fur-thermore, the PP profile in HFHS animals was correlated with several parameters involved in glucose homeostasis, suggesting that the exploration of the PP BCAA handling could be an inter-esting approach to reveal early perturbations on BCAA metabolism during obesity and IR onset. Our kinetics study of the fasting BCAA elevation during the 2 mo of HFHS reveals that BCAA accumu-lation in the plasma compartment is well correlated with IR markers and body weight accretion. Furthermore, the oxidative BCAA capacity was specifically reduced in SCAT and emerged, at least in the present swine model, as a more plausible metabolic explanation of such phenotype.
Acknowledgments
The authors acknowledge D. Durand and the personnel of the Animal Facility (C. de L’Homme, B. Cohade) for technical assistance.
References
[1] Astrup A, Dyerberg J, Selleck M, Stender S. Nutrition transition and its rela-tionship to the development of obesity and related chronic diseases. Obes Rev 2008;9(Suppl. 1):48–52.
[2] Flatt JP, Ravussin E, Acheson KJ, Jequier E. Effects of dietary fat on postpran-dial substrate oxidation and on carbohydrate and fat balances. J Clin Invest 1985;76:1019–24.
[3] Hardy OT, Czech MP, Corvera S. What causes the insulin resistance under-lying obesity? Curr Opin Endocrinol Diabetes Obes 2012;19:81–7. [4] Lynch CJ, Adams SH. Branched-chain amino acids in metabolic signalling
and insulin resistance. Nat Rev Endocrinol 2014;10:723–36.
[5] Wang X, Zhang S, Zhang A, Yan G, Wu X, Han Y, et al. Metabolomics study of type 2 diabetes and therapeutic effects of Tianqijiangtang-capsule using ultra-performance liquid chromatography/electrospray ionization
quadruple time-of-flight mass spectrometry. Anal Methods 2013;5:2218– 26.
[6] She P, Reid TM, Bronson SK, Vary TC, Hajnal A, Lynch CJ, et al. Disruption of BCATm in mice leads to increased energy expenditure associated with the activation of a futile protein turnover cycle. Cell Metab 2007;6:181– 94.
[7] She P, Van Horn C, Reid T, Hutson SM, Cooney RN, Lynch CJ. Obesity-related elevations in plasma leucine are associated with alterations in enzymes involved in branched-chain amino acid metabolism. Am J Physiol Endocrinol Metab 2007;293:E1552–63.
[8] Bremer AA, Mietus-Snyder M, Lustig RH. Toward a unifying hypothesis of metabolic syndrome. Pediatrics 2012;129:557–70.
[9] Wang TJ, Larson MG, Vasan RS, Cheng S, Rhee EP, McCabe E, et al. Metabo-lite profiles and the risk of developing diabetes. Nat Med 2011;17:448– 53.
[10] Polakof S, Remond D, Bernalier-Donadille A, Rambeau M, Pujos-Guillot E, Comte B, et al. Metabolic adaptations to HFHS overfeeding: how whole body and tissues postprandial metabolic flexibility adapt in Yucatan mini-pigs. Eur J Nutr 2016;doi:10.1007/s00394-016-1302-1.
[11] Livesey G, Lund P. Enzymic determination of branched-chain amino acids and 2-oxoacids in rat tissues. Transfer of 2-oxoacids from skeletal muscle to liver in vivo. Biochem J 1980;188:705–13.
[12] Schadewaldt P, Adelmeyer F. Coupled enzymatic assay for estimation of branched-chain L-amino acid aminotransferase activity with 2-Oxo acid sub-strates. Anal Biochem 1996;238:65–71.
[13] Polakof S, Rémond D, Rambeau M, Pujos-Guillot E, Sébédio J-L, Dardevet D, et al. Postprandial metabolic events in mini-pigs: new insights from a combined approach using plasma metabolomics, tissue gene expression, and enzyme activity. Metabolomics 2014;1–16.
[14] Giesbertz P, Daniel H. Branched-chain amino acids as biomarkers in diabe-tes. Curr Opin Clin Nutr Metab Care 2016;19:48–54.
[15] Yang SL, Xia JH, Zhang YY, Fan JG, Wang H, Yuan J, et al. Hyperinsulinemia shifted energy supply from glucose to ketone bodies in early nonalcoholic steatohepatitis from high-fat high-sucrose diet induced Bama minipigs. Sci Rep 2015;5:13980.
[16] Wahl S, Vogt S, Stückler F, Krumsiek J, Bartel J, Kacprowski T, et al. Multi-omic signature of body weight change: results from a population-based cohort study. BMC Med 2015;13:48.
[17] Adams SH. Emerging perspectives on essential amino acid metabolism in obesity and the insulin-resistant state. Adv Nutr 2011;2:445–56. [18] Shin AC, Fasshauer M, Filatova N, Grundell LA, Zielinski E, Zhou JY, et al. Brain
insulin lowers circulating BCAA levels by inducing hepatic BCAA catabo-lism. Cell Metab 2014;20:898–909.
[19] Newgard CB, An J, Bain JR, Muehlbauer MJ, Stevens RD, Lien LF, et al. A branched-chain amino acid-related metabolic signature that differenti-ates obese and lean humans and contributes to insulin resistance. Cell Metab 2009;9:311–26.
[20] Lerin C, Goldfine AB, Boes T, Liu M, Kasif S, Dreyfuss JM, et al. Defects in muscle branched-chain amino acid oxidation contribute to impaired lipid metabolism. Mol Metab 2016;5:926–36.
[21] Lackey DE, Lynch CJ, Olson KC, Mostaedi R, Ali M, Smith WH, et al. Regula-tion of adipose branched-chain amino acid catabolism enzyme expression and cross-adipose amino acid flux in human obesity. Am J Physiol Endocrinol Metab 2013;304:E1175–87.
[22] She P, Olson KC, Kadota Y, Inukai A, Shimomura Y, Hoppel CL, et al. Leucine and protein metabolism in obese Zucker rats. PLoS ONE 2013;8:e59443. [23] Burrill JS, Long EK, Reilly B, Deng Y, Armitage IM, Scherer PE, et al.
Inflam-mation and ER stress regulate branched-chain amino acid uptake and metabolism in adipocytes. Mol Endocrinol 2015;29:411–20.
[24] Chusyd DE, Wang D, Huffman DM, Nagy TR. Relationships between rodent white adipose fat pads and human white adipose fat depots. Front Nutr 2016; 3:10.
[25] Dunshea F, D’Souza D. Review: fat deposition and metabolism in the pig. In: Paterson JE, editor. Manipulating pig production IX. Werribee (Australia): Australian Pig Science Association; 2003. p. 127–50.
[26] Herman MA, She P, Peroni OD, Lynch CJ, Kahn BB. Adipose tissue branched chain amino acid (BCAA) metabolism modulates circulating BCAA levels. J Biol Chem 2010;285:11348–56.
[27] Ottosson F, Ericson U, Almgren P, Nilsson J, Magnusson M, Fernandez C, et al. Postprandial levels of branch chained and aromatic amino acids associate with fasting glycaemia. J Amino Acids 2016;2016:8576730.