HAL Id: hal-01629266
https://hal.archives-ouvertes.fr/hal-01629266
Submitted on 13 Nov 2017HAL is a multi-disciplinary open access archive for the deposit and dissemination of sci-entific research documents, whether they are pub-lished or not. The documents may come from teaching and research institutions in France or abroad, or from public or private research centers.
L’archive ouverte pluridisciplinaire HAL, est destinée au dépôt et à la diffusion de documents scientifiques de niveau recherche, publiés ou non, émanant des établissements d’enseignement et de recherche français ou étrangers, des laboratoires publics ou privés.
Electrostatics Explains the Position-Dependent Effect of
G
·U Wobble Base Pairs on the Affinity of RNA Kissing
Complexes
Josephine Abi-ghanem, Clémence Rabin, Massimiliano Porrini, Eric Dausse,
Jean-jacques Toulmé, Valérie Gabelica
To cite this version:
Josephine Abi-ghanem, Clémence Rabin, Massimiliano Porrini, Eric Dausse, Jean-jacques Toulmé, et al.. Electrostatics Explains the Position-Dependent Effect of G·U Wobble Base Pairs on the Affin-ity of RNA Kissing Complexes. ChemPhysChem, Wiley-VCH Verlag, 2017, 18 (19), pp.2782-2790. �10.1002/cphc.201700337�. �hal-01629266�
This is the author pre‐print of a manuscript published in final form in: Abi‐Ghanem et al., ChemPhysChem (2017), 18(19), 2782‐2790. http://dx.doi.org/10.1002/cphc.201700337
Electrostatics explains the position‐dependent effect of G•U wobble base pairs
on the affinity of RNA kissing complexes
Josephine Abi‐Ghanem,[a] Clémence Rabin,[a] Massimiliano Porrini,[a] Eric Dausse,[b] Jean‐Jacques
Toulmé,[b] Valérie Gabelica*[a]
[a] Dr. Josephine Abi‐Ghanem, Mrs. Clémence Rabin, Dr. Massimiliano Porrini, Dr. Valérie Gabelica Laboratoire Acides Nucléiques : Régulations Naturelle et Artificielle (ARNA, U1212, UMR5320) Univ. Bordeaux, INSERM, CNRS IECB, 2 rue Robert Escarpit, 33607 Pessac, France E‐mail: v.gabelica@iecb.u-bordeaux.fr [b] Eric Dausse, Dr. Jean‐Jacques Toulmé Laboratoire Acides Nucléiques : Régulations Naturelle et Artificielle (ARNA, U1212, UMR5320) Univ. Bordeaux, INSERM, CNRS 146 rue Léo Saignat, 33076 Bordeaux
Abstract
In the RNA realm, non‐Watson Crick base pairs are abundant and affect either the RNA 3D structure and/or its function. Here we investigated the formation of RNA kissing complexes where the loop‐loop interaction is modulated by non‐Watson‐Crick pairs. Mass spectrometry, surface plasmon resonance and UV‐melting experiments show that the G•U wobble base pair favors the kissing complex formation only when placed at specific positions. We tried to rationalize this effect by molecular modelling, including molecular mechanics Poisson–Boltzmann surface area (MMPBSA) thermodynamics calculation and PBSA calculation of the electrostatic potential surfaces. Modeling reveals that the G•U stabilization is due to a specific electrostatic environment defined by the base pairs of the entire loop‐loop region. The loop is not symmetric, and therefore the identity and position of each base pair matters. Predicting and visualizing the electrostatic environment created by a given sequence can help designing specific kissing complexes with high affinity, for potential therapeutic, nanotechnology or analytical applications.Introduction
Aptamers are often referred to as “chemical antibodies”:[1] aptamer oligonucleotides can bind to specific targets (such as small molecules, proteins, or nucleic acids) via an adapted tridimensional structure. They have several advantages compared to traditional antibodies. They can be automatically synthesized in large quantities, and they have low or no immunogenicity. The discovery of riboswitches,[2] which are mRNA molecules with aptamer components that regulate gene expression in the cell, has revived the interest in RNA‐based sensors. Besides, FDA approval of the first aptamer as drug has boosted research in RNA‐based therapeutics.[3‐5]New RNA aptamers are traditionally found by the SELEX method (Systematic Evolution of Ligands by Exponential enrichment).[3] When SELEX is applied to a nucleic acid target, often the resulting aptamer is
found to bind its target via a kissing loop (KL) motif: the two nucleic acids (the aptamer and the target) form the so‐called “kissing complex” (KC).[4] In the kissing complex, the loops of two hairpins interact via
base pairing (Figure 1a). Besides aptamers, KL motifs also form in natural sequences, for example in some riboswitches[5] or in the dimerization domain of retroviruses.[6] Understanding the forces driving
the formation of KL motifs can therefore help understanding the principles of natural and artificial selection of RNA.RNA recognition motifs. Non‐canonical base pairs are frequent, both in artificially and naturally selected KL motifs. The selection process can therefore favor non‐canonical base pairs over their Watson‐Crick counterpart. This can be either for stability, kinetics, or flexibility reasons. For example, in the kissing complex of R06 aptamer with the HIV1 TAR RNA element, a non‐canonical G•A base pairs leads to a more stable structure than the fully Watson‐Crick analog.[4b] In ribozymes, binding and catalysis efficiency decreases when the naturally occurring G•U base pair is mutated to a canonic G•C base pair.[7] Finally, in tRNA, mispairs boost aminoacylation and translation, primarily by affecting the conformational flexibility.[8] Figure 1. Kissing complexes with G•C and G•U base pair variants. (a) 3D structure of the kissing complex UC: K1 in gray and K1’ in cyan. The nucleobases in the kissing loop are shown as sticks. The closing base pairs are U7•G30 and C12•G25 (for base numbering, see panel d). (b) Watson‐Crick G•C base
pair (3 hydrogen bonds) and (c) non‐canonical G•U wobble base pair (2 hydrogen bonds). Electronegatively and electropositively charged atoms are shown in red and blue, respectively. (d–f) Sequences of the four variants. K1 is on the right; the terminal bases in grey have been deleted for some mass spectrometry experiments. K1’ is on the left. The kissing complexes are named according to the identity of their bases in positions 7 and 12. Four mutants with C or U at positions 7 or 12 have been studied: (d) CC, (e) UC, (f) CU and (g) UU.
The G•U wobble base pair is found in many biological processes such as recognition (by proteins, ligands or ions),[9] or catalytic activities.[7a] In vitro selection of aptamers against stem‐loop (i.e., hairpin) RNA
structures also sometimes return hits containing one mismatched G•U base pair in the kissing loop motif.[10] The G•U base pair displays distinctive chemical groups in the major and minor groove (Figure 1b, c): the O4 of the uracil protrudes in the major groove and gives an electronegative surface, whereas the NH2 of the guanine protrudes in the minor groove and gives the base pair a more electropositive surface.[11] Replacing G•C by G•U also induces structural changes, because the whole U base needs to protrude towards the major groove in order to pair with G. We wanted to understand how and why natural or artificial selection processes could sometimes favor the G•U base pair over the canonical GC base pair. Our objective is to understand the interplay between structure and energetics for kissing complexes containing a single G•U wobble base pair, and the influence of the G•U localization on the stability of the kissing complex. Molecular dynamics simulations are traditionally used to grasp the atomistic details of the kissing complex structure and dynamics,[12] and the role of monovalent or divalent cations.[13] To
estimate the energetics, we used molecular mechanics Poisson–Boltzmann surface area (MMPBSA)[14]. Even though applying this method to single trajectories on the complex neglects conformational rearrangement upon binding,[15] we found that the method correctly accounts for the differences due to G•U mutations. As a model, we used the kissing complex K1/K1’ previously obtained by SELEX.[10b] The aptamer K1’ (Figure 1a and 1e) contains a U at position 7 (5’‐end of the loop) forming a G•U wobble base pair with its target K1, and a C at position 12 (3’‐end of the loop) forming a canonical G•C base pair on the other end of the loop. K1/K1’and its variants with U or C at positions 7 and 12 of K1’ (Fig. 1e–f) are therefore good models to understand the impact of the G•CG•U modification on the stability of RNA‐RNA kissing complexes. Our molecular modeling investigation revealed that the electrostatic environment of the entire loop dictates the effect of non‐canonical base pairing on the kissing complex.
Results and Discussion
1. G•U base pairs favor kissing complexes only at specific loop locations We used surface plasmon resonance (SPR), UV‐melting, and native mass spectrometry to assay the relative stability of the four variants of the kissing complex K1/K1’, without and with magnesium. The analysis of SPR data was problematic because the data could not be fit by a simple 1:1 binding model (see Supporting Information Figures S1‐S2). UV‐melting analyzes the dimer stability as a function of temperature, as a proxy for the relative stability at a given temperature. With or without magnesium, the stability ranking is CC > UC > CU > UU (Supporting Information Fig. S3). Native mass spectrometry is the most direct assay to distinguish heterodimers from monomers or homodimers. To evaluate the relative stability of the four kissing complexes CC, CU, UC and UU, we measured the peak area ratio between the complex and the free target. The association equilibrium is: Target + ligand ⇌ KC (1) Hence the ∆ is given by:∆ ∙ (2)
Here the target is the same within each series, and the ligand varies. For a given total concentration of target and ligand, assuming that all KCs of a series respond similarly in electrospray ionization, the ∆ is proportional to the ratio between the mass spectral peaks areas of KC (AKC) and target (Atarget),
as follows: ∆ ∝ (3) More negative values for Eq. (3) therefore indicate more stable kissing complexes. All observed charge states were summed up to calculate the peak areas (6‐ and 7‐ for the KC, 4‐ and 5‐ for the target). Figure 2. Effect of CU mutation on kissing complex stability: experiments. a‒d) ESI‐MS spectra of the equimolar mixture (10 µM each) of K1 target and K1’ ligands (see Figure 1 for sequences) in 150 mM NH4OAc. The right hand side shows a zoom on the kissing complexes at charge state 6‐, and the close signals of homodimers of K1 and K1’. e) Relative quantification of the peak areas of kissing complex, relative to the free target K1short (K1 with terminal base pair truncated, see Figure 1). The most stable
Experiments were first carried out with target K1 and the four variants of ligand K1’ (Figure 1). The results are shown in Figure 2a‒d in 150 mM NH4OAc and no magnesium. The heterodimers (kissing complexes) were detected at charge states 6‐ (major) and 7‐ (minor). However, signals of homodimers of K1 and of the ligand are also detected at the charge state 6‐. Immobilization of both monomers and homodimers on the SPR chip could explain the complexity of our SPR analysis. When magnesium ions were added to the solution, these signals become difficult to integrate separately (see Supplementary Figure S4a‐c). We therefore truncated K1 (the terminal base pair is deleted) to allow better mass separation of all species (Supplementary Figure S4d‐f). The experiments were carried out in pure NH4OAc, and in the
presence of magnesium (200 µM or 800 µM). The calculations of –ln(AKC/Atarget) are shown in Figure 2e.
The kissing complexes can form without magnesium. In all conditions, the most stable kissing complex is CC, followed by UC, then CU. UU is the least stable. In presence of magnesium, the kissing complexes are more stable, but the ordering is the same. In all cases, a G•U base pair is stabilizing the K1.K1’ complex better when placed on the 5’‐side of the K1’ loop than when placed on the 3’‐side. We then set to understand the influence of the environment of the G•U base pair on its stabilizing/destabilizing effect, using molecular modelling and dynamic simulations. 2. G•U stabilization, with or without magnesium Based on RMSDs for the different MD simulations, (Table 1 and Supplementary Figure S5), the structure of all four KCs is stable in magnesium and in sodium. The kissing loop motif forms a tunnel through the loop‐loop where ions can diffuse,[16] and be trapped in pockets. We observe two main pockets of high affinity towards the sodium ions in all the kissing complexes (Supplementary Figure S6). The first pocket is located in the loop‐loop region, in the vicinity of the G‐tract of the K1’ ligands. The second pocket is observed near the exit of the tunnel of the K1 hairpin. MD simulations with magnesium ions were conducted by initially placing the two Mg2+ ions close to the pockets found in sodium, and upon unrestrained MD the magnesium ions indeed stayed in the vicinity (Supplementary Figure S6). In UC and UU MD in sodium, we observe that in the U7•G30 base pair, U7 oscillates between open and
closed states, whereas magnesium favors the closed state. However, if a cytosine is present in position 7, the base pairing is fully maintained. The residues at the 5’‐end of the loop are always more flexible than those at the 3’‐end, so a uracil at position 7 makes a weaker base pair in the context of a G•U wobble base pair. In the MD simulations, we could observe a density of Na+ around the U 7•G30 pair, and switching to Mg2+ leads to a more stable base pairing (Supplementary Figure S7). Magnesium ions help forming the non‐canonic base pair. To better reflect cellular conditions, we will therefore mostly focus on the MD results in the presence of magnesium.
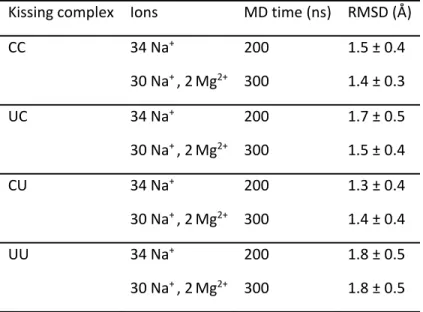
Table 1. Overview of the MD simulations. The four kissing complexes studied are shown with their respective nomenclature (see Figure 1): each complex is denoted by its 5’ and 3’ end residue of the loop of the K1’ ligand. For the MD simulations, the root mean square deviation (RMSD in Å) calculated on all the atoms is reported with its standard deviation for the total time of the MD using the average structure as reference.
Kissing complex Ions MD time (ns) RMSD (Å)
CC 34 Na+ 200 1.5 ± 0.4 30 Na+ , 2 Mg2+ 300 1.4 ± 0.3 UC 34 Na+ 200 1.7 ± 0.5 30 Na+ , 2 Mg2+ 300 1.5 ± 0.4 CU 34 Na+ 200 1.3 ± 0.4 30 Na+ , 2 Mg2+ 300 1.4 ± 0.4 UU 34 Na+ 200 1.8 ± 0.5 30 Na+ , 2 Mg2+ 300 1.8 ± 0.5 3. Effect of G•U on the structure of the kissing complexes Substituting residues at the 5’ or 3’ end loop residues of the K1’ ligand will have different impact on the whole KC structure. We first describe the effect of substituting G•C for G•U on the hydrogen bond network and on the helicoidal parameters. 3.1. Hydrogen bond network We first calculated the hydrogen bond network on a window frame from 50 to 300 ns of the MD. The four systems show subtle differences in their hydrogen bond networks in magnesium and sodium (Figure 3 and supplementary Figure S8, respectively). First, the strength of hydrogen bonding (indicated by the percentage of occupancy in the trajectory) differs according to the base pair location. The 3’‐end base of the ligand loop (position 12) is strongly paired with 78–80% in all four systems, independently of whether the base pair is C12•G25 or U12•G25. In
contrast, on the 5’‐end of K1’ loop, the hydrogen base pairing occupancy is ~71% for CC and CU, whereas it is only 54% and 8% in UC and UU, respectively. Introducing a uracil at the 5’ end therefore leads to a weaker wobble base pair than at the 3’ end. Second, a transient hydrogen bonding network forms between the ribose hydroxyl group of residues G25 and C6 and the phosphate OP1 or OP2 atoms of
the residues G24 and U7/C7 (except in UU in Mg2+). This network is the only interaction between the two
magnesium in the time window chosen for the calculations (Supplementary Figure S9). In summary, the hydrogen bonding network alone does not allow to understand why substituting C for U at position 7 is more favorable than at position 12. Figure 3. Hydrogen bond network of the kissing complexes. Hairpin K1 (right hand side) contains residues 19 to 36 and ligand hairpin variants K1’ (left hand side) contains the residues 1 to 18. The hydrogen bond network obtained by MD in magnesium, on a window frame from 50 to 300 ns, is shown for kissing complex CC (a), UC (b), CU (c) and UU (d). The colors indicate the fractional population of hydrogen bonds, from blue 0% (absence) to red 100% (present). H‐bonds between bases are represented by solid lines, and H‐bonds between the ribose and the phosphate groups are represented as dashed lines. 3.2. Helicoidal parameters However, in wobble base pairs, the shifting of G and U towards the minor (narrowest) and major (widest) groove respectively could affect the helicoidal parameters compared to a canonical base pair. We can write the sequences on two lines highlighting the base pairs (Figure 4a), then calculate various inter‐base parameters, indicating the position and orientation of a base pair relative to the helical axis (defined here by the repetition of a two base‐pair unit). Although the kissing loop is not a canonical double‐helix motif, the helicoidal parameters serve here to highlight the structural differences between the four systems. The most significant changes when mutating C to U were found in the base pairs twist and slide. The twist is a rotation about the helical axis Z‐axis (Figure 4b), and the slide is a translation around the Y‐axis (Supplementary Figure S10e). The canonical helical twist for an A‐helix is 32° and the slide is ‐1.5°.[17] Here we found that the values of the twist (Figure 4), and to a lesser extent of the slide (Supplementary Figure S10), depends on the identity of the bases closing the loop‐loop helix.
Figure 4. Effect of G•U substitution on inter‐base pair twist. The helicoidal parameters are calculated on the MD in magnesium on a window frame (50‐300 ns) on a) the linearized sequences (K1 hairpin in black, K1’ hairpin in blue, and base pairs of the kissing complex facing one another). N stands for cytosine or uracil. b) Scheme of the twist of two base pairs around the z‐axis. c‐d) The steps which yield to a change across the four kissing complexes: c) the steps G30pC31•G24pN7 and the step C31pG32•C23pG24,
and d) the steps G25pC26•G11pN12 and the step C26pC27•G10pG11. e‐f) corresponding twist value (in
degrees) as a boxplot. The gray line in the boxplots indicates the canonical value of the twist parameter (32°) in an A‐helix. 3.2.1. Effect of CU mutation at the 5’‐end of K1’ (position 7): When a cytosine is present at the 7th position (CC and CU), the twist for the step G 30pC31•G24pC7 is ~38°, followed by a twist of ~41° for the step C31pG32•C23pG24. However, for UU, the twist for the step G30pC31•G24pU7 is lower (29±9°), and that of the next step C31pG32•C23pG24 is high (48±4°). For UU, the order is reversed: we observe first high twist (38±16°) for the step G30pC31•G24pU7, followed by a lower twist (28±27°) for the step C31pG32•C23pG24 (Figure 4 b,d). For the slide parameter, the differences are more subtle (Supplementary Figure S10 b,d). The changes are detected on the step C31pG32•C23pG24: a more negative slide is observed for CC and CU, (‐1.2±0.5° and ‐0.9±0.4°, respectively) than for UC and UU (0±1.2° and 0.7±1.7°). The twist and slide values for UC and UU are much more widely spread than for CC and CU, and this reflects structural changes occurring when the G30•U7 base pair opens.
3.2.2. Effect of CU mutation at the 3’‐end of K1’ (position 12):
When a cytosine is present at the 12th position (UC and CC), the twist for the step G
25pC26•G11pC12 is high
(52±6°), followed by a lower twist for the step C26pC27•G10pG11 (33±4°). When an uracil is in the 12th
position in the systems CU and UU (Figure 4 c,e) the twist for the step G25pC26•G11pU12 is 42±5° and
35±6° respectively, followed by a similar twist for the neighboring step C26pC27•G10pG11 (41±3°). The effect on the slide, however, is more pronounced at the step G25pC26•G11pN12 (Supplementary Figure S10 c,e). In presence of U12 we observed more negative values for CU and UU (‐2±0.4° and ‐1.8±0.4°, respectively) than in the presence of C12 (‐1.2±0.4° for CC and ‐1.1±0.5° for CU). In summary, the effect of CU mutation on the helicoidal parameters is centered around the G•U wobble base pairs, but is also context‐dependent. Each complex has a distinct helicoidal signature, because mutations at the 5’‐end or 3’‐end of the K1’ loops are not equivalent. Although the mutations occurred only in K1’, the effects on helicoidal parameters propagate towards the target hairpin K1, suggesting an induced fit mechanism. The same tendencies were also found in the MD in sodium (Supplementary Figures S11‐S12). Still, the structural description alone does not yet reveal why a G•U wobble base pair is stabilizing at the 5’‐end and destabilizing at the 3’‐end of the K1’ loop. We therefore turned to energy calculations on the structures generated by MD. 4. Structure‐thermodynamics relationships unravel why the G•U stabilizing effect is position‐ dependent 4.1. MMPBSA calculations First, we computed the binding energies of the four kissing complexes. We let each system equilibrate for 50 ns and we calculated a global molecular mechanics Poisson–Boltzmann surface area (MMPBSA), from 50 to 300 ns. We also divided this time frame into 5 windows (50‐100 ns, 100‐150 ns, 150‐200 ns, 200‐250 ns and 250‐300 ns) to grasp the variability due to structural rearrangements during the MD simulation. The association free energy of the hairpin‐hairpin binding (ΔGassoc) is the difference between
the free energies of the kissing complex (GKC) and the unbound target (Gtarget) and ligand (Gligand):
∆ (4) Note that for UC and UU in sodium, on those time scales the U7•G30 base pair can be either closed or opened (Supplementary Figure S4), and this will influence the ΔG values and their variations. Although the magnitude binding constants are by far overestimated (a notorious problem of the MMPBSA method, which neglects target and ligand rearrangement[18]), the stability ranking of ΔG assoc values (Figure 5a; supporting Table S1) agrees with the experimental trends. The per‐residue dissection of MMPBSA calculations (Figure 5b in presence of Mg2+, supporting information Figure S13 in Na+ alone)
can then help us understand the position‐dependent effect of G•U base pair on KC stability. This decomposition allows exploring the respective contributions of the modified base pair, of its nearest neighbors, and of more distant residues. The free energy contribution of a residue is obtained by
summing up its interaction with all residues in the system and calculating the difference of interaction in the kissing complex versus the free hairpins.
The C12U12 mutation is unfavorable, especially for its base‐pairing residue G25 which greatly
destabilizes the complex CU (Figure 5b). There is only a small effect of C12U12 on the neighboring bases
(C6, G13, G24 and G11), with the most marked effect being on G13. This contrasts with the effect of the
C7U7 mutation.
Figure 5. Total free energy, and contribution each residue. a) Computed Gassoc (most stable complexes
on the left) in presence and absence of Mg2+. Black symbols: average over the entire trajectory. Smaller
symbols: the average values over each 50‐ns chunk of the trajectory, showing that the differences are significant. The stability ordering in the presence of Mg2+ is CC > UC > CU > UU, in agreement with the
experiment. The stabilities of UC and CC are very close in the absence of Mg2+. The values are given in
Supplementary Table S1. b) Decomposition of G per residue (see text) in presence of Mg2+, highlighting
which residues are most influenced by each mutation: the entire loop plus the closing base pair (residues 6 to 13 and 24 to 31) are influenced by a single CU mutation.
The pairing base G30 has a more favorable energy contribution in the case of C7 (‐7.2 kcal/mol for CC and
CU) than in the case of U7 (‐3.4 kcal/mol for UC and ‐1.8 kcal/mol for UU), reflecting the number of
hydrogen bonds in the wobble base pair. But importantly, the contribution of nearest neighbor base pairs changes as well. For the base pair C6G13, and for the G‐tract in the loop of UC, the interaction
energy is slightly more favorable for UC than for CC, while the direct neighbors of G30 (C29 and G31) are
little affected. The stem residues, apart from the closing base pair, are not affected, but the loop residues are each a little affected by the mutations. As a result, the addition of all these contributions nearly counterbalances the loss of free energy upon C7U7 mutation, whereas the C12U12 mutation is
more unfavorable. An important take‐home message is that the whole kissing loop and the closing base pairs of the hairpin must be taken into account to understand the effect of the mutation.
4.2. PBSA of the loop‐loop interaction
Going back to the global structure is required to understand the interplay between the mutated residue and the other residues of the kissing loop motif. In order to visualize the position‐dependent effect of the G•U and G•C base pairs, we computed the electrostatic potential of the loop‐loop interaction with the Poisson Boltzmann surface area (PBSA). The tunnel of the kissing complex has on one side a stretch of cytosines (C26–C29 from the target K1) and on the other side a stretch of guanines (G8–G11 from the
ligands K1’). The cytosines display positive charges in the major groove, due to the NH2 groups. Accordingly, Figure 6 shows a surface highlighted in blue and defining an electropositive surface. In contrast, the guanines possess two electronegative atoms (N7 and O6) in the major groove, giving rise to an electronegative surface, in red in Figure 6. Figure 6. The tunnel electrostatic potential surfaces by PBSA. The general structure of the kissing complex is shown on the left, where K1 is in gray and the ligand K1’ in cyan with the position in 3D of the closing base pairs N7•G30 and N12•G25. The potential surface is calculated via non‐linear Poisson
Boltzmann surface area on an average structure from the window frame 50 to 80 ns for the systems
5UC3, 5CC3 and 5CU3. The red surfaces represent a negative electrostatic potential, which is observed
along the backbone, along the stretches of guanines (O6 and N7 atoms of the residues G9, G10, G11) in
the bottom view and on the atom O4 of the residues U7 and U12 towards the interior of the tunnel. The
blue surface represents a positively charged area, which is observed along the stretches of cytosines (NH2 atoms of the residues C27, C28, C29) in the top view and on the NH2 atoms of the residues C7 and C12
towards the interior of the tunnel.
The presence of a G•U wobble base pair provides a distinctive electrostatic feature in the major groove, with the protrusion of the electronegative O4 of the uracil into the tunnel. Consequently, when the G•U is positioned at the 5’ end of the loop (UC), the protrusion of the electronegative O4 of the uracil is facing the stretch of electropositive cytosines of the receptor K1, and this is energetically favorable. In contrast, when the G•U is positioned in the 3’ end of the loop (CU and UU), the protruding electronegative O4 of the Uracil is now facing the stretch of electronegative guanine of the ligand, which is less favorable (Figure 6). Thus, the description of the electrostatic surface of the entire loop/loop region is necessary to understand why the effect of the CU mutation is position‐dependent. 5. Towards predicting when a G•U mutation will stabilize a kissing complex In order to test our hypothesis, we constructed another series of kissing complexes, named K3, with a C‐ tract in the loop of the target hairpin instead of the G‐tract of K1 (Figure 7). With the change of electrostatics in the tunnel, the effect of the G•U wobble base position should be the opposite as in K1. This is what is observed experimentally (Figure 7b). In this complex, the surface of the K1 hairpin switched from positively charged to a negatively charged surface. Therefore, the position of the uracil from the G30•U7 base pair does not benefit anymore for a favorable environment, however the G25•U12
is more favorable which explains the switch in affinity. In this example, owing to the drastic change in electrostatics occurring in the tunnel surface, a simple reasoning enables one to predict on which side the U would be more favorable. However in the presence of more subtle electrostatic changes, calculating an affinity score is necessary. The three systems were modeled, built and equilibrated as described in the materials and methods, but here no MD production was run. In order to evaluate an affinity score, we summed the per‐residue contributions of the all loop residues, plus the first base pair (Figure 7a). On the four original complexes K1, the simplified affinity score correctly accounts for the stability order. In the case of the K3 series, the affinity score correctly predicts that a U at position 12 is now more favorable than at position 7. Although crude (for example, CU is predicted to be as stable as CC, but experimentally it is less stable), the simplicity and speed of the calculation makes it promising to make rough predictions and design new sequence variants and estimate their change of affinity. Experimental validation remains necessary.
Figure 7. Effect of loop electrostatics on the stability of mutated complexes. The K1 series was mutated in its loop‐loop region to switch cytosines and guanines, to create the K3 series. a) Computed affinity score (no Mg2+): the per‐residue contributions of the loop and the first stem base pair of each hairpin were summed. b) Experimental results on the relative stability of the KC in 150 mM NH4OAc. The most stable complexes appear on the left. The experimental stability ordering of CU and UC is correctly predicted by the calculation.
Conclusions
Here we investigated the sequence effect in the formation of a RNA kissing complex. We show, that a G•U wobble base pair provides a favorable environment for the kissing complex to form due to its specific geometry. We also underlined the crucial role of the identity of the base pairing in the whole loop‐loop motif. Thus a strategically placed non‐canonic base pair might affect the interaction towards a better affinity. However, predicting the stabilizing effect of a G•U base pair requires considering all residues close in space, beyond the nearest neighbors. In the case of kissing loop complexes, this means that all residues of the loop influence the global stability of the complex. In a case of a G•U wobble base pair, the protrusion of the electronegative O4 atom of the uracil towards the major groove and into the tunnel of the loop‐loop interaction allows one to understand that this is favorable only when this protrusion is made in the direction of an electropositive pocket, here provided by the cytosine residues. These conclusions might lead to the understanding of the electrostatic impact of the introduction of a G•U wobble base pair and may be a lead for a promising approach for the rational engineering of affine kissing complexes. We can envision that by strategically placing non‐canonical base pairs such as G•U and G•A with defined geometry and with unique profiles of donor and acceptors in the major groove, we can take advantage of this structural characteristics to rationally design new aptamers with higher affinity, for therapeutic, nanotechnology or analytical applications. One should however not forget thatRNA aptamer structure, ligand specificity and ligand affinity depend on the ionic environment,[19] and that exploring the effect of the divalent ions is necessary if different specific binding sites are involved. Also, affinity is not the sole selection criteria. Kinetics might also be crucial, especially in therapeutics. In that respect, investigating the effects of mutations and of magnesium concentration on the reaction dynamics is worthy of further exploration.
Experimental Section
Oligonucleotides. RNA oligonucleotides were purchased in lyophilized form from Integrated DNA Technology (Leuven, Belgium) with standard desalting. They were dissolved in RNAse free water (Ambion, Fisher Scientific, Illkirch, France), then diluted to a stock solution at 100 µM of each hairpin in 150 mM Ammonium Acetate NH4OAc (prepared from BioUltra ≈ 5 M stock solution, Fluka, Sigma‐ Aldrich, Saint‐Quentin Fallavier, France). This solution was desalted using Amicon Ultra‐0.5 3K ultrafiltration devices (Merck Millipore, Saint‐Quentin en Yvelines, France). The sequences were then heated at 90°C during 90 s, then immediately placed on ice and allowed to cool for 10 min, then stored at 4°C. All the injected solutions were prepared at least one day prior to the experiment. The injected solutions were 10 µM of each hairpin in 150 mM NH4OAc. 2 µM DNA oligonucleotide dT6 was added asan internal standard. For the Mg‐dependent experiments, an Mg(OAc)2 solution (Sigma‐Aldrich, Saint‐ Quentin Fallavier, France) is added to obtain the desired concentrations. Native Electrospray Ionization Mass Spectrometry (ESI‐MS). Experiments were performed on an Agilent 6560 DTIMS‐Q‐TOF instrument (Agilent Technologies, Santa Clara, CA), with the dual‐ESI source operated in negative ion mode. The syringe pump flow rate was 180 µL/h. The drift tube was fill with helium and the pressure in the drift tube was 3.89 ± 0.01 Torr, and the pressure in the trapping funnel is 3.67 ± 0.01 Torr (this ensures that only helium is present in the drift tube). The source temperature and fragmentor voltage were set at 200°C and 350 V, and the Trap Entrance Grid Delta fixed at 12 V (Trap entrance Grid low 105 V, Trap Entrance Grid High 117 V). All these parameters ensured a good desolvation/declustering and transmission of ions, without causing any dissociation of the complexes. Generation of the structural models. The RNA models were constructed using the webserver of ModeRNA,[20] with the NMR structure of TAR/TAR* (PDB ID=2RN1)[21] as template. The complexes were
neutralized with either only Na+ ions or with a mixture of 30 Na+ and 2 Mg2+ (magnesium parameters
from reference [22]) and hydrated with TIP3P water molecules[23] in a truncated octahedron. The sodium‐
only simulations were run first. Then the initial placement of Mg2+ was decided based on the sodium simulations, wherein we found two high‐density regions (In the loop‐loop region and at the exit of the tunnel, see supplementary Figure S6) for all four systems. Thus magnesium ions do not have to explore the whole octahedron to find their most affine binding sites. The obtained structures were then minimized and equilibrated using the module pmemd.MPI of Amber12[24] suite of packages, using the parmbsc0+χOL3 force field.[25] We applied periodic boundary conditions at constant temperature (300 K) and pressure (1 bar) using the Berendsen algorithm.[26] Covalent bonds involving hydrogens were restrained using SHAKE,[27] allowing for a 2‐fs integration time‐step. Long‐range electrostatic interactions were treated using the particle mesh Ewald (PME)[24] algorithm with a radial cutoff of 9 Å ; the same cut‐ off was used for the van der Waals interactions. The non‐bonded pair‐list was updated heuristically and the center‐of‐mass motion removed every 10 ps. Water molecules and counter‐ions were energy‐
minimized (steepest descent followed by conjugate gradient), and equilibrated at 100 K for 100 ps at constant volume and temperature while RNA molecules were positionnally restrained. The whole system was then heated from 100 K to 300 K in 10 ps by 5‐K increments with harmonic positional restraints on solute atoms (5.0 kcal/mol/Å2 force constant). The simulation was continued at constant pressure and temperature, with positional restraints gradually removed over 250 ps. Molecular dynamics simulations. MD production runs (listed in Table 1) started from the end point of the equilibration. The cpptraj[28] module of AmberTools14[29] was used to calculate the hydrogen bond
occupancies, by taking snapshots from 50 ns to 300 ns with a step of 5ps. The statistical analysis was carried out using the R package.[30] Image rendering was performed with tachyon in VMD,[31] and the
helicoidal parameters were calculated with curves+.[32] Thermodynamics calculations. MMPBSA analyses: The binding energies of the hairpins were computed using the molecular mechanics Poisson–Boltzmann surface area (MMPBSA) approaches,[14] implementing the MMPBSA.py script.[33] The ΔG assoc is composed of the changes in the molecular mechanical gas phase energy (ΔEMM), entropic contribution, and solvation free energy: ∆ ∆ ∆ ∆ (5) ΔGsolv is estimated by solving the linearised Poisson Boltzman equation for each of the three states
(ΔGpolar) and adding an empirical term for hydrophobic contributions to it (ΔGnonpolar). The hydrophobic
contribution is calculated from the solvent accessible surface area (SASA). We assume that the entropic contribution of the four systems will be in the same order because of only slight differences in atomic composition, therefore the entropic contribution is neglected from the calculations that aim at comparing the mutants. PBSA analyses: We used the non‐linear Poisson‐Boltzmann solver (PBSA)[34] in AmberTools14[29] for the calculation of the electrostatic potential surface. The interior (solute/molecule) and exterior (solvent) dielectric constants were set to 2 and 80, respectively. The temperature was set to 300 K, a solvent probe radius of 1.4 Å was used to define the dielectric boundary, a 150 mM ionic strength and a PB grid resolution of 0.5 Å were chosen.
Acknowledgements
This work was supported by the European Research Council (ERC DNAFOLDIMS to VG) and the CNRS (post‐doctoral fellowship to JAG).References
[1] M. Mascini, I. Palchetti, S. Tombelli, Angew. Chem. Int. Ed. 2012, 51, 1316-1332. [2] M. Mandal, R. R. Breaker, Nat. Rev. Mol. Cell Biol. 2004, 5, 451-463.
[3] M. Darmostuk, S. Rimpelova, H. Gbelcova, T. Ruml, Biotechnol. Adv. 2015, 33, 1141-1161. [4] a) C. Boiziau, E. Dausse, L. Yurchenko, J. J. Toulme, J Biol Chem 1999, 274, 12730-12737; b) F. Ducongé, C. Di Primo, J. J. Toulmé, J. Biol. Chem. 2000, 275, 21287-21294; c) L. Aldaz-Carroll, B. Tallet, E. Dausse, L. Yurchenko, J. J. Toulme, Biochemistry 2002, 41, 5883-5893; d) K. Kikuchi, T. Umehara, K. Fukuda, J. Hwang, A. Kuno, T. Hasegawa, S. Nishikawa, J. Biochem. 2003, 133, 263-270.
[5] A. Wittmann, B. Suess, FEBS Lett 2012, 586, 2076-2083.
[6] a) J. C. Paillart, E. Skripkin, B. Ehresmann, C. Ehresmann, R. Marquet, Proc. Natl. Acad. Sci.
USA 1996, 93, 5572-5577; b) J. Tomizawa, Cell 1986, 47, 89-97.
[7] a) A. M. Pyle, S. Moran, S. A. Strobel, T. Chapman, D. H. Turner, T. R. Cech, Biochemistry 1994,
33, 13856-13863; b) J. Chen, A. Ganguly, Z. Miswan, S. Hammes-Schiffer, P. C. Bevilacqua, B. L.
Golden, Biochemistry 2013, 52, 557-567.
[8] W. H. McClain, Proc. Natl. Acad. Sci. USA 2006, 103, 4570-4575.
[9] a) F. H. Allain, G. Varani, Nucleic Acids Res 1995, 23, 341-350; b) L. R. Stefan, R. Zhang, A. G. Levitan, D. K. Hendrix, S. E. Brenner, S. R. Holbrook, Nucleic Acids Res 2006, 34, D131-134; c) G. Varani, W. H. McClain, EMBO Rep 2000, 1, 18-23.
[10] a) E. Dausse, A. Barre, A. Aime, A. Groppi, A. Rico, C. Ainali, G. Salgado, W. Palau, E.
Daguerre, M. Nikolski, J. J. Toulme, C. Di Primo, Biosens. Bioelectron. 2016, 80, 418-425; b) G. Durand, E. Dausse, E. Goux, E. Fiore, E. Peyrin, C. Ravelet, J. J. Toulme, Nucleic Acids Res. 2016, 44, 4450-4459.
[11] D. Xu, T. Landon, N. L. Greenbaum, M. O. Fenley, Nucleic Acids Res. 2007, 35, 3836-3847. [12] a) F. Beaurain, C. Di Primo, J.-J. Toulmé, M. Laguerre, Nucleic Acids Res. 2003, 31, 4275-4284; b) K. Reblova, N. Spackova, J. E. Sponer, J. Koca, J. Sponer, Nucleic Acids Res. 2003, 31, 6492-6952; c) J. Golebiowski, S. Antonczak, J. Fernandez-Carmona, R. Condom, D. Cabrol-Bass, J. Mol. Model.
2004, 10, 408-417.
[13] a) A. A. Chen, D. E. Draper, R. V. Pappu, J. Mol. Biol. 2009, 390, 805-819; b) A. Singh, L. Sethaphong, Y. G. Yingling, Biophys. J. 2011, 101, 727-735.
[14] a) P. A. Kollman, I. Massova, C. Reyes, B. Kuhn, S. Huo, L. Chong, M. Lee, T. Lee, Y. Duan, W. Wang, O. Donini, P. Cieplak, J. Srinivasan, D. A. Case, T. E. Cheatham, 3rd, Acc. Chem. Res. 2000, 33, 889-897; b) J. Srinivasan, T. E. Cheatham, P. Cieplak, P. A. Kollman, D. A. Case, J. Am. Chem. Soc.
1998, 120, 9401-9409; c) J. Srinivasan, J. Miller, P. A. Kollman, D. A. Case, J. Biomol. Struct. Dyn. 1998,
16, 671-682.
[15] S. Genheden, U. Ryde, Exp. Opin. Drug Discov. 2015, 10, 449-461. [16] A. Singh, L. Sethaphong, Y. G. Yingling, Biophys. J. 2011, 101, 727-735.
[17] A. Perez, A. Noy, F. Lankas, F. J. Luque, M. Orozco, Nucleic Acids Res. 2004, 32, 6144-6151. [18] a) X. Du, Y. Li, Y. L. Xia, S. M. Ai, J. Liang, P. Sang, X. L. Ji, S. Q. Liu, Int. J. Mol. Sci. 2016, 17; b) U. Ryde, P. Soderhjelm, Chem. Rev. 2016, 116, 5520-5566.
[19] M. Ilgu, T. Wang, M. H. Lamm, M. Nilsen-Hamilton, Methods 2013, 63, 178-187.
[20] a) M. Rother, K. Rother, T. Puton, J. M. Bujnicki, Brief. Bioinform. 2011, 12, 601-613; b) M. Rother, K. Rother, T. Puton, J. M. Bujnicki, Nucleic Acids Res. 2011, 39, 4007-4022.
[21] H. Van Melckebeke, M. Devany, C. Di Primo, F. Beaurain, J. J. Toulmé, D. L. Bryce, J. Boisbouvier, Proc. Natl. Acad. Sci. USA 2008, 105, 9210-9215.
[22] O. Allner, L. Nilsson, A. Villa, J. Chem. Theor. Comput. 2012, 8, 1493-1502.
[23] a) W. L. Jorgensen, J. Chandrasekhar, J. D. Madura, R. W. Impey, M. L. Klein, J. Chem. Phys.
1983, 79, 926-935; b) M. Mahoney, W. Jorgensen, J. Chem. Phys. 2000, 112, 8910-8922.
[24] AMBER 12. D. A. Case, T. A. Darden, T.E. Cheatham, III, C. L. Simmerling, J. Wang, R. E. Duke, R. Luo, M. Crowley, R. C. Walker, W. Zhang, K. M. Merz, B.Wang, S. Hayik, A. Roitberg, G. Seabra, I. Kolossváry, K.F.Wong, F. Paesani, J. Vanicek, X.Wu, S. R. Brozell, T. Steinbrecher, H. Gohlke, L. Yang, C. Tan, J. Mongan, V. Hornak, G. Cui, D. H. Mathews, M. G. Seetin, C. Sagui, V. Babin, P. A. Kollman, University of California, San Francisco, 2008.
[25] a) P. Banáš, D. Hollas, M. Zgarbová, P. Jurečka, M. Orozco, T. E. Cheatham, J. Šponer, M. Otyepka, J. Chem. Theor. Comput. 2010, 6, 3836-3849; b) M. Zgarbova, M. Otyepka, J. Sponer, A. Mladek, P. Banas, T. E. Cheatham, 3rd, P. Jurecka, J. Chem. Theor. Comput. 2011, 7, 2886-2902. [26] H. J. C. Berendsen, J. P. M. Postma, W. F. van Gunsteren, A. Dinola, J. R. Haak, J. Chem. Phys.
1984, 81, 3684-3690.
[27] W. F. van Gunsteren, H. J. C. Berendsen, Mol. Phys. 1977, 34, 1311-1327. [28] D. R. Roe, T. E. Cheatham, J. Chem. Theor. Comput. 2013, 9, 3084-3095.
[29] J. T. B. D.A. Case, R.M. Betz, D.S. Cerutti, T.E. Cheatham, III, T.A. Darden, R.E. Duke, T.J. Giese, H. Gohlke, A.W. Goetz, N. Homeyer, S. Izadi, P. Janowski, J. Kaus, A. Kovalenko, T.S. Lee, S. LeGrand, P. Li, T. Luchko, R. Luo, B. Madej, K.M. Merz, G. Monard, P. Needham, H. Nguyen, H.T. Nguyen, I. Omelyan, A. Onufriev, D.R. Roe, A. Roitberg, R. Salomon-Ferrer, C.L. Simmerling, W. Smith, J. Swails, R.C. Walker, J. Wang, R.M. Wolf, X. Wu, D.M. York and P.A. Kollman, University of California, San Francisco. 2015.
[30] R core team, R Foundation for Statistical Computing, Vienna, Austria, 2015. [31] W. Humphrey, A. Dalke, K. Schulten, J. Mol. Graph. 1996, 14, 33-38, 27-38.
[32] R. Lavery, M. Moakher, J. H. Maddocks, D. Petkeviciute, K. Zakrzewska, Nucleic Acids
Res. 2009, 37, 5917-5929.
[33] B. R. Miller, T. D. McGee, J. M. Swails, N. Homeyer, H. Gohlke, A. E. Roitberg, J. Chem.
Theor. Comput. 2012, 8, 3314-3321.
[34] Q. Cai, M.-J. Hsieh, J. Wang, R. Luo, J. Chem. Theor. Comput. 2010, 6, 203-211.