HAL Id: hal-03217707
https://hal.sorbonne-universite.fr/hal-03217707
Submitted on 5 May 2021
HAL is a multi-disciplinary open access
archive for the deposit and dissemination of
sci-entific research documents, whether they are
pub-lished or not. The documents may come from
teaching and research institutions in France or
abroad, or from public or private research centers.
L’archive ouverte pluridisciplinaire HAL, est
destinée au dépôt et à la diffusion de documents
scientifiques de niveau recherche, publiés ou non,
émanant des établissements d’enseignement et de
recherche français ou étrangers, des laboratoires
publics ou privés.
Assessment of Caudate Atrophy in Huntington’s Disease
Nina Mansoor, Tishok Vanniyasingam, Ian Malone, Nicola Hobbs, Elin Rees,
Alexandra Durr, Raymund Roos, Bernhard Landwehrmeyer, Sarah Tabrizi,
Eileanoir Johnson, et al.
To cite this version:
Nina Mansoor, Tishok Vanniyasingam, Ian Malone, Nicola Hobbs, Elin Rees, et al.. Validating
Auto-mated Segmentation Tools in the Assessment of Caudate Atrophy in Huntington’s Disease. Frontiers
in Neurology, Frontiers, 2021, 12, pp.616272. �10.3389/fneur.2021.616272�. �hal-03217707�
ORIGINAL RESEARCH published: 14 April 2021 doi: 10.3389/fneur.2021.616272
Edited by: Pia Charlotte Sundgren, Lund University, Sweden Reviewed by: Paul Gerson Unschuld, Université de Genève, Switzerland Ivan Milenkovic, Medical University of Vienna, Austria *Correspondence: Rachael I. Scahill r.scahill@ucl.ac.uk
Specialty section: This article was submitted to Applied Neuroimaging, a section of the journal Frontiers in Neurology Received: 11 October 2020 Accepted: 15 March 2021 Published: 14 April 2021 Citation: Mansoor NM, Vanniyasingam T, Malone I, Hobbs NZ, Rees E, Durr A, Roos RAC, Landwehrmeyer B, Tabrizi SJ, Johnson EB and Scahill RI (2021) Validating Automated Segmentation Tools in the Assessment of Caudate Atrophy in Huntington’s Disease. Front. Neurol. 12:616272. doi: 10.3389/fneur.2021.616272
Validating Automated Segmentation
Tools in the Assessment of Caudate
Atrophy in Huntington’s Disease
Nina M. Mansoor1, Tishok Vanniyasingam1, Ian Malone2, Nicola Z. Hobbs1, Elin Rees3,
Alexandra Durr4, Raymund A. C. Roos5, Bernhard Landwehrmeyer6, Sarah J. Tabrizi1,
Eileanoir B. Johnson1and Rachael I. Scahill1*
1Department of Neurodegenerative Disease, Huntington’s Disease Centre, University College London Queen Square Institute
of Neurology, University College London, London, United Kingdom,2Department of Neurodegenerative Disease, Dementia
Research Centre, University College London Queen Square Institute of Neurology, University College London, London, United Kingdom,3IXICO plc, Griffin Court, Long Lane, London, United Kingdom,4Sorbonne Université, Institut du
Cerveau/Paris Brain Institute AP-HP, INSERM, CNRS, University Hospital Pitié-Salpêtrière, Paris, France,5Department of
Neurology, Leiden University Medical Centre, Leiden, Netherlands,6Department of Neurology, Ulm University, Ulm, Germany
Background: Neuroimaging shows considerable promise in generating sensitive and objective outcome measures for therapeutic trials across a range of neurodegenerative conditions. For volumetric measures the current gold standard is manual delineation, which is unfeasible for samples sizes required for large clinical trials.
Methods: Using a cohort of early Huntington’s disease (HD) patients (n = 46) and controls (n = 35), we compared the performance of four automated segmentation tools (FIRST, FreeSurfer, STEPS, MALP-EM) with manual delineation for generating cross-sectional caudate volume, a region known to be vulnerable in HD. We then examined the effect of each of these baseline regions on the ability to detect change over 15 months using the established longitudinal Caudate Boundary Shift Integral (cBSI) method, an automated longitudinal pipeline requiring a baseline caudate region as an input.
Results: All tools, except Freesurfer, generated significantly smaller caudate volumes than the manually derived regions. Jaccard indices showed poorer levels of overlap between each automated segmentation and manual delineation in the HD patients compared with controls. Nevertheless, each method was able to demonstrate significant group differences in volume (p < 0.001). STEPS performed best qualitatively as well as quantitively in the baseline analysis. Caudate atrophy measures generated by the cBSI using automated baseline regions were largely consistent with those derived from a manually segmented baseline, with STEPS providing the most robust cBSI values across both control and HD groups.
Conclusions: Atrophy measures from the cBSI were relatively robust to differences in baseline segmentation technique, suggesting that fully automated pipelines could be used to generate outcome measures for clinical trials.
INTRODUCTION
Huntington’s disease (HD) is a devastating autosomal dominant neurodegenerative disorder caused by an expansion of CAG (cytosine-adenine-guanine) trinucleotide repeat in the huntingtin gene (HTT, located on chromosome 4p16.3), encoding for huntingtin protein (1). HD patients typically have CAG repeats of >39, leading to full disease penetrance and a triad of symptoms including motor impairment, cognitive decline and psychiatric features. The mutated huntingtin protein has toxic properties causing neuronal dysfunction and death, with the medium spiny neurons in the striatum being particularly sensitive to this pathology (2). The hallmark of HD neuropathology is neurodegeneration in the caudate and putamen which becomes widespread as the disease progresses and has been demonstrated in numerous post-mortem studies (3).
Clinical trials in HD are focussed on designing and delivering disease-modifying drugs targeting mutated HTT RNA and DNA early in the disease or even prior to symptom onset (pre-HD) (4–8). Structural MRI has the ability to detect significant caudate atrophy and other atrophic changes in gene positive participants in vivo even a decade prior to symptom onset (9–12), and thus currently appears to be a promising outcome measure for clinical trials to assess efficacy of new drug therapies, when functional measures may lack sensitivity (13–16).
Currently, manual delineation is the gold standard for caudate segmentation on T1-weighted MRI imaging and has been performed in large HD observational studies (9,10) to examine volume loss with disease progression. Manually delineating the caudate or region of interest (ROI) can achieve highly accurate volumetric outputs and considered close to “ground truth.” However, this process is labor-intensive requiring anatomical expertise, training and a priori information about the structure of interest, thus limiting its feasibility in large longitudinal studies with imaging data at multiple time points and in clinical trials. There are also challenges surrounding inter- and intra-rater reliability, including intra-rater drift. There is clearly a need for alternative automated segmentation tools to aid or, potentially substitute, manual delineation in subcortical segmentation. Automated tools offer the advantage of being less time consuming, with the addition of being more flexible allowing multiple subcortical structures to be segmented simultaneously. However, the reliability and accuracy of new tools need to be examined in clinical cohorts, as many of these tools have been developed with healthy controls/atlases and not designed for highly variable brains structures including atrophied brains. Additionally, their application to imaging data across scanning platforms need to be validated as data may be affected by image quality differences (contrast, signal-to-noise ratio etc.).
Several studies have previously used automated segmentation procedures to assess caudate atrophy in both gene-positive participants not yet manifesting symptoms (pre-HD) and symptomatic HD cohorts cross-sectionally (17, 18) and longitudinally (11,12,19–21); few studies have cross-sectionally compared different automated tools with manual delineation of the caudate (22–25), but none have assessed the impact of
baseline segmentation algorithm on longitudinal measures of change.
The aim of the current study was therefore to apply four different automated tools to the same imaging data from a cohort of controls and early HD participants and compare this with manually delineated caudates at baseline. Additionally, we investigated the Boundary Shift Integral (BSI) (26) a technique previously utilized in HD to measure longitudinal volumetric change in the caudate (cBSI) (27). The cBSI is a semi-automated technique, requiring a baseline caudate region per subject as an input. Currently this baseline region is generated by manual delineation. We compared the cBSI measure of change generated by manual caudate region with that produced by our four automated tools to determine how variability in baseline segmentation impacts this measure of change. This could potentially inform future use of automated segmentation tools and application in longitudinal datasets assessing caudate atrophy.
MATERIALS AND METHODS
Participants
Participants were recruited from four sites (London, Leiden, Paris and Ulm) of the observational 3T MRI neuroimaging Work Package 2 (WP2) PADDINGTON study (Pharmacodynamic Approaches to Demonstration of Disease-modification in Huntington’s Disease by SEN0014196). Participants attended MRI scanning and clinical visits which included motor, cognitive and neuropsychiatric testing at baseline, 6 and 15 months from 2011 to 2013. Inclusion criteria have been published previously (28). Briefly, early HD participants (with CAG ≥ 39) were within stage 1 of the disease as defined by UHDRS Total Functional Capacity (TFC) ≥11. Disease burden (a measure of disease progression) can be calculated from age and CAG repeat length (29). Controls were spouses, partners or gene negative siblings. Participants were between 18 and 65 years of age, free from major psychiatric and concomitant neurological disorders and not participating in a clinical drug trial and able to tolerate and safely undergo MRI. The study was approved by the local ethics committees and written informed consent was obtained from each participant.
For the current study a subset of the 3T MRI baseline imaging data from 35 controls and 46 early HD participants were included for analysis retrospectively as they had passed initial quality control (i.e., no gross MRI artifacts) and were processed using automated caudate segmentation tools. Imaging data for the same participants were obtained at 15 months post baseline for the longitudinal analysis.
Data Acquisition
3T MRI data was acquired based on protocols standardized for multi-site use (10). High-resolution three-dimensional T1-weighted structural scans were acquired on a Phillips Achieva (Leiden) and three Siemens scanners: Tim trio (London), Verio (Paris), Allegra (Ulm). In brief, for T1-weighted scans three-dimensional magnetization-prepared rapid gradient echo (MP-RAGE) protocols were used to acquire contiguous sagittal slices
Mansoor et al. Automated Caudate Segmentation in HD
with 1 mm (London, Paris, Leiden) and 1.1 mm (Ulm) slice thickness, with no inter-slice gap, giving full brain coverage. The Philips parameters were TR= 7.7 ms, TE=3.5 ms, FOV= 24 cm, matrix size =224 × 224,164. For Siemens scanners TR=229 ms, TE 2.2 ms (2.81 for Ulm), FOV=28 cm, Matrix=256 × 256, 208. Quality checks of imaging data was undertaken by UCL Institute of Neurology, London (UK), to ensure compliance with relevant acquisition protocols, minimal artifacts (e.g., movement) and sufficient tissue contrast for analysis. Rescans were undertaken where necessary.
Data Analysis
T1-weighted baseline scans were processed using five different segmentation methods using standardized procedures:
• Manual delineation as part of the PADDINGTON standard operating procedure (SOP) using in-house MIDAS (Medical information Display and Analysis System) software, as described previously (26,27).
• FSL FIRST version 5.0.9 (FMRIB Integrated Registration and Segmentation Tool, available as part of FSL software) (30), with FSL BET performed prior to FIRST
• FreeSurfer version 5.3.0 (31).
• STEPS (Similarity and Truth Estimation for Propagated Segmentations), based on the STAPLE algorithm (32). • MALP-EM version 1.2 (Multi Atlas Label Propagation with
Expectation Maximization-Based Refinement) (33).
The baseline regions from each of these five segmentation methods were also used to produce estimates of the caudate BSI (cBSI). This uses the change in voxel intensity between two MRI scans from the same participant to infer volume change in boundaries of a defined region of interest (ROI); following baseline caudate segmentation, the ROI is expanded by two voxels which is then used to register the baseline imaging data to the repeat scan by rigid alignment. This ROI encompasses the shift of the caudate boundary between the two imaging time points. We generated the caudate atrophy value by using the three-dimensional integral of the boundary shift (in terms of voxel intensities) within this ROI as previously described (27). Different cBSI values were generated due to differences in defined caudate regions as segmented by the five different segmentation tools. Positive cBSI values represent inward boundary shift and hence tissue loss. Negative cBSI values represent outward boundary shift and thus tissue gain, likely to result from shifting tissue in response to local tissue atrophy. Image processing was performed blinded to disease status.
Quality Control
Visual assessment and quality control (QC) of baseline caudate segmentations from the four automated tools was performed by overlaying ROIs on their original T1-weighted images and viewing them simultaneously in MIDAS. This enabled comparison of automated tools, the boundaries of segmented regions and the visible caudate boundaries on the T1 scans. Quality control was carried out blinded to disease status and study site. Scans were visually assessed in axial and sagittal planes, slice by slice, to characterize and qualitatively
establish segmentation patterns, common minor errors and gross segmentation failures for each tool.
Quality control was repeated in a similar fashion for the cBSI overlays. Biologically implausible segmentations or gross failures were considered on visual assessment if segmentations did not include regions of caudate as defined by known anatomical boundaries (by the lateral ventricle medially, and the internal capsule (IC) laterally in the axial plane). Scans with minor errors, including irregular segmentation borders or outlines, lone voxels and/or visible under-/overestimations of caudate, but where the majority of segmented region was still within caudate boundaries, was classified as “pass” and included in the baseline and longitudinal analysis. In the current study no adjustments were made to any of the automated processing stages, nor was there any manual intervention or editing of the ROI following completed automated segmentation; this was to assess the default capability and reliability of the automated tools and to avoid any bias inadvertently introduced with manual intervention.
Statistical Analysis
Quantitative analysis was carried out using STATA version 15 and IBM SPSS. For the baseline imaging data, segmented caudate volumes (in mm3) were extracted. The cBSI was used to assess volume change over time and normalized cBSI values were generated by dividing the cBSI values by the participants’ own baseline caudate volume to account for between participant variability in baseline volumes. Summary statistics including means, ranges, standard deviations and boxplots were produced for each method. For group comparisons of volumetrics, cBSI and normalized cBSI, independent t-tests and effect sizes (Cohen’s d) were calculated. To compare automated with manually derived values, paired t-tests and Wilcoxon signed rank test were used. Pearson’s correlation coefficients, Pitman’s test of variance and Bland-Altman plots were generated to evaluate correlation, agreement and scatter ranges. For the Bland-Altman plots, the limits of agreement were the mean difference ± 1.96 × standard deviation (SD) of difference (34). To determine the potential effects of study site on volume outputs, a generalized linear model was generated with site, disease status and interaction of these effects as predictors for the dependent variable i.e., the volume measures obtained from each method. Post-hoc pairwise comparisons test of estimated marginal means using Bonferroni method was performed for statistically significant results.
Similarity and accuracy between baseline manual and automated segmented ROIs were also assessed using Jaccard Similarity Coefficient/Index (35) given as a ratio, where a value close to 1 implies greater spatial overlap and better accuracy between two methods. This was calculated as below (Function 1) using the manual ROI (A) and automated ROI (B), after transformation into MNI space, to generate intersection (A ∩ B) and union (A ∪ B) values.
Further independent t-test, Mann-Whitney U test and effect sizes (Cohen’s d) were employed to assess the differences in overlap measurements in controls and HD participants for each tool. The level of significance for the statistical analysis was set to p < 0.05, and results are reported with 95% CI.
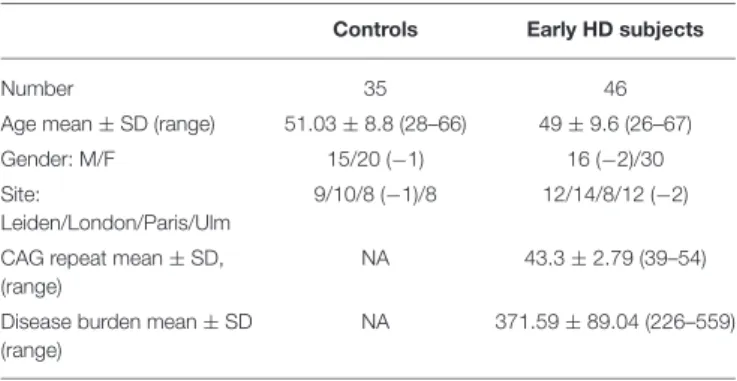
TABLE 1 | Participant demographics.
Controls Early HD subjects
Number 35 46
Age mean ± SD (range) 51.03 ± 8.8 (28–66) 49 ± 9.6 (26–67) Gender: M/F 15/20 (−1) 16 (−2)/30 Site:
Leiden/London/Paris/Ulm
9/10/8 (−1)/8 12/14/8/12 (−2) CAG repeat mean ± SD,
(range)
NA 43.3 ± 2.79 (39–54) Disease burden mean ± SD
(range)
NA 371.59 ± 89.04 (226–559)
CAG, cytosine-adenine-guanine; HD, Huntington’s disease; NA, Not applicable. One female control subject from Paris and 2 male HD subjects from Ulm were excluded after quality control of segmentations (gross failure was identified, and segmentations deemed biologically implausible). These were not included in the quantitative volumetric analysis. Final sample was therefore n = 78.
Function 1: The Jaccard Index was calculated by dividing the intersection by union size.
J (A, B) =|A ∩ B| |A ∪ B| = |A ∩ B| |A| + |B| − |A ∩ B|
RESULTS
Demographics
Participant demographics are outlined in Table 1. Groups were well balanced and there were no significant differences in age between the early HD and the control group (t=0.9170, p=0.3621).
Qualitative Assessment
Based on visual assessment of baseline segmented caudate overlaid on T1-weighted images, tools performed differently; the greatest differences were seen around the medial (between caudate and CSF/ventricle) and lateral (between caudate and IC) boundaries in the axial plane. Typical variation in tool performance with manually delineated caudate reference scan can be found in Supplementary Figure 1.
Software performance and segmentation patterns are described in Supplementary Table 1 and visual assessment with over-and underestimations of caudate volume and cBSI overlays are shown in Supplementary Figures 2–4. STEPS performed best visually, with the appearance of segmented regions looking the most similar to the manually segmented reference regions. MALP-EM was the worst-performing due to frequent underestimations of caudate boundaries on the T1-weighted image. FIRST and FreeSurfer appeared similar; FreeSurfer frequently had crude “boxed” borders, performed less well around curvatures and included non-caudate voxels. It was also noted that scans acquired at the Ulm site had more outliers, and qualitatively scans from this site appeared more noisy, although SNR was not quantified. Similar observations were made on the overlaid cBSI data, with the additional observation
that MALP-EM, which often visually underestimated caudate volume, also displayed a reduced cBSI.
Of the 81 participants whose data underwent QC of the automated segmentations, three baseline scans had gross failures (Supplementary Figure 5); this included two HD participants from the Ulm site segmented by FIRST, and one control participant from Paris segmented by MALP-EM. Volume outputs from these segmentations were unreliable as they did not represent the underlying caudate structure visualized on T1-weighted image. The final number of participants for the baseline volumetric and longitudinal analysis was therefore 34 controls and 44 HD participants.
CROSS-SECTIONAL QUANTITATIVE
ANALYSIS OF THE BASELINE IMAGING
DATA
Raw Caudate Volumetrics
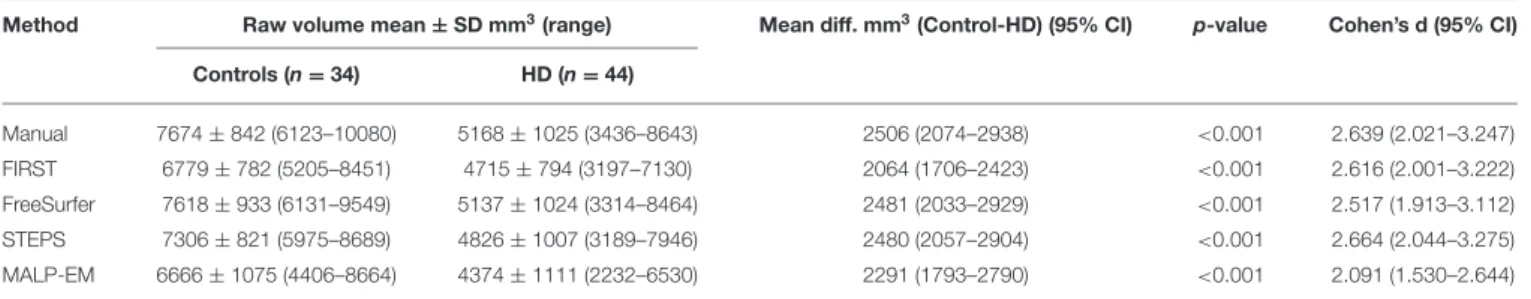
Mean caudate volumes were extracted for controls and early HD patients for each method (Table 2). For all methods the mean caudate volumes were significantly higher in controls compared to early HD participants, p < 0.001 (Figure 1). All methods also found an association between smaller caudate volumes and greater disease burden in HD participants p < 0.05.
Comparison of Volumetric Outputs by
Software
The difference between the mean manual and automated caudate volumes were significant (p < 0.05) using FIRST, STEPS and MALP-EM in both HD participants and controls. While these automated tools underestimated caudate volume, no statistically significant difference in caudate volume outputs between manual and FreeSurfer were found in either HD participants (p=0.619) or controls (p=0.536) (Supplementary Table 2). A strong positive correlation between manual and automated volume outputs (with the exception of MALP-EM in controls, with only a moderate correlation, r=0.376) was demonstrated. Higher Pearson correlation coefficients between manual and automated volumes were found in HD participants compared to controls. A bias for greater volume underestimation in larger caudates was detected for FIRST (HD group only) on Pitman’s variance ratio test and illustrated on Bland-Altman plots; there was no evidence of bias for the other automated tools (Supplementary Figure 6).
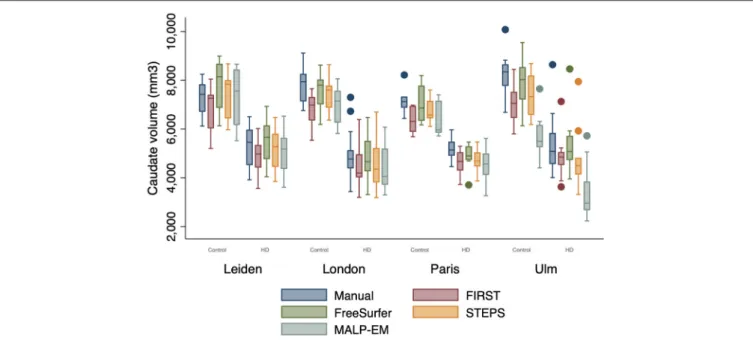
Effect of Site
Volume outputs from scans performed at the Ulm site appeared to have more outliers compared to the other sites (Figure 2). There was no statistically significant effect of site on manual, FIRST and STEPS volume measures (Supplementary Table 3). Whilst site was found to have a statistically significant effect on FreeSurfer volume measures (p=0.033), the post hoc pairwise comparisons test was non-significant. Site was also a statistically significant main effect on MALP-EM volumes, with the post hoc pairwise comparison test demonstrating significant differences between volume measures obtained at the Ulm study site and
Mansoor et al. Automated Caudate Segmentation in HD
TABLE 2 | Raw caudate volume and effect sizes (Cohen’s d) for all techniques (manual and automated tools).
Method Raw volume mean ± SD mm3(range) Mean diff. mm3(Control-HD) (95% CI) p-value Cohen’s d (95% CI)
Controls (n = 34) HD (n = 44) Manual 7674 ± 842 (6123–10080) 5168 ± 1025 (3436–8643) 2506 (2074–2938) <0.001 2.639 (2.021–3.247) FIRST 6779 ± 782 (5205–8451) 4715 ± 794 (3197–7130) 2064 (1706–2423) <0.001 2.616 (2.001–3.222) FreeSurfer 7618 ± 933 (6131–9549) 5137 ± 1024 (3314–8464) 2481 (2033–2929) <0.001 2.517 (1.913–3.112) STEPS 7306 ± 821 (5975–8689) 4826 ± 1007 (3189–7946) 2480 (2057–2904) <0.001 2.664 (2.044–3.275) MALP-EM 6666 ± 1075 (4406–8664) 4374 ± 1111 (2232–6530) 2291 (1793–2790) <0.001 2.091 (1.530–2.644)
Mean diff, mean difference; CI, confidence Interval; SD, standard deviation; dof, degrees of freedom.
FIGURE 1 | Boxplots showing caudate volumes separated by group for each segmentation tool including manual segmentation. Boxes show first quartile, median and third quartile with whiskers representing the smallest and largest volumes. Dots represent outliers. Independent t-tests for each method demonstrated significant volume differences at 95% CI between the two groups, all p < 0.0001.
the other three sites (all p < 0.05) (Supplementary Table 4). The interaction between disease state and site was not a statistically significant effect on volume measures.
Similarity Measures
The Jaccard Indices indicated variable degree of similarity or overlap between manually segmented ROIs with each of the automated segmentations (Supplementary Table 5). Automated segmentations had greater degree of overlaps with manual ROIs in the control group compared to in HD participants, all p < 0.05. Effect sizes show that the largest overlap differences between controls and HD participants were with FreeSurfer segmented regions. STEPS achieved the highest level of overlap with manually segmented ROIs in both controls (0.813 ± 0.028) and HD participants (0.778 ± 0.038). STEPS also reached the highest level of overlap with a Jaccard Index of 0.855 (in both controls and HD participants), followed by FIRST, FreeSurfer and MALP-EM (Figure 3).
LONGITUDINAL ANALYSIS
cBSI and Normalized cBSI
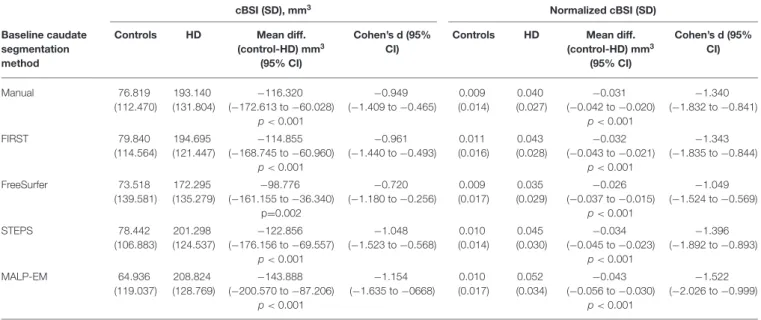
The cBSI and normalized cBSI were significantly greater in HD participants compared to controls using all tools (all p < 0.05) (Table 3), demonstrating greater atrophy in HD participants over the 15-month interval. In the control group, all automated cBSI and normalized cBSI values did not significantly differ when compared to manual delineation with the exception of FIRST which reported significantly greater normalized cBSI values than those obtained with manual delineation (p=0.016). In the HD participants, FreeSurfer generated significantly smaller cBSI values (p=0.021) and normalized cBSI values (p=0.036) compared to manual delineation. There was no statistically significant difference between the MALP-EM cBSI values and those derived manually (p=0.169), however the difference became significant when cBSI was normalized to volume (p=0.001). STEPS demonstrated no significant differences in cBSI and normalized cBSI when compared to manual method in either controls or HD participants. Higher Pearson correlation coefficients were found in control participants (Supplementary Table 6). No significant bias was detected on Bland-Altman plots (Supplementary Figure 7).
DISCUSSION
In this retrospective method comparison study, we assessed four automated segmentation tools with manual delineated caudate in early HD participants and controls across four sites. The aim was to identify tools that could reliably segment caudate regions (using default settings without manual intervention) and potentially substitute manual delineation in future clinical trials with large imaging datasets to track disease progression. We characterized the segmentation outputs qualitatively and quantitatively and examined volume outputs, overlap measures, cBSI and normalized cBSI to establish which tools produced the most similar results to that of manual delineation. Although we have demonstrated that automated segmentation techniques can be used as reliable alternatives to manual delineation, performance can vary depending on the specific tool used, factors related to study site and disease status.
The study highlights the importance of visual QC of segmented imaging data. We found that FreeSurfer demonstrated similar qualitative performance to that previously
FIGURE 2 | Boxplot demonstrating caudate volume outputs by disease state (HD=1, Controls=0) and site. Boxes show first quartile, median and third quartile with whiskers represent the smallest and largest volumes. Dots represent outliers. More outliers were found at the Ulm site.
FIGURE 3 | Boxplot demonstrating Jaccard Indices (as a ratio) for each automated method ROI with manual ROI. Boxes show first quartile, median and third quartile with whiskers represent the smallest and largest volumes. Dots represent outliers. STEPS segmented ROIs had larger overlaps with manually segmented ROI in both controls and HD subjects (closest to 1).
reported in a much smaller pre-HD cohort (23). Whilst MALP-EM has demonstrated good visual accuracy for cortical gray matter segmentation in HD patients (36), MALP-EM and STEPS are relatively unexplored tools in subcortical segmentation. To our knowledge we are the first to report on caudate segmentation patterns and errors by these tools in a pathological cohort and compare this to manual delineation. While not all users of automated tools undertake QC of segmentations, we detected three failed segmentations which were excluded from the
quantitative analysis. Although this was a small number of exclusions, in rare neurodegenerative disorders like HD or in studies with small sample sizes, this could still be significant; the effect of visual QC using FreeSurfer in cortical segmentations have shown to improve reliability and accuracy of segmented imaging data, leading to a substantial decrease in the number of participants needed to be enrolled in a study to detect significant group differences or compensate for increased variance introduced by imaging data not having undergone or passed visual QC (37).
Additionally, on QC we observed that the imaging data obtained from the four study sites differed in quality, despite having employed similar sequence parameters; It is unclear why the T1 weighted MRI images differed in terms of contrast (between gray and white matter structures) and noise, particularly from the Ulm Site. It was felt that despite standardization of acquisition parameters as far as possible, inevitably there are differences between scanner manufacturers (Siemens and Philips) employed at the different sites. The majority of outliers were found in the Ulm HD- group and this may mirror the qualitative findings. There may also have been underlying greater variance in the caudate volumes in the HD participants at this site, as outliers were seen across all methods including manual volumes. These observations were reflected in our generalized linear model, where site had a global effect on MALP-EM volume measure outputs; significantly smaller caudate volumes were obtained from imaging data at Ulm compared to the other sites using MALP-EM. Whilst site appeared to have a global effect on FreeSurfer volume outputs, the post hoc pairwise comparison test was not significant; this may be due to a combination of a weaker significant global effect observed with FreeSurfer and lack of statistical power due to
Mansoor et al. Automated Caudate Segmentation in HD
TABLE 3 | Group comparisons of cBSI and normalized cBSI outputs by baseline caudate segmentation method.
cBSI (SD), mm3 Normalized cBSI (SD)
Baseline caudate segmentation method
Controls HD Mean diff. (control-HD) mm3
(95% CI)
Cohen’s d (95% CI)
Controls HD Mean diff. (control-HD) mm3 (95% CI) Cohen’s d (95% CI) Manual 76.819 (112.470) 193.140 (131.804) −116.320 (−172.613 to −60.028) p <0.001 −0.949 (−1.409 to −0.465) 0.009 (0.014) 0.040 (0.027) −0.031 (−0.042 to −0.020) p <0.001 −1.340 (−1.832 to −0.841) FIRST 79.840 (114.564) 194.695 (121.447) −114.855 (−168.745 to −60.960) p <0.001 −0.961 (−1.440 to −0.493) 0.011 (0.016) 0.043 (0.028) −0.032 (−0.043 to −0.021) p <0.001 −1.343 (−1.835 to −0.844) FreeSurfer 73.518 (139.581) 172.295 (135.279) −98.776 (−161.155 to −36.340) p=0.002 −0.720 (−1.180 to −0.256) 0.009 (0.017) 0.035 (0.029) −0.026 (−0.037 to −0.015) p <0.001 −1.049 (−1.524 to −0.569) STEPS 78.442 (106.883) 201.298 (124.537) −122.856 (−176.156 to −69.557) p <0.001 −1.048 (−1.523 to −0.568) 0.010 (0.014) 0.045 (0.030) −0.034 (−0.045 to −0.023) p <0.001 −1.396 (−1.892 to −0.893) MALP-EM 64.936 (119.037) 208.824 (128.769) −143.888 (−200.570 to −87.206) p <0.001 −1.154 (−1.635 to −0668) 0.010 (0.017) 0.052 (0.034) −0.043 (−0.056 to −0.030) p <0.001 −1.522 (−2.026 to −0.999)
cBSI, caudate Boundary Shift Integral (a measure of longitudinal caudate atrophy); Mean diff, mean difference; CI, confidence Interval; SD, standard deviation.
small sample size. Whilst there will be challenges with multi-site MR data in terms of across- scanner variation and image quality, with possible impact on performance of automated tools, it is felt that the inclusion of multi-center data allows for overall larger sample size (which is of particular importance in rare diseases such as HD) and increased generalisability of the results. Overall, these findings may also indicate that some tools are more data driven, and that their performance is dependent on the quality of the input imaging data, which is predominately determined by scanner used, sequence parameters etc. QC of imaging data is therefore not only essential to determine the reliability of tools to segment anatomically accurate regions for inclusion in a quantitative analysis, but also crucial in deciding what tool to employ in an imaging study given the quality of imaging data to be analyzed and suitability for the specific tool.
A comparison of baseline volumetrics demonstrated that all automated tools could establish group separation in this subset of early HD participants and controls, with HD participants having significantly smaller caudate volumes. Longitudinally, the cBSI and normalized cBSI values showed significant increased caudate atrophy rates in HD participants compared to controls. Both these findings reflect well-known disease characteristics (11, 18–20, 38). Automated tools (FIRST, STEPS and MALP-EM) generated significantly smaller caudate volumes than those derived manually which is consistent with previous reports using other tools such as BRAINS (12), but in contrast to an automated ABV (atlas based volumetry using a binary caudate mask derived from the LONI probabilistic brain atlas) tool that systematically derived larger volumes (24). Whilst FreeSurfer volumes were most similar to those derived manually, the overlap analysis was more in keeping with the qualitative findings, where higher Jaccard Indices were found between manual and STEPS segmented ROIs in both groups. Although FreeSurfer performed well in the simple volumetric comparison,
the slightly poorer overlaps between FreeSurfer and manually segmented ROIs demonstrate that reporting volumetric outputs only, when attempting to validate and assess the utility of tools, is inadequate since these measures do not necessarily reflect spatial agreement between two segmented ROIs. Previous Dice similarity coefficient (DSC) reported by Khan et al. for FreeSurfer and manually segmented caudate in pre-HD was 0.77 (right) and 0.80 (left) (23). The Jaccard Index is closely related to DSC (where DSC=2J/1+J) (39), thus calculated mean FreeSurfer DSC in the current study (0.831 for controls and 0.790 in early HD) demonstrate similar levels of overlap potentially across the HD disease spectrum.
Longitudinally the cBSI and normalized cBSI values were greater in HD participants compared to controls, reflecting the expected increased caudate atrophy rates in HD subjects exceeding the effects of normal aging (18). Hobbs et al. have previously reported increased between-subject variability in caudate volume in HD compared to controls (40), and to account for this, we normalized cBSI to baseline caudate volumes. In the current study, the normalized cBSI measures also led to complete group separation across all segmentation tools, demonstrating that this may be a reliable way to calculate caudate volume change while also accounting for the between-subject variability in baseline caudate volumes. STEPS, which had underestimated baseline volumetrics, was the only tool unaffected by this normalization however, demonstrating no statistically significant difference with manually derived cBSI or the normalized cBSI measures. The findings could indicate that either the baseline volumetric inaccuracy was not large enough to impact on the subsequent cBSI calculations, or that the baseline caudate volume itself does not greatly affect the cBSI. This seems plausible considering that despite FreeSurfer producing the most similar baseline volumetric outputs to those derived manually, it generated smaller cBSI measures than
manually derived measures, becoming significant in the HD group. Automated tools that are unable to generate accurate volume change measures over time would not be reliable in clinical trials assessing treatment effects.
As with the overlap analysis, where all techniques demonstrated greater overlaps in controls compared to HD participants, suggesting that automated tools may be less accurate in atrophied brains, this may also be the case for cBSI measures; from the longitudinal analysis we observed that tools, such as MALP-EM, overestimated normalized cBSI in HD participants but not controls. Some automated tools may be less accurate in generating reliable measures in atrophied brains, both at baseline and longitudinally where atrophic changes occur at an increased rate. However, this would perhaps not impact on their utility in future pre-HD studies, as this group is expected to be more “similar” to normal controls with less extreme subcortical atrophy, compared to that observed in the early HD participants in the current study, but this would need further validation. Studies would also need to assess whether tools would be sensitive to smaller atrophic changes than those observed here with participants in stage 1 of the disease and with imaging data at 15 months from baseline.
A limitation is that more tools could have been assessed, but we included two widely used tools (FIRST and FreeSurfer) along with two unexplored tools (STEPS, MALP-EM) not previously validated in subcortical caudate segmentation in HD. Although STEPS performed well in the current study, a major limitation to its use and application in other clinical cohorts is that it is not currently freely available. Greater consistency between scans that were deemed as a “pass” could also have been established; MALP-EM segmentations for instance, frequently underestimated caudate volume, but passed quality control as segmented ROIs were still considered to be within anatomical boundaries. By including these in the volumetric analysis it was not unexpected that the mean volumes appeared smaller for EM. The types of segmentation errors seen with MALP-EM (including “holes”) were not present with any of the other tools, thus excluding a number of scans with these errors would have wrongfully represented MALP-EM’s ability to accurately carry out segmentations in this cohort. This would also have impacted on the purpose of the study, which was to assess default performance of segmentation tools. Additionally, raw caudate volumes reported for each tool were not normalized for total intracranial volume (TIV). This may have impacted on group comparisons, but this was not the main focus of the study.
CONCLUSION
The study has implications for future HD studies, but results can be extended to other neurodegenerative or pathological cohorts where using automated segmentation tools are becoming essential for large cohorts. Imaging markers that can be sensitively measured to distinguish pathological cohorts from controls are vital for study design development. Equally important is the employment of validated tools that can accurately and reliably detect and longitudinally track disease
progression, enabling assessment of treatment effects in clinical trials. When evaluating which automated tool to use, it will be important to establish how tools have been validated; reporting only raw baseline automated volumetric output comparisons with manually derived volumetrics cannot reliably validate the accuracy of the automated tool. Similarly, the cohort of which the tool has been validated in will be important; as demonstrated in the current study, all tools had poorer overlaps with manually segmented regions in HD participants compared to controls, presumably due to the inability of tools to fully cope with abnormal brain configuration and atrophy.
Ultimately, the best tools would output similar volumes as manually delineated outputs, demonstrate close overlaps (using similarity measures such as Jaccard Index or DSC) with manually segmented ROIs and demonstrate reliable measures of volume change over time. In the current study FreeSurfer demonstrated similar volume outputs but had slightly poorer overlaps and significantly different cBSI measures in the HD group. MALP-EM segmentations were generally poor and FIRST performed less well on baseline and longitudinal measures and would therefore be considered less reliable in the assessment of caudate volume cross -sectionally and longitudinally in this cohort. STEPS was qualitatively the most accurate demonstrating the greatest overlaps, and the significantly smaller cross-sectionally derived volume outputs did not seem to impact on its ability to generate reliable cBSI measures longitudinally. This indicates that when measuring volume change over time, using a tool such as STEPS that have demonstrated better measures of similarity with manual delineation may be more appropriate, keeping in mind that absolute volumes may be systematically underestimated.
DATA AVAILABILITY STATEMENT
The data analyzed in this study is subject to the following licenses/restrictions: The datasets presented in this article are not readily available in compliance with the participant informed consent. Requests to access these datasets should be directed to r.scahill@ucl.ac.uk.
ETHICS STATEMENT
The studies involving human participants were reviewed and approved by the Central London Research Ethics Committee 4–Reference number 11/H)715/2. The patients/participants provided their written informed consent to participate in this study.
AUTHOR CONTRIBUTIONS
NM contributed to study design, data collection, analyzed the data, and wrote the manuscript. TV contributed to study design, data collection, analysis, and preparation of the manuscript. IM contributed to data analysis and review of the manuscript. NH contributed to data collection, data analysis, and review of the manuscript. ER contributed to data collection and review of the manuscript. ST, AD, RR,
Mansoor et al. Automated Caudate Segmentation in HD
and BL were PIs for the PADDINGTON study, with overall responsibility for all participants, and reviewed the manuscript. EJ contributed to study design, data collection, and preparation of the manuscript. RS developed the study, contributed to data collection, and preparation of the manuscript. All authors contributed to the article and approved the submitted version.
FUNDING
This work was supported by the European Union— PADDINGTON project, contract no. HEALTH-F2-2010-261358. This work was undertaken at UCLH/UCL which received a proportion of funding from the Department of Health’s NIHR Biomedical Research Centers funding scheme. ST is the holder of a Wellcome Trust Collaborative Award (200181/Z/15/Z) and RS and EJ are funded by this award.
IM was supported by Alzheimer’s Research UK (ARUK-PG2014-1946, ARUK-PG2017-1946) and Wolfson Foundation (PR/ylr/18575). The Dementia Research Center was supported by Alzheimer’s Research UK, Brain Research Trust, and The Wolfson Foundation.
ACKNOWLEDGMENTS
The authors would like to thank the patients and controls who took part in this study, along with all the Work Package 2 site staff at Paris, Leiden, Ulm and London.
SUPPLEMENTARY MATERIAL
The Supplementary Material for this article can be found online at: https://www.frontiersin.org/articles/10.3389/fneur. 2021.616272/full#supplementary-material
REFERENCES
1. Huntington’s Disease Collaborative Research Group. A novel gene containing a trinucleotide repeat that is expanded and unstable on Huntington’s disease chromosomes. The Huntington’s Disease Collaborative Research Group. Cell. (1993) 72:971–83. doi: 10.1016/0092-8674(93)90585-E
2. Bates GP, Dorsey R, Gusella JF, Hayden MR, Kay C, Leavitt BR, et al. Huntington disease. Nat Rev Dis Primers. (2015) 1:1–21. doi: 10.1038/nrdp.2015.5
3. Vonsattel JP, Myers RH, Stevens TJ, Ferrante RJ, Bird ED, Richardson EP Jr. Neuropathological classification of Huntington’s disease. J Neuropathol Exp Neurol. (1985) 44:559–77. doi: 10.1097/00005072-198511000-00003
4. Wild EJ, Tabrizi SJ. Therapies targeting DNA and RNA
in Huntington’s disease. Lancet Neurol. (2017) 16:837–47.
doi: 10.1016/S1474-4422(17)30280-6
5. Yang S, Chang R, Yang H, Zhao T, Hong Y, Kong HE, et al. CRISPR/Cas9-mediated gene editing ameliorates neurotoxicity in mouse model of Huntington’s disease. J Clin Investigation. (2017) 127:2719–24. doi: 10.1172/JCI92087
6. McColgan P, Tabrizi SJ. Huntington’s disease: a clinical review. Eur J Neurol. (2018) 25:24–34. doi: 10.1111/ene.13413
7. Rodrigues FB, Wild EJ. Huntington’s disease clinical trials corner: february 2018. J Huntington’s Dis. (2018) 7:89–98. doi: 10.3233/JHD-189001 8. Tabrizi S, Leavitt B, Kordasiewicz H, Czech C, Swayze E, Norris DA,
et al. Effects of IONIS-HTTRx in Patients with Early Huntington’s Disease, Results of the First HTT-Lowering Drug Trial (CNeurology T002), 90(15 Supplement) (2018). Available online at: http://n.neurology.org/content/90/ 15_Supplement/CT.002.abstract (accessed February 6, 2021).
9. Paulsen JS, Langbehn DR, Stout JC, Aylward E, Ross CA, Nance M, et al. Detection of Huntington’s disease decades before diagnosis: the Predict-HD study. J Neurol Neurosurg Psychiatry. (2008) 79:874–80. doi: 10.1136/jnnp.2007.128728
10. Tabrizi SJ, Langbehn DR, Leavitt BR, Roos RA, Durr A, Craufurd D, et al. Biological and clinical manifestations of Huntington’s disease in the longitudinal TRACK-HD study: cross-sectional analysis of baseline data. Lancet Neurol. (2009) 8:791–801. doi: 10.1016/S1474-4422(09)70170-X 11. Tabrizi SJ, Scahill RI, Durr A, Roos RA, Leavitt BR, Jones R, et al. Biological
and clinical changes in premanifest and early stage Huntington’s disease in the TRACK-HD study: the 12-month longitudinal analysis. Lancet Neurol. (2011) 10:31–42. doi: 10.1016/S1474-4422(10)70276-3
12. Aylward EH, Nopoulos PC, Ross CA, Langbehn DR, Pierson RK, Mills JA, et al. Longitudinal change in regional brain volumes in prodromal Huntington disease. J Neurol Neurosurg Psychiatry. (2011) 82:405–10. doi: 10.1136/jnnp.2010.208264
13. Bohanna I, Georigiou-Karistianis N, Hannan AJ, Egan GF. Magnetic resonance imaging as an approach towards identifying neuropathological biomarkers for Huntington’s disease. Brain Res Rev. (2008) 58:209–25. doi: 10.1016/j.brainresrev.2008.04.001
14. Rees EM, Scahill RI, Hobbs NZ. Longitudinal neuroimaging
biomarkers in huntington’s disease. J Huntington’s Dis. (2013) 2:21–39. doi: 10.3233/JHD-120030
15. Andre R, Scahill RI, Haider S, Tabrizi SJ. Biomarker development for Huntington ’ s disease. Drug Discovery Today. (2014) 19:972–9. doi: 10.1016/j.drudis.2014.03.002
16. Scahill RI, Andre R, Tabrizi SJ, Aylward EH. Structural imaging in pre manifest and manifest Huntington disease. In: Feigin AS, Anderson KE, editors. Handbook of Clinical Neurology. 1st Edn. Elsevier B.V (2017). doi: 10.1016/B978-0-12-801893-4.00020-1
17. Bogaard SJA, Van, D.en, Dumas EM, Ferrarini L, Milles J, et al. Shape analysis of subcortical nuclei in Huntington ’ s disease, global versus local atrophy — Results from the TRACK-HD study. J Neurol Sci. (2011) 307:60–8. doi: 10.1016/j.jns.2011.05.015
18. Georgiou-Karistianis N, Gray MA, Dominguez JFD, Dymowski AR, Bohanna I, Johnston LA, et al. Automated differentiation of pre-diagnosis Huntington’s disease from healthy control individuals based on quadratic discriminant analysis of the basal ganglia: the IMAGE-HD study. Neurobiol Dis. (2013) 51:82–92. doi: 10.1016/j.nbd.2012.10.001
19. Tabrizi SJ, Scahill RI, Owen G, Durr A, Leavitt BR, Roos RA, et al. Predictors of phenotypic progression and disease onset in premanifest and early-stage Huntington ’ s disease in the TRACK-HD study : analysis of 36-month observational data. Lancet Neurol. (2013) 12:637–49. doi: 10.1016/S1474-4422(13)70088-7
20. Dominguez JFD, Egan GF, Gray MA, Poundel GR, Churchyard A, Chua P, et al. Multi-modal neuroimaging in premanifest and early Huntington’s disease: 18 month longitudinal data from the IMAGE-HD study. PLoS ONE. (2013) 8:e74131. doi: 10.1371/journal.pone.00 74131
21. Harrington DL, Long JD, Durgerian S, Mourany L, Koenig K, Bonner-Jackson A, et al. Cross-sectional and longitudinal multimodal structural imaging in prodromal Huntington’s disease. Movement Disorders. (2016) 31:1664–75. doi: 10.1002/mds.26803
22. Douaud G, Gaura V, Riberio MJ, Lethimonnier F, Maroy R, Verny C, et al. Distribution of grey matter atrophy in Huntington’s disease
patients: a combined ROI-based and voxel-based morphometric
study. NeuroImage. (2006) 32:1562–75. doi: 10.1016/j.neuroimage.2006. 05.057
23. Khan AR, Wang L, Beg MF. FreeSurfer-initiated fully-automated subcortical brain segmentation in MRI using Large Deformation
Diffeomorphic Metric Mapping. NeuroImage. (2008) 41:735–46. doi: 10.1016/j.neuroimage.2008.03.024
24. Kassubek J, Pinkhardt EH, Dietmaier A, Ludolph AC, Landwehrmeyer GB, Huppertz HJ. Fully automated atlas-based MR imaging volumetry in Huntington disease, compared with manual volumetry. AJNR. (2011) 32:1328–32. doi: 10.3174/ajnr.A2514
25. Thieben MJ, Duggins AJ, Good CD, Gomes L, Mahant N, Richards F, et al. The distribution of structural neuropathology in pre-clinical Huntington’s disease. Brain. (2002) 125:1815–28. doi: 10.1093/brain/awf179
26. Freeborough PA, Fox NC. The boundary shift integral: an accurate and robust measure of cerebral volume changes from registered repeat MRI. IEEE Transactions Med Imag. (1997) 16:623–9. doi: 10.1109/42.640753
27. Hobbs NZ, Henley SM, Wild EJ, Leung KK, Frost C, Barker RA, et al. Automated quantification of caudate atrophy by local registration of serial MRI: evaluation and application in Huntington’s disease. NeuroImage. (2009) 47:1659–65. doi: 10.1016/j.neuroimage.2009.06.003
28. Hobbs NZ, Cole JH, Farmer RE, Rees EM, Crawford HE, Malone IB, et al. Evaluation of multi-modal, multi-site neuroimaging measures in Huntington’s disease: baseline results from the PADDINGTON study. NeuroImage. (2013) 2:204–11. doi: 10.1016/j.nicl.2012.12.001
29. Penney JB Jr, Vonsattel JP, MacDonald ME, Gusella JF, Myers RH. CAG repeat number governs the development rate of pathology in Huntington’s disease. Annals Neurol. (1997) 41:689–92. doi: 10.1002/ana.410410521
30. Patenaude B, Smith SM, Kennedy DN, Jenkinson M. A Bayesian model of shape and appearance for subcortical brain segmentation. NeuroImage. (2011) 56:907–22. doi: 10.1016/j.neuroimage.2011.02.046
31. Fischl B, Salat DH, Busa E, Albert M, Dieterich M, Haselgrove C, et al. Whole brain segmentation: automated labeling of neuroanatomical structures in the human brain. Neuron. (2002) 33:341–55. doi: 10.1016/s0896-6273(02)00569-x 32. Warfield SK, Zou KH, Wells WM. Simultaneous truth and performance level estimation (STAPLE): an algorithm for the validation of image
segmentation. IEEE Transactions Med Imag. (2004) 23:903–21.
doi: 10.1109/TMI.2004.828354
33. Ledig C, Heckemann RA, Hammers A, Lopez JC, Newcombe VFJ, Makropoulos A, et al. Robust whole-brain segmentation: application
to traumatic brain injury. Med Image Anal. (2015) 21:40–58.
doi: 10.1016/j.media.2014.12.003
34. Zaki R, Bulgiba A, Ismail R, Ismail NA. Statistical methods used to test for agreement of medical instruments measuring continuous variables in
method comparison studies: a systematic review. PLoS ONE. (2012) 7:e37908. doi: 10.1371/journal.pone.0037908
35. Jaccard P. The distribution of the flora in the alpine zone 1. N Phytol. (1907) 11:37–50. doi: 10.1111/j.1469-8137.1912.tb05611.x
36. Johnson EB, Gregory S, Johnson HJ, Durr A, Leavitt BR, Roos RA, et al. Recommendations for the use of automated gray matter segmentation tools: evidence from Huntington’s disease. Front Neurol. (2017) 8:519. doi: 10.3389/fneur.2017.00519
37. Iscan Z, Jin TB, Kendrick A, Szeglin B, Lu H, Trivedi M, et al. Test– retest reliability of freesurfer measurements within and between sites: effects of visual approval process. Hum Brain Mapp. (2016) 36:3472–85. doi: 10.1002/hbm.22856
38. Tabrizi SJ, Reilmann R, Roos RA, Durr A, Leavitt B, Owen G, et al. Potential endpoints for clinical trials in premanifest and early Huntington ’ s disease in the TRACK-HD study : analysis of 24 month observational data. Lancet Neurol. (2012) 11:42–53. doi: 10.1016/S1474-4422(11)70263-0
39. Kosman E, Leonard KJ. Similarity coefficients for molecular markers in studies of genetic relationships between individuals for haploid, diploid, polyploid species. Mol Ecol. (2005) 14:415–24. doi: 10.1111/j.1365-294X.2005.02416.x 40. Hobbs NZ, Barnes J, Frost C, Henley SM, Wild EJ, Macdonald K, et al.
Onset and progression of pathologic atrophy in Huntington disease: a longitudinal MR imaging study. Am J Neuroradiol. (2010) 31:1036–41. doi: 10.3174/ajnr.A2018
Conflict of Interest:ER was employed by UCL during the period of data collection and image processing. She now works for IXICO plc.
The remaining authors declare that the research was conducted in the absence of any commercial or financial relationships that could be construed as a potential conflict of interest.
Copyright © 2021 Mansoor, Vanniyasingam, Malone, Hobbs, Rees, Durr, Roos, Landwehrmeyer, Tabrizi, Johnson and Scahill. This is an open-access article distributed under the terms of the Creative Commons Attribution License (CC BY). The use, distribution or reproduction in other forums is permitted, provided the original author(s) and the copyright owner(s) are credited and that the original publication in this journal is cited, in accordance with accepted academic practice. No use, distribution or reproduction is permitted which does not comply with these terms.