HAL Id: hal-00008314
https://hal.archives-ouvertes.fr/hal-00008314
Preprint submitted on 31 Aug 2005
HAL is a multi-disciplinary open access
archive for the deposit and dissemination of
sci-entific research documents, whether they are
pub-lished or not. The documents may come from
teaching and research institutions in France or
abroad, or from public or private research centers.
L’archive ouverte pluridisciplinaire HAL, est
destinée au dépôt et à la diffusion de documents
scientifiques de niveau recherche, publiés ou non,
émanant des établissements d’enseignement et de
recherche français ou étrangers, des laboratoires
publics ou privés.
Eric Lagadec, Olivier Chesneau, Mikako Matsuura, Orsola de Marco, Jose
Antonio de Freitas Pacheco, Albert Zijlstra, Agnès Acker, Geoffrey Clayton
To cite this version:
Eric Lagadec, Olivier Chesneau, Mikako Matsuura, Orsola de Marco, Jose Antonio de Freitas Pacheco,
et al.. New insights on the complex planetary nebula Hen 2-113. 2005. �hal-00008314�
ccsd-00008314, version 1 - 31 Aug 2005
(DOI: will be inserted by hand later)
New insights on the complex planetary nebula Hen 2-113
⋆
E. Lagadec
1, O. Chesneau
2, M. Matsuura
3, O. De Marco
4, J.A. de Freitas Pacheco
1, A.A. Zijlstra
3, A.
Acker
5, G.C. Clayton
61 Observatoire de la Cˆote d’Azur-CNRS-UMR 6202, Dept. Cassiop´ee, BP 4229, F-06304 Nice, France
2 Observatoire de la Cˆote d’Azur-CNRS-UMR 6203, Dept. Gemini, Avenue Copernic, F-06130 Grasse, France 3 Department of Physics and Astronomy, University of Manchester, Sackville Street, P.O. Box 88, Manchester
M60 1QD, UK
4 American Museum of Natural History, Dept. of Astrophysics, Central Park West at 79th Street, New York NY
10024, USA
5 Observatoire de Strasbourg, 11 rue de l’Universit´e, 67000 Strasbourg, France
6 Department of Physics and Astronomy, Louisiana State University, Baton Rouge, LA 70803, USA
Received; accepted
Abstract. We report infrared observations of the planetary nebula Hen 2-113 obtained with VLT/NACO, VLTI/MIDI, VLT/ISAAC and TIMMI at the ESO 3.6m. Hen 2-113 exhibits a clear ring-like structure superim-posed to a more diffuse environment visible in the L’ (3.8µm), M’ (4.78µm) and 8.7µm bands. No clear core at 8.7µm and no fringes through the N band could be detected for this object with MIDI. A qualitative interpreta-tion of the object structure is proposed using a diabolo-like geometrical model. The PAH content of the nebula was also studied with ISAAC and TIMMI observations. This indicates that the PAHs are mostly concentrated towards the lobes of the diabolo and the bipolar lobes of the nebula. In L’ band, a void 0.3′′ in diameter was
discovered with NACO around the central source. The L’ and M’ fluxes from the central source were derived from NACO data indicating an important infrared excess with respect to the expected stellar emission based on stellar models and short wavelength data. The observed flux from this source in the L’ and M’ is about 300 and 800 times respectively than those expected from a model including only the central star. Moreover, the central object appears resolved in L’ band with measured FWHM about 155 mas. This infrared excess can be explained by emission from a cocoon of hot dust (T∼1000K) with a total mass ∼ 10−9M
⊙.
Key words.Techniques: interferometric; Techniques: high angular resolution; Stars: AGB and post-AGB ;individ-ual: Hen 2-113; Stars: circumstellar matter; Stars: mass-loss; Stars:imaging; Infrared: stars;
1. Introduction
One of the most debated questions regarding the post-AGB evolution of low and intermediate mass stars is the departure from spherical symmetry observed in circum-stellar envelopes of Pre-Planetary Nebulae (PPNe) and Planetary nebulae (PNe). Indeed, whereas AGB stars have envelopes roughly spherical, many PNe exhibit axisym-metric structures or even more complex morphologies.
Many theoretical models have been proposed to ex-plain shapes of PPNe and PNe (see a recent review by Balick & Frank 2002). Most PNe and PPNe shaping theo-ries rely on the velocity field of circumstellar material dis-tributed either in an expanding toroidal structure or in an accretion disk. The formation of such structures requires
Send offprint requests to: E.Lagadec,email:[email protected]
⋆ Based on observations made with the Very Large Telescope
Interferometer at Paranal Observatory under programs 073.D-0130, 074.D-0139
the presence of a binary companion, rotation and/or mag-netic fields. In past years, various observations have been conducted aiming to detect features associated with mech-anisms responsible for the shaping of PNe. De Marco et al. (2004), as well as Sorensen & Pollacco (2004), showed that a significant binary population may be present among the central stars of PNe. Detection of magnetic fields around AGB stars and central stars PNe has also been mentioned recently by different teams (Miranda et al. 2001, Etoka & Diamond 2004, Bains et al. 2004, Jordan et al. 2005), but the field strengths are not enough to dominate the flow dynamics. Since the most extreme bipolar morphologies appear to be related to circumstellar disks (Balick 1987), the detection and study of disks close to central stars is a very active field of research. Presently, this field benefits particularly from high spatial resolution techniques like adaptive optics on 8m class telescopes (see, for instance, Biller et al. 2005) and recently, from the advent of in-terferometry in the mid-infrared (MIR) wavelength range
(Leinert et al. 2004). These new facilities give a comple-mentary view of circumstellar disks discovered by the HST (Sahai & Nymann 2000, De Marco et al. 2002, Meakin et al. 2003). A good example of such an approach is the study of the disk in NGC 6302 by Matsuura et al. (2005), using HST and VLT observations.
In this sense, the compact and young PNe Hen 2-113 (Hen 3-1044, PK 321+03.1, IRAS 14562-5406) is a good example of an object with a complex morphology which, in spite of its kinematical properties, is typical of a type IIb planetary nebula (Costa & de Freitas Pacheco 1996), this type of PNe being mostly circular in shape (Phillips 2005). The central star (CS) has a Wolf-Rayet type spectra and was classified as a [WC10] by Crowther, De Marco & Barlow (1998). CS exhibiting WR spectra represent about 10-15% of all CS (G´orny & Tylenda, 2000).
The ISO spectra of Hen 2-113 show simultaneously the presence of C-rich and O-rich dust grains (Waters et al. 1998). The dual dust chemistry phenomenon in PNe appears to be correlated with the presence of cool [WC] type CS (Zijlstra et al., 1991; De Marco & Soker 2002).
De Freitas Pacheco et al. (1993) carried out a spectral analysis of the wind of Hen 2-113, concluding that the carbon-to-helium ratio is C/He = 0.5, value similar to the value of 0.55 found in an independent way by De Marco & Crowther (1998). They also derived a mass-loss rate of 3.8 × 10⁻⁶M
⊙yr−1 for an estimated terminal velocity of
1000 km s−1. If the terminal velocity is revised downward
(V∞ ∼ 250 km s−1), the resulting mass-loss rate would
be decreased by a factor of 8, since ˙M ∝ V∞3/2. This
re-vised value is consistent with the estimate by Leuenhagen, Hamann & Jeffery (1996) of 3.4×10⁻⁷M
⊙yr−1and smaller
than the estimation of 3.9 × 10⁻⁶M
⊙yr−1by De Marco &
Crowther (1998).
From high resolution Coud´e spectra, de Freitas Pacheco et al. (1993) decomposed the main interstellar components of the NaI doublet and, using a rotation model for the Galaxy, they have derived a distance of 3.1 kpc for Hen 2-113. A similar value (3.5 kpc) was obtained by Leuenhagen, Hamann & Jeffery (1996), but a lower distance (1.2 kpc) was derived by De Marco & Crowther (1998). The effective temperature of the CS was estimated to be 29000 K by De Marco & Crowther (1998), who mod-eled the star atmosphere. From the the H-Zanstra and the Stoy methods, de Freitas Pacheco et al. (1993) derived a lower effective temperature, namely, Tef f = 22300 K,
consistent with the absence of HeII lines in the wind and the low excitation nebular spectrum (de Freitas Pacheco, Maciel & Costa 1992; De Marco, Barlow & Storey 1997). Despite the careful study of the fundamental parame-ters of the CSs and nebulae of Hen 2-113 and CPD-568032 by De Marco et al. (1997, 1998) and De Marco & Crowther (1998), the morphology of the nebula of Hen 2-113 was poorly known until the HST observations by Sahai et al. (2000) (hereafter SNW00). These authors showed that Hen 2-113 exhibits a complex geometry, roughly bipo-lar with two bright, knotty, compact ringlike structures
around the central star. This compact structure is embed-ded in a larger and fainter spherically symmetric structure and SNW00 were puzzled to notice that the central star of Hen 2-113 was conspicuously offset from the geomet-rical centers of the rings and from the circular contours attributed to the formal AGB wind.
In the present work we report new observations on Hen 2-113 performed with different infrared imaging in-struments (ISAAC and TIMMI) and high spatial resolu-tion techniques, namely adaptive optics with NACO/VLT. The infrared domain offers a unique opportunity to ob-serve with great detail the bulk of the dust emission in the very central region of the object. In particular, we at-tempted to detect and study small scale structures in the MIR with the long baseline interferometer MIDI/VLTI. The object was over-resolved with 46m baselines and no interferometric data could be recorded, but the acquisi-tion images are used in our study. The remainder of this paper is organized as follows: in Sect.2 the infrared obser-vations are presented, in Sect.3 we perform a comparative analysis between the infrared and optical HST images, in Sect.4 a possible geometry for Hen 2-113 is discussed and, finally, in Sect.5 the conclusions are given.
2. Observations
2.1. NACO high resolution imaging
We have observed Hen 2-113 with the adaptive optics cam-era NACO attached to the fourth 8.2 m Unit Telescope (UT) of the Very Large Telescope (VLT), European Southern Observatory (ESO) Paranal, Chile. NAOS was operated in the visual wavefront sensor configuration with the SBRC Aladdin 1024×1024 detector. We observed the target with L′ (3.8µm) and M′ (4.78µm) broad-band
filters. Using camera mode L27, the field of view was 28′′×28′′and the pixel scale was 27.1 mas per pixel. The
auto-jitter mode was used, that is, at each exposure, the telescope moves according to a random pattern in a 10′′
box. A cross-correlation technique was used to recenter the images at about 0.25 pixel accuracy.
Individual dithered exposures were co-added, result-ing in a total exposure time texp shown in Table 1. The
data reduction was performed using an IDL routine devel-oped by us that processes the L’ and M’ individual frames as follows. First, for L’ images, bad pixels are removed. Then, the sky is computed as the mean of the dithered exposures, and subtracted frame by frame. Finally, all the sky-subtracted frames are shifted and added together. The reduced broad-band images are shown in Fig. 1. For the M’ chopped images, we subtracted the sky. The spatial resolution of our L’ image has been improved by a decon-volution with the Lucy-Richardson algorithm to reach ∼ 60 mas (Fig. 2).
The star HD 130572 (A0V) was used to derive the point spread function (PSF) and as photometric standard. Its J, H and K magnitudes, from the 2MASS catalogue, are ,respectively, 6.39±0.02, 6.41±0.02, 6.37±0.02 and its
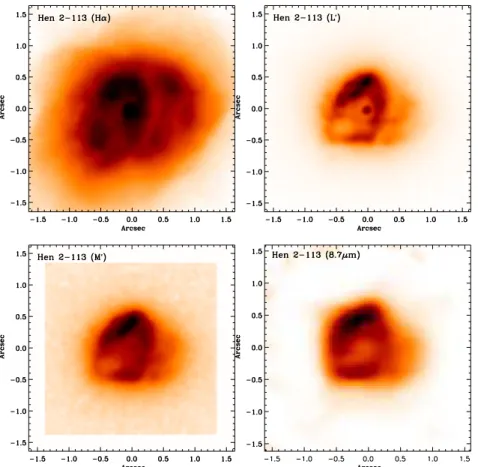
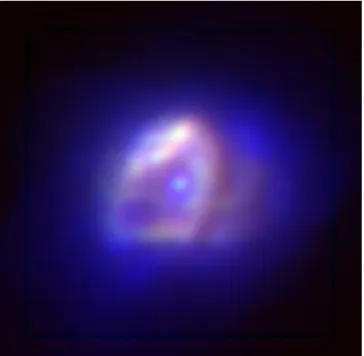
Fig. 1. Comparison of the HST image in Hα (upper left), the NACO L’(upper right) and M’ (lower left), and the deconvolved MIDI acquisition image at 8.7µm. North is up and east to the left.
Table 1.Journal of observations with NACO/UT4.
Star Filter Camera Time texp Seeing
04/05-05-2004, airmass 1.15-1.3 Hen 2-113i M′ L27 02:34:48 37s 0.74 HD 130572i M′ L27 03:19:34 18s 1.1 13/14-05-2004, airmass 1.15-1.20 Hen 2-113i L′ L27 02:08:30 100s 0.42 29/30-06-2004, airmass 1.15-1.20 Hen 2-113i L′ L27 05:17:54 40s 0.90 04/05-07-2004, airmass 1.15-1.20 Hen 2-113i L′ L27 23:46:22 40s 0.93 Hen 2-113 L′ L27 23:59:41 40s 0.76 HD 130572i L′ L27 00:21:31 200s 0.66 i with neutral density filter
FWHM is 114±4 mas and 147±6 mas in the L’ and M’ bands, respectively. The magnitude in the L’ and M’ bands was assumed to be 6.39.
We estimated the magnitude of the full nebula to be mL′=4.1±0.2 and mM′=3.2±0.31in the L’ and M’ bands
1 The quality of the M’ images is quite limited in terms of
noise and dynamic range leading to the large error bar for the integrated flux of the full nebula.
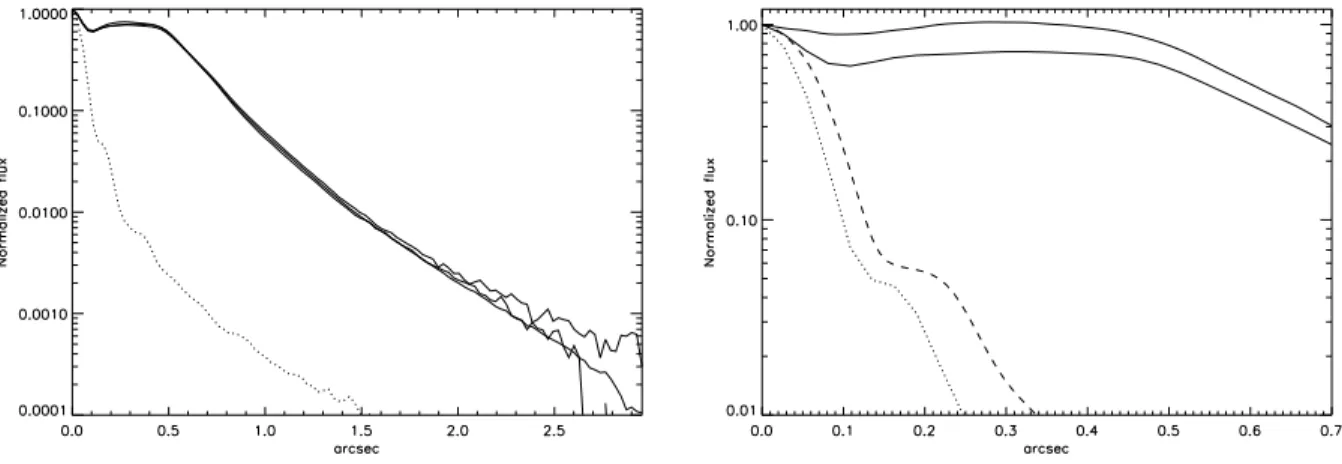
respectively. Then, we performed photometry of the cen-tral source using a method described in Chesneau et al. (2005), based on PSF subtraction techniques. The L’ and M’ radial means of the PSF and the source were com-puted, and the L’ curves are shown in Fig. 3. The radial mean of the PSF was then scaled to the central object to evaluate its photometry, independently of the neighbor-ing nebula, based on the assumption that this object is indeed unresolved. The L’ and M’ magnitudes of the cen-tral source of Hen 2-113 were estimated as m′
L′=8.4±0.1
mag and m′
M′= 8.3±0.2 mag, respectively. Interestingly,
it appeared that the central source could not be consid-ered as unresolved and could be fitted with an Airy curve having a FWHM of 155±16 mas, i.e. close to the M’ band spatial resolution. We stress that this result is based on the comparison of the radial curves from the four data sets recorded in L’ band. The curves agree within about 4% and 2% at 0.27 and 0.54 arcsecond respectively and span a seeing range from 0.42 to 0.93 arcsec. In the M’ band, the central object is also extended and embedded in a diffuse environment (Fig. 3).
2.2. MIDI acquisition image
The VLTI/MIDI interferometer (Leinert et al. 2003 and 2004) operates like a classical Michelson interferometer to combine the MIR light (N band, 7.5 - 13.5 µm) from two
Fig. 3.Left: Radial flux normalized to the peak (filter L’) for the three different observations of Hen 2-113 (solid line), and the PSF HD 130572 (dotted line). Right: closer view of the L’ (dotted) and M’ (dashed) PSF curves compared to Hen 2-113 L’ (lower) and M’ (upper).
Fig. 2. NACO/VLT L’ deconvolved image of Hen 2-113, log scaled in order to enhance the contrast. Dynamic range is ∼ 104 and resolution ∼ 60mas. In the North/west, low
level artefacts of deconvolution are visible. North is up and east to the left.
VLT UTs. Observations of Hen 2-113 and CPD -568032 have been performed in 2004, April 08. The observations of CPD -568032 will be presented in a forthcoming paper (Chesneau et al 2005 (in preparation)). The log of the ob-servations is presented in Table 2. For these obob-servations, the UT2 and the UT3 telescopes were used with a
sepa-ration of 46.6 m and with the baseline oriented 40◦(E of
N). This baseline provides a resolving power of the order of 40 mas and was adopted in order to detect compact dusty structures around the central star.
The observing sequence, typical of interferometric measurements is described in Leinert et al. (2003, 2004) and Przygodda et al. (2003). It must be stressed that the MIDI instrument detected no fringes as the tar-get appeared resolved for a single dish 8 m telescope. Nevertheless, the acquisition images from this instrument were scientifically interesting and their reduction is de-scribed in the next Section.
The chopping mode (f = 2 Hz, angle = -90◦) was used
to visualize and to accurately point at the star, which is usually not perfectly centered in a first acquisition image, and is centered in a second step. Such a pointing accuracy is needed to get good quality interference pattern. The number of frames recorded for each image was generally 2000, and the exposure time per frame is by default 4 ms to avoid fast background saturation. If the pointing is not satisfactory, the procedure is started again. The default filter is centered at 8.7µm (1.6µm wide). This filter has been used for the three acquisitions of the science targets and the calibrators. For overhead considerations, no nod-ding sequences were recorded.
It immediately appeared that Hen 2-113 was fully re-solved with the 250 mas resolving power of a single-dish 8 m telescope. A few attempts to detect fringes on some emerging structures were conducted without success.
Custom software written in the IDL language was de-veloped in order to reduce MIDI observations, including images and spectra extraction.
The first step of the reduction is to read in the acqui-sition datasets, average the frames on the target and the frames on the sky, and subtract the averaged sky-frame from the averaged target-frame. Despite the high number of optical elements in the VLTI/MIDI system (33 in to-tal), the quality of the 8.7 µm images is comparable to
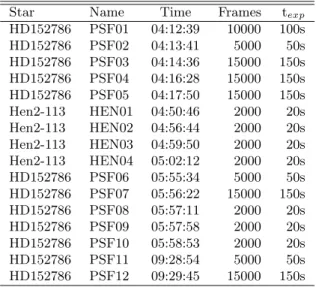
Table 2. Journal of observations with MIDI/UT2-UT3: acquisition images
Star Name Time Frames texp
HD152786 PSF01 04:12:39 10000 100s HD152786 PSF02 04:13:41 5000 50s HD152786 PSF03 04:14:36 15000 150s HD152786 PSF04 04:16:28 15000 150s HD152786 PSF05 04:17:50 15000 150s Hen2-113 HEN01 04:50:46 2000 20s Hen2-113 HEN02 04:56:44 2000 20s Hen2-113 HEN03 04:59:50 2000 20s Hen2-113 HEN04 05:02:12 2000 20s HD152786 PSF06 05:55:34 5000 50s HD152786 PSF07 05:56:22 15000 150s HD152786 PSF08 05:57:11 2000 20s HD152786 PSF09 05:57:58 2000 20s HD152786 PSF10 05:58:53 2000 20s HD152786 PSF11 09:28:54 5000 50s HD152786 PSF12 09:29:45 15000 150s
the best MIR images published to date, i.e. Eta Carinae (Chesneau et al. 2005). The angle subtended by a pixel on the sky is approximatively 98 mas and the North direction rotates during the observation.
Since MIDI is a long baseline interferometer, most of the targets are usually unresolved by a single 8 m telescope providing a wealth of instrumental PSF acquisitions.
The airmass of the targets ranges between 1.2 and 1.8, the optical seeing was oscillating between 0.′′65 and 0.′′85.
The spatial resolution has been slightly increased by performing a deconvolution using 30 iterations of the Lucy-Richardson algorithm and the result is shown in Fig. 1. The spatial resolution reached after the treatment is about 150 mas. The levels where the different decon-volved images begin to disagree are between 1% of the maximum flux of the image, depending on the quality of the recorded images. Due to different optical properties of the beam between UT2 and UT3, only UT3 best images were used.
2.3. ISAAC imaging
Near-infrared images of Hen 2-113 were taken with the Infrared Spectrometer And Array Camera (ISAAC) at the VLT. The data were acquired over two nights in 2004, August 05 and 06 with UT1. The observations are sum-marized in Table 3. Calibration data were obtained with short exposures of Hen 2-113 and the photometric stan-dard star HIP76074. The images shown in this paper were obtained on the 5th of August, and total fluxes were scaled to be consistent with those of the 6th of August data. The background was subtracted by chopping and nodding to a position 20′′ to the north/west, while keeping the source
on the array. Jittering was used to improve flat-fielding and to minimise the influence of the pixel-to-pixel vari-ation. The pixel scale is 0.071 ′′. The resolution in the
infrared is in general better than in optical by about 25%
Fig. 4.HST F656 image and ISAAC 3.3µm PAH contour after continuum subtraction (NB−3.28−NB−3.21). North
is up and east to the left.
Table 3.Filters and image quality and fluxes. The central wavelengths (λ0) and the widths of the filters are listed
for ISAAC. Texp is the exposure time. Infrared seeings are
measured FWHM of the nearby star (2MASS 14595478-5417453, USNO 0300-22661298).
Band λ0 ∆λ Texp Infrared seeing
[µm] [µm] [min] [arcsec] NB−3.21 3.21 0.05 12 0.40
NB−3.28 3.28 0.05 20 0.40
(Matsuura et al. 2004). We used Eclipse 4.1.2 for the data-reduction. A detector’s non-linearity correction is adopted as suggested by ISAAC instrument team.
Three nearby stars were used to calibrate the astrometry by comparing to their 2MASS positions
(2MASS 14595265−5417418, 14595364−5417517,
14595436−5418162). The positions are consistent
within 0.6 arcsec. The zero-point of the figures is RA= 14.h59.m53.s4, Dec=−54.◦18.′7.s0 (J2000)
For comparison with an optical image, we used Hα data obtained by Sahai et al. (2000) (Fig. 4). Distortion was corrected by the procedure of Anderson & King (2003), and astrometry was performed using coordinates of two nearby stars (14595364−5417517, 14595436−5418162). Even after the shift of HST and ISAAC images, there is an error of two ISAAC pixels found in the north/south direction. For image presenta-tion, we used pipeline reduced data, and shifted the image according to the location of the central star. Image distor-tion is negligible within the central region of Hen 2-113.
Table 4.Journal of observations with TIMMI/3.6m.
Object Filter λ0 Filter width Texp(s)
(µm) (µm) Hen 2-113 N2 9.78 9.14-10.43 124.32 Hen 2-113 N3 12.55 11.80-13.30 62.16 Hen 2-113 SiC 11.65 10.30-13.00 62.16 HR 4763 N2 9.78 9.14-10.43 101.92 HR 4174 N3 12.55 11.80-13.30 62.16 HR 4174 SiC 11.65 10.30-13.00 62.16
2.4. TIMMI imaging
Observations were performed in 1995, February 05 and 07 at the ESO 3.6-m telescope in La Silla (Chile), using the mid-infrared TIMMI camera (Lagage et al. 1993) with a detector consisting of a 64 × 64 pixel Ga:Si array. The resulting spatial scale of the system is 0.336′′/pix. The
log of the observations is given in Table 4. These obser-vations were made in a standard MIR observing mode, by chopping the secondary mirror and nodding the pri-mary to subtract the background emission from the sky and telescope. The chopper throw was 18.3′′ toward the
south and the nod beam position used was 18.3′′ north
of the first position. To avoid the saturation of the de-tector by the ambient photon background and to have a good image quality, each individual nod cycle was split into many short exposures of ∼ 10 ms. This procedure was repeated for as many cycles as needed to obtain the re-quired total integration time. Nearly diffraction-limited images (∼ 0.7′′ FWHM for point sources) resulted from
these short exposures. Filter wavelengths were selected in order to obtain information on the dust continuum as well as on spectral features like PAHs, while maximizing the detection sensitivity. The observations were carried out in four narrow-band filters, centered respectively at 9.78 (N2), 11.65 (SiC) and 12.55 µm (N3) whose charac-teristics are given in Table 4.
The data reduction was performed using IDL self-developed routines (Lagadec et al. 2005). Individually-chopped frames were spatially oversampled by a factor of 4 and shifted to the nearest 0.25 pixel by using a cross-correlation algorithm to correct for turbulent mo-tions and flexure drifts. Images were then co-added to produce a single flat-field-corrected image, comprising the average of the chop and nod differences, for each filter. Reference stars were observed, analyzed in the same way and were used to derive the instrumental PSF at each filter. Images were deconvolved by using the Richardson-Lucy algorithm.
2.5. HST imaging
In order to compare our infrared images with optical im-ages, a total of six Hα exposures of Hen 2-113 (F656N (λ= 656.2 nm, λ = 2.2 nm), taken as part of an HST SNAPshot imaging program (GO program 8345, Sahai et
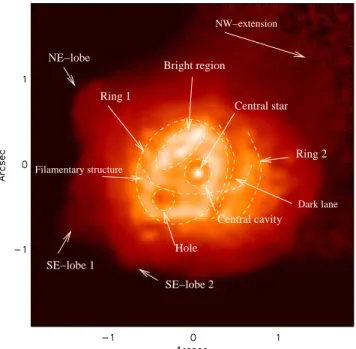
NW−extension Ring 1 Ring 2 SE−lobe 2 Hole Central cavity Central star Dark lane Filamentary structure Bright region NE−lobe SE−lobe 1
Fig. 5.Schematic view of Hen 2-113 overlaid on the Naco L’ image. North is up and east to the left.
al.), were retrieved from HST archives and processed via the standard calibration pipeline. The nebula lies entirely within the field of the Planetary Camera (800 × 800 pix-els; pixscale = 0.0456′′pixel−1) of WFPC2. The image has
then been rotated in order for comparison to the other in-struments.
These images (Fig. 1) have been extensively described in SNW00 and will be used in the following section for comparison with our observations.
3. Optical versus infrared morphology.
The optical nebula exhibits a bipolar shape (PA=136◦).
The diffuse lobes have a radial extent of about 2” and are well defined with sharp edges. Superimposed on this diffuse environment, a brighter region is composed of two elliptical rings. The second ring (ring 2) is fainter and incomplete, but its structure is well-defined and it appears coaxial to the first one (ring 1). The central star of Hen 2-113 is conspicuously offset from the geometrical centers of the rings and is also not located symmetrically between these centers. It is also offset from the midpoint of the line joining the tips of the main NW-SE lobes of the nebula. (See Fig 1a, 1c and 3 in SNW00)
The NACO and MIDI (Fig. 1, 2, 5 and 6) high resolu-tion images show a nebula whose extension is limited to the bright core of HST images. The limits of this core are as reported by De Marco et al. (1997) about 1.4′′x1.1′′.
The star, visible in the L’ and M’ NACO images dis-appears in the N band (MIDI 8.7µm). A bright ring-like
knotty structure which coincides with ring 1 observed by SNW00 is also observed in the L’, M NACO images, and in the MIDI 8.7µm deconvolved image. This ring is roughly elliptical and the central star is offset from the geometri-cal center of the ring of 0.15′′ along P.A∼ 65◦. Its major
axis has an extension of ∼ 1.2′′and a minor-to-major axis
ratio of ∼ 0.6 and the line passing through the center of the ring and perpendicular to its major axis is orientated at a P.A. of ∼ 65◦. Ring 2 is less clearly visible and is
replaced by an elongated region of diffuse emission from L’ images to N band images. These rings are thus smaller in our mid-infrared observation (Fig 1) than the one ob-served with HST. The three color composite image (Fig. 6) indeed shows that the rings observed at mid-infrared wavelenghts lie inside those observed in Hα.
The dark lane (0.2′′ width in L’ and HST images) in
the L’ images which splits the emission between the west-ern border of the bright ring and this elongated diffuse emission is coincident with the HST one (Fig. 6). The lane can be distinguished in the M’ and 8.7µm images but the reduction of the spatial resolution at these wavelengths to-gether with the decrease of optical thickness prevent from a clear identification of this structure. Such a dark lane suggests the presence of a ring of cold dust.
A bright region is observed on the North-East of ring 1 in our NACO L’ and M’ image as in MIDI 8.7µm image. This blob may represent emission from dust in excess in this part of ring 1. It is 2 or 3 times brighter than the other parts of ring 1 in Hα, L’, M’ and MIDI images and
its dimension is roughly 0.7′′×0.2′′.
A small circular region of low emissivity (hole), prob-ably due to a lack of material, is detected at ∼ 0.5′′ to
the South-East of the central star along a P.A.∼ 128◦ in
our two NACO images, and can be distinguish with the HST and MIDI observations. Its diameter is roughly 0.3′′.
It is interesting to notice that this direction nearly coin-cides with the orientation of the bipolar nebula surround-ing the two rsurround-ings as observed by SNW00 (P.A. = 136◦).
Furthermore, our deconvolved NACO L’ image seems to show the presence of material on the North-West, alig-nated with the direction formed by the central star and the hole. Another possible interpretation would be the pres-ence of a fairly dense clump of dust as observed in the PN Roberts 22 (Sahai et al. 1999). Nevertheless in this case we wouldn’t expect to see the bright blob in Hα as seen
in HST image.
More complex structures are seen in the high dynamics L’ NACO deconvolved image (Fig. 2). In particular ring 1, the lane and ring 2 seem to be broken by a thin emissive filamentary structure which can be traced to the eastern rim of ring 1, passing ∼ 0.2′′ south from the star. This
0.1′′ width filamentary structure is roughly perpendicular
to the dark lane.
This image also shows that the bright core (the two rings and the lane) is surrounded by a faint low emission region of 2.3′′
×3′′. The brightest region of ring 1 is one
hundred times brighter than this ”halo”. Three lobes are seen extending from this region. The brightest (NE-lobe)
Fig. 6.Three color composite image of Hen2-113 made by combining HST Hα(blue), NACO L’ (green) and M’(red)
images. North is up and east to the left.
is orientated along a P.A. ∼ 55◦, coincident with the
NE-lobe described by SNW00, supporting the reality of the fine structures observed in our deconvolved NACO image. Another lobe (SE-lobe 1) is observed in the SE direction, oriented along P.A. ∼ 115◦. The counterpart of this lobe
could be the material seen on the north/west. The smallest lobe (SE-lobe 2) is also orientated roughly SE, with a P.A. ∼142◦.
A diminution of dust emission is detected close to the CS (Figs 3, 2, 5), which is placed in a cavity of radius ∼ 0.3′′. Such a cavity is not seen in the Hα images obtained
with the HST, suggesting that ionized gas fills the cavity or is seen in front of it.
4. Interpretation
4.1. The structure of Hen2-113
HST observations (SNW00), show that Hen 2-113 has an overall bipolar shape and two ringlike structures around the CS. SNW00 noticed also that the CS was offset from the geometrical center of the rings. This is confirmed by our NACO and MIDI observations and motivated us to make a simple geometrical model to explain it.
To disentangle projection effects and to understand the real three dimensional structure of an astronomical object is always a difficult task. First, we notice that ring 1 (east-ern ring) is brighter than ring 2 (west(east-ern ring), suggesting that ring 1 is closer than ring 2. A three color composite image (Fig. 6) seems to confirm this hypothesis. Indeed, the superposition of our L’ and M’ images with the HST Hα image indicates that the two rings are the projection
of the torus) pointing toward us. In such a geometry, the brightness difference of the two rings is easily explained by a screening effect from the equatorially enhanced dust density. The “diabolo-like” surface is represented by a rev-olution hyperboloid defined by the equations:
x = a(1 + u2)ncos v y = a(1 + u2)ncos v z = cu with: -π 2 ≤u ≤ π 2 and -π ≤ v ≤ π.
The parameter a fixes the radius of the diabolo, c is the height and n the opening angle. The code, written in IDL, produces an hyperboloid, which can be scaled according to its distance and inclination with respect to the plane of the sky, allowing a direct comparison with the observed images. The fit of the parameters was performed visually, searching for the best superposition between the simulated and the observed images, the HST optical image being the reference, as ring 2 is best seen on HST Hα. The aim of
this model is to reproduce the main morphological features observed for the rings: the major-to-minor axis ratio of ring 1 is ∼ 2, two thirds of ring 2 is observed, the central star is offset with respect to the center of the rings and the projection of the common axis of these rings on the sky-plane is oriented with a P.A. of ∼ 65◦.
Fig 7 shows a representation of our model. A satisfying superposition was obtained with a diabolo having an in-clination i = 37◦and a P.A ∼ 65◦, n = 0.9 and a/c = 3/2.
This geometrical model can explain the offset of the CS from the center of ring 1, but the offset from the center of the nebula (SNW00) is not explained by this geometry. It can be explained by proper motion of the star at ∼ 1 km s−1 with respect to the nebula.
The diabolo-shaped structure is tilted with respect to the bipolar nebula observed by SNW00, oriented along P.A.= 136◦. Notice that the orientation of the diabolo
(P.A.∼ 65◦) is coincident with none of the other features
observed inside the nebula.
SNW00 already noticed that the shaping of this neb-ula could not be explained with the generalized interact-ing stellar wind model (GISW) (Kwok et al. 1978, Balick 1987) as this model cannot explain multipolar morpholo-gies. They proposed that the observed morphology could be explained if fast, collimated outflows change their di-rection with time (Sahai & Trauger 98, hereafter ST98). Our observations strengthen the fact that the observed morphology cannot be explained by the GISW model as the morphology of the nebula is multipolar. The observed tilt also seems to be difficult to explain by the ST98 model. The hole observed in the south/east of the nebula could be a clue to our understanding of this structure. This hole is probably due to a lack of dust in this part of the nebula and it is interesting to notice that the direction formed by the CS and the hole (P.A.∼ 128◦) is nearly coincident with
the orientation of the main bipolar nebula (P.A.∼ 136◦).
This is seen clearly in our three color image (Fig. 6). Since the nebula around Hen 2-113 is relatively young, it is only partially ionized, as the ionization front is still propagating inside the shell. The total measured Hβ flux
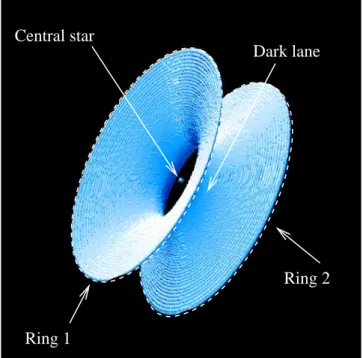
Ring 1
Ring 2
Central star
Dark lane
Fig. 7. Diabolo model with the adopted inclination pa-rameters
(Acker et al. 1992) corrected by an extinction E(B-V) = 1.0 (De Marco, Barlow & Storey 1997) is F (Hβ) = 4.08 × 10⁻¹¹erg.cm−2.s−1. In this case, the ionized mass is given
by Mion= 4πD3 F (Hβ)mp j(Hβ) < ne> = 31D 2 kpc < ne> M⊙ (1)
where D is the distance, j(Hβ) is the line emissivity coeffi-cient, mpis the proton mass and < ne>= 105cm−3is the
mean electron density in the nebula (de Freitas Pacheco et al. 1992). For distances in the range 1-3 kpc, the ion-ized mass is in the range (0.3 − 2.8) × 10−3M
⊙. For PNe,
the mass of the ionized shell is anti-correlated with the mean electron density (Pottasch 1984). This can be un-derstood by the fact that, as the ionization front propa-gates increasing the ionized mass, the shell expands and the density decreases. For a young nebula with a density of about 105cm−3, the expected ionized mass is about
(2 − 4) × 10−3M
⊙ (Pottasch 1984), consistent with our
findings and supporting the idea that Hen 2-113 is a young nebula. Note that SNW00 estimated that the expansion age of Hen 2-113 is < 550 yr.
4.2. Infrared excess from circumstellar material close
to the CS
As mentioned in Section 2.2, the photometry of the CS gives m′
L′=8.4±0.1 mag and m
′
M′=8.3±0.2 mag for filters
L’ and M’, respectively. If we compare these values with predictions from atmosphere models, it appears that a star with the same effective temperature as Hen 2-113 should not be so bright at those wavelengths.
Indeed, using Kurucz models (Kurucz 1979) with Tef f = 29000 K (De Marco & Crowther 1998), we have
estimated L’ ∼ 14.5 and M’ ∼ 15.5, by adopting J = 9.78 (Webster and Glass 1974, 2MASS=9.51±0.026) and assumining no extra light contribution to the CS emis-sion at this wavelength. This assumptiandon seems to be justified by the analysis of continuum emission from the UV to the far-IR (see Fig.1 by De Marco & Crowther 1998). Therefore, the observed flux from the central ob-ject in the L’ and M’ bands is about ∼300 and ∼800 times higher respectively than expected from a model includ-ing only the central star. It is worth mentioninclud-ing that a comparison between the PSF and the light profile of the bright central object indicates that the latter is resolved by our data, having an angular diameter of about 155 mas in the L’ band, corresponding to dimensions of 140-430 A.U., if the distance of Hen 2-113 is in the range 1-3 kpc. Notice that a similar infrared excess was also observed by Matsuura et al. (2004) associated to the emission of the CS of NGC 6302.
We tested several hypothese to explain this small and intense emission, in particular free-free and dust emission. In the hypothesis that the observed infrared excess re-sults from bremsstrahlung, the required ionized gas mass within the central region is M ∼ 7 × 10⁻⁵−4 × 10⁻⁴M
⊙
(adopting Te=10000 K and ne = 105cm−3, de Freitas
Pacheco et al. 1993) comparable to the present mass of ionized gas estimated for the whole nebula in Sect. 4.1. Thus this hypothesis seems implausible.
We then considered the possibility that the infrared excess is produced by a “cocoon” of hot amorphous carbon dust.
The wind of the CS of Hen 2-113 is C-rich and one could expect the formation of carbon dust grains as the envelope cools in the expansion and is decelerated by the material previously ejected. If re-radiation by dust is the origin of the infrared excess observed in the L’ and M’ bands, the mass of grains Md inside a radius of 70-210
A.U., within the optically thin approximation, is Md=
4D2f
λaδ
3QλBλ(Td)
(2) where fλ is the observed flux in L’ (or M’) band, a is the
mean grain radius, δ is its density and Qλ is the
absorp-tion(emission) efficiency factor.
The grain temperature, Td, can be estimated from the
flux ratio at two different wavelengths (3.8 µm and 4.78 µm in the present case), e.g.,
fλ1
fλ2
=Qλ1Bλ1(Td)
Qλ2Bλ2(Td)
(3) Assuming dust grains of amorphous carbon (δ = 2.0 g cm−3) with a = 0.2 µm, a temperature of ∼ 1000 K is
derived from the equation above. This high temperature would be expected for carbon grains close to the central star, not very far from the inner regions hotter than 1500 K, when sublimation of amorphous carbon occurs. Once the temperature is known, the dust mass can be estimated from Eq.2 and, for the range of distances, D, considered,
Table 5. Results of the fits to our image with a 2-dimensional Gaussian ellipse. a/b is the ratio between the long and short axis of the ellipse, and θ is its orientation .
Filter a/b P.A. (◦
) PAH content (%) 8.7µm 1.09 68 37 N2 1.05 - 4 SiC 1.16 91 20 N3 1.05 - 11 NB−3.21 1.06 91 -NB−3.28 1.16 91 54 Isaac subtract. 1.34 92 100
The orientation having no meaning for spherical objects, we did not mention angles for N2 and N3 filters.
one obtains Md ∼ (7 − 28) × 10−10M⊙ and gas masses
about two orders of magnitude higher2. The required dust
masses imply optical depths of about 10−3 around 4µm,
justifying our optically thin approximation. These values, which represent a few years of mass-loss, are not in conflict with the nebular ionized gas mass estimated in in Sect. 4.1 and the wind crossing time of the small circumstellar re-gion considered is also a few years.
We note that the temperature and dust mass esti-mated here are remarkably consistent with the mass and temperature independantly estimated by SNW00 for their hot dust component by SED fitting and by De Marco & Crowther (1998) by fit to the IR excess.
4.3. PAHs
Hen 2-113 belongs to a group of bipolar post-AGB stars at the center of young ionised PNe showing both PAH bands and crystalline silicates. A scenario proposed by Waters et al. (1998) and Molster et al. (1999) explains the observed dual chemistry observed around these stars. In this sce-nario, a disk, formed while the star was still oxygen-rich, remains during the high mass-loss phase when the star is carbon-rich, forcing the matter outflow to a bipolar geom-etry perpendicular to the direction of the disc.
Thus, we expect to observe different spatial distribu-tions for PAHs and O-rich grains. Unfortunately, O-rich dust spectral features are observed at wavelengths > 15 µm where atmospheric absorption makes ground-based observations very difficult. Observations at longer wave-lengths (space-based, or with new MIR detectors) where the O-rich dust features lie would certainly bring new in-sights on the spatial distribution of O and C-rich dust.
Mid-infrared spectra of Hen 2-113 display strong fea-tures that can be attributed to PAHs. Different filters were used to observe a varying and significant amount of emis-sion from these PAHs. The underlying continuum was es-timated based on the work of Cohen et al. (2002), who 2 This a lower limit for the mass. The physical conditions
encountered so close to the CS would probably lead to a dust-to-gas mass ratio lower than 1%.
represented the data by the superposition of a blackbody having a temperature of 395 K and that of a grey body (λ−1.2B
λ(T )). The results by Cohen et al. are comparable
to those by SNW00, who fitted the continuum by three blackbody curves, cold (Tc = 100 K), warm (Tw= 378 K)
and hot (Th = 900 K). We retrieved the ISO spectra of
Hen2-113 from the archives and substracted it from the continuum modeled by two blackbodies. We then assume that the features resulting from this substraction was due to PAH. We then compare this with the filter transmis-sions to derive the PAH contribution in each filter.
The estimated PAH contributions in the different fil-ters are 54%,37%, 4%, 20% and 11% for ISAAC 3.28µm, N8.7µm, N2, SiC and N3, respectively. These estimates are based on the assumption that the ISO fluxes recorded with large apertures are equivalent to the fluxes recorded with the various instruments used in this work. To study the morphology of Hen 2-113 in different filters quantitatively we fitted our images with a 2-dimensional Gaussian func-tion. The best-fit parameters are summarized in Table. 5. The observations in the PAH bands (ISAAC 3.28µm, MIDI 8.7µm and TIMMI SiC filter) have a stronger major-to-minor axis ratio and tend to be oriented roughly east/west (except the MIDI image which has a P.A.∼ 68◦).
To check if the PAHs and dust grains responsible for the continuum emission have different spatial distri-butions, we compared observations made with filters in the continuum and filters where the PAH contribution is expected to be significant. We thus compared ISAAC 3.21µm (continuum) and 3.28µm (PAH contribution ∼ 54%) images as well as TIMMI N2 (continuum) and MIDI 8.7µm (PAH contribution ∼ 37%) observations. Note that MIDI and TIMMI have different resolutions, so the MIDI observations were artificially degraded to the TIMMI res-olution (∼ 0.7µm) by simple convres-olution with a 2D gaus-sian to make these observations comparable.
Both ISAAC images show a single bright blob at the centre and a halo surrounding the center. Both blobs have an elongation toward the south/east and south/west di-rection. The halo is almost symmetric with a slight elon-gation, a bright blob at the center and a nearly spheri-cal halo. The TIMMI N2 (continuum) and MIDI 8.7µm images also have a similar morphology. However, we can note that on the N2 image the object is broader than on the 8.7µ image. Whether this is due to the fact that the observations were made with different instruments and ex-posure times or wether the dust grains responsible for the continuum emission have a broader spatial distribution than PAH dust grains is hard to check.
Thus, we focused our work on the comparison of both ISAAC images by comparing radial cuts obtained with different filters (PAHs and continuum). First, using az-imuthal averaging of these radial cuts, we note that in the PAH image the object is broader than on the continuum image. We then tried to check if there was some pref-erential direction for the broadening of the PAH image. We find that the strongest asymmetry (i.e., the intensity ratio for which a given radius is maximum) is observed
for a P.A.∼ 139◦ , the intensity ratio being ∼ 1.55. The
strongest mean asymmetry (i.e. mean value of the inten-sity ratio) is observed for P.A.∼ 248◦ (the intensity ratio
is ∼ 1.24).
Finally, our ISAAC observations show that PAHs seem to have a broader spatial distribution than the grains re-sponsible for the continuum emission. As shown in Sect. ?? the largest difference between the ISAAC PAH and con-tinuum images are observed for P.A.∼ 139◦and ∼ 248◦. It
is interesting to notice that these orientations correspond to the orientations of the main bipolar nebula and the side of the diabolo-shaped structure pointing away from us. These structures being the youngest structures of the nebula, this tends to confirm the fact that the PAHs have been formed more recently than the dust grains responsi-ble for the continuum emission.
5. Conclusion
In this paper, we report high-spatial resolution infrared observations of the young PN Hen 2-113 obtained with dif-ferent instruments at ESO, Chile (NACO, MIDI, ISAAC and TIMMI). These observations provide new insights on the complex morphology and structure of the nebula around it.
These observations, thanks to the high resolution ob-tained with adaptive optics on VLT (NACO), led to the discovery of features previously unseen in this nebula and which seem difficult to explain with current models for the shaping of PNe. We discovered a void of ∼ 0.3′′in
diame-ter around the central source and a hole in the South-East of the nebula. The fact that the direction formed by the CS and this hole is nearly coincident with the orienta-tion of the main axis of the nebula could be a clue for the understanding of the structure of the nebula. A sim-ple geometrical model indicates that the CS is surrounded by a diabolo-shaped dusty structure which is tilted with respect to the rest of the nebula.
Our infrared data indicate an infrared excess with re-spect to the expected stellar emission based on stellar models and shorter wavelength data. We tested different hypothesis to explain this infrared excess. Dust emission very close to the CS seems to be responsible for this excess. Indeed, simple calculations indicate that emission from hot dust (T∼ 900 − 1000K) with mass ∼ 10−9M
⊙ can
account for the infrared excess. The fact, that in their modeling of the SED of Hen 2-113, SNW00 need a hot dust component with the same mass and same tempera-ture, strengthens the hypothesis that the infrared excess is due to emission from hot dust. We also note that such an infrared excess has been observed in at least one simi-lar object (NGC 6302 (Matsuura et al. 2005)), indicating that this could be a feature common to this class of object. We would thus need high-angular resolution observations of other PNe to confirm this hypothesis.
These infrared observations, obtained with different in-struments and wavelengths, allowed us to study the spatial distribution of PAHs in the nebula of Hen 2-113, known
for displaying strong features attributed to PAHs. These observations indicate that the images made with filters containing PAH features seem to be broader than the one observed with continuum filters. The ISAAC observations indicate that the PAH/continuum difference is stronger along the direction of the main nebula and the diabolo-shaped torus. However, it is difficult with these obser-vations to verify the scenario proposed by Waters et al. (1998) and Molster et al. (1999) to explain the dual chem-istry in this class of nebulae. Observations at longer wave-lengths (> 15µm), where spectral features of O-rich dust are observed, would thus be necessary to compare the spa-tial distribution of PAHs and O-rich dust.
Acknowledgements. The authors warmly thank those who made possible these service mode observations, in particular the ESO night astronomers for their careful work. OD would like to acknowledge Janet Jeppson Asimov for financial sup-port.
References
Acker, A., Marcout, J., Ochsenbein, F. et al. 1992, Garching: European Southern Observatory, 1992, Anderson, J. & King, I. R. 2003, PASP, 115, 113 Bains, I., Richards, A. M. S., Gledhill, T. M. et al. 2004, MNRAS, 354, 529
Balick, B. 1987, AJ, 94, 671
Balick, B. & Frank, A. 2002, ARA&A, 40, 439
Biller, B. A., Close, L. M.,Li, A.et al. 2005, ApJ, 620, 450
Chesneau, O., Min, M., Herbst, T. et al. 2005, A&A, 435, 1043
Chesneau, O., de Marco, O., Collioud, A. , 2005, A&A (in preparation)
Cohen, M., Barlow, M. J., Liu, X.-W., et al. 2002, MNRAS, 332, 879
Costa, R. D. D., & Pacheco, J. A. D. 1997, IAU Symp. 180: Planetary Nebulae, 180, 217
Crowther, P.A., De Marco, O. & Barlow, M.J. 1998, MNRAS, 296, 367
de Freitas Pacheco, J.A., Maciel, W.J. and Costa, R.D.D., 1992, A&A 261, 579
de Freitas Pacheco, J. A., Costa, R. D. D., de Araujo, F. X. et al. 1993, MNRAS, 260, 401
De Marco, O., Barlow, M. J., & Storey, P. J. 1997, MNRAS, 292, 86
De Marco, O., Storey, P. J., & Barlow, M. J. 1998, MNRAS, 297, 999
De Marco, O., & Crowther, P. A. 1998, MNRAS, 296, 419
De Marco, O. & Soker, N. 2002, PASP, 114, 602
De Marco, O., Barlow, M. J. & Cohen, M. 2002, ApJ, 574, L83
De Marco, O., Bond, H. E., Harmer, D. et al. 2004, ApJL, 602, L93
Etoka, S., & Diamond, P. 2004, MNRAS, 348, 34 G´orny, S. K., & Tylenda, R. 2000, A&A, 362, 1008
Jordan, S., Werner, K., & O’Toole, S. J. 2005, A&A, 432, 273
Kurucz, R. L. 1979, ApJS, 40, 1
Kwok, S., Purton, C. R., & Fitzgerald, P. M. 1978, ApJL, 219, L125
Lagage, P., Jouan, R., Masse, P., Mestreau, P., Tarrius, A., Kaeufl, H. U., 1993, Proc. SPIE, 1946, 655
Lagadec, E., M´ekarnia, D., de Freitas Pacheco, J. A., & Dougados, C. 2005, A&A, 433, 553
Leinert, C., Graser, U., Przygodda, F. et al. 2003, ApSS, 286, 73
Leinert, C., van Boekel, R., Waters, L. B. F. M et al. 2004, A&A, 423, 537
Leuenhagen, U., Hamann, W.-R. & Jeffery, C. S. 1996, A&A, 312, 167
Matsuura, M., Zijlstra, A. A., Molster, F. J. et al. 2004, ApJ, 604, 791
Matsuura, M., Zijlstra, A. A., Molster, F. J. et al. 2005, MNRAS, 291
Meakin, C. A., Bieging, J. H., Latter, W. B. et al. 2003, ApJ, 585, 482
Miranda, L. F., G´omez, Y., Anglada, G. et al. 2001, Nature, 414, 284
Molster, F. J., Yamamura, I., Waters, L.B.F.M. et al. 1999, Nature, 401, 563
Pottasch, S. R. 1984, Astrophysics and Space Science Library, 107,
Phillips, J. P. 2005, MNRAS, 361, 283
Przygodda, F., Chesneau, O., Graser, U. et al. 2003, ApSS, 286, 85
Sahai, R., Zijlstra, A., Bujarrabal, V., & Te Lintel Hekkert, P. 1999, AJ, 117, 1408
Sahai, R., Nyman, L-A. & Wootten, A. 2000, ApJ, 543, 880
Sahai, R., & Nyman, L. 2000, ApJL, 538, L145
Sorensen, P., & Pollacco, D. 2004, ASP Conf. Ser. 313: Asymmetrical Planetary Nebulae III: Winds, Structure and the Thunderbird, 313, 515
Waters, L. B. F. M., Cami, J., de Jong, T. et al. 1998, Nature, 391, 868
Waters, L.B.F.M., Beintema, D.A.; Zijlstra, A.A. et al. 1998, A&A, 331, L61
Waters, L.B.F.M. & Molster, F.J. 1999, IAUS, 191, 209 Webster, L. B., & Glass, I. S. 1974, MNRAS, 166, 491 Zijlstra, A. A., Gaylard, M. J., Te Lintel Hekkert, P. et al. 1991, A&A, 243, L9