HAL Id: hal-01213716
https://hal.archives-ouvertes.fr/hal-01213716
Submitted on 31 May 2016
HAL is a multi-disciplinary open access
archive for the deposit and dissemination of
sci-entific research documents, whether they are
pub-lished or not. The documents may come from
teaching and research institutions in France or
abroad, or from public or private research centers.
L’archive ouverte pluridisciplinaire HAL, est
destinée au dépôt et à la diffusion de documents
scientifiques de niveau recherche, publiés ou non,
émanant des établissements d’enseignement et de
recherche français ou étrangers, des laboratoires
publics ou privés.
Gold nanoparticle self-assembly moderated by a
cholesteric liquid crystal
Joel S. Pendery, Olivier Merchiers, Delphine Coursault, Johan Grand, Habib
Ayeb, Romain Greget, Bertrand Donnio, Jean-Louis Gallani, Charles
Rosenblatt, Nordin Félidj, et al.
To cite this version:
Joel S. Pendery, Olivier Merchiers, Delphine Coursault, Johan Grand, Habib Ayeb, et al.. Gold
nanoparticle self-assembly moderated by a cholesteric liquid crystal. Soft Matter, Royal Society of
Chemistry, 2013, 9 (39), pp.9366-9375 �10.1039/C3SM51736E�. �hal-01213716�
1 INTRODUCTION
Gold nanoparticle self assembly moderated by a cholesteric
liquid crystal
Joel S. Pendery,
abcOlivier Merchiers,
deDelphine Coursault,
abJohan Grand,
fHabib
Ayeb,
abRomain Greget,
gBertrand Donnio,
gJean-Louis Gallani,
gCharles Rosenblatt,
cNordin Felidj,
fYves Borensztein,
abEmmanuelle Lacaze
∗ abWe show that the study of gold nanoparticle self-assemblies induced by a liquid crystal matrix reveals the intimate distorted structure of the liquid crystal existing prior to nanoparticles incorporation. We also show how this intimate structure monitors the spacing between nanoparticles in the self-assemblies. We have created hybrid films of cholesteric liquid crystal (CLC) and gold nanoparticles, the CLC being deformed by competing anchorings at its two interfaces. Whereas previous results have evidenced formation of only slightly anisotropic clusters of large nanoparticles (diameter 20nm), we now demonstrate for smaller nanoparticles (diameter 4.2nm) formation of long needles of length larger than 50 nanoparticles and width smaller than 5 nanoparticles, on average oriented perpendicular to the anchoring direction. The difference between the two kinds of nanoparticle aggregations is interpreted by a modification of the balance between aggregation between nanoparticles and trapping by the defects, favoured by the disorder induced by the alkylthiol molecules grafted around the nanoparticles. This leads to a well-defined, anisotropic Localized Surface Plasmonic Resonance (LSPR) of the 4.2nm embedded nanoparticles. Interpretation of these optical properties using generalized Mie theory allows for a comparison between CLC/gold nanoparticles and the same nanoparticles trapped within smectic topological defects or deposited on the same substrate without liquid crystal. A smaller spacing between nanoparticles is demonstrated in the CLC system with an attraction between nanoparticles induced by the CLC matrix, related to the additionnal disorder associated with the nanoparticles presence. The experimental observations allow us to estimate the disordered size of the liquid crystal shell around the nanoparticles in the CLC to be of some nanometers. They also suggest that the CLC distorted by competing anchorings is characterized by the presence of arrays of defects with topological cores of width smaller than 5nm that act as efficient anisotropic traps for the nanoparticles.
1
Introduction
It is now established that a large number of well-defined hybrid systems composed of liquid crystals (LC) and nanoparticles can be prepared, either to vary the proper-ties of the LC or those of the nanoparticles [3, 20]. On the other hand, it is also well-known that optical properties of
0aCNRS, UMR 7588, Institut des NanoSciences de Paris
(INSP), 4 place Jussieu, 75005 Paris, France; Tel: +33 1 44274654 ; E-mail: [email protected]
0bUPMC Univ Paris 06, UMR 7588, Institut des NanoSciences
de Paris (INSP), 4 place Jussieu, 75005 Paris, France
0cDept. of Physics, Case Western Reserve University,
Cleve-land, Ohio 44106 USA
0d CNRS, Centre de Recherche Paul Pascal, 115 Avenue
Schweitzer, 33600 Pessac, France
0eUniversit´e of Bordeaux, Centre de Recherche Paul Pascal, 115
Avenue Schweitzer, 33600 Pessac, France
0fLaboratoire Interfaces, Traitements, Organisation et
Dy-namique des Syst`emes (ITODYS), Universit´e Paris Diderot, Sor-bonne Paris Cit´e, ITODYS, UMR 7086 CNRS, 15 rue J-A de Baf, 75205 Paris Cedex 13, France
0g Univ Strasbourg, Institut de physique et de chimie des
mat´eriaux de Strasbourg (IPCMS), CNRS, UMR7504, F-67034 Strasbourg 2, France
the nanoparticles can be tuned if controlled self-assemblies of nanoparticles can be prepared. This calls for a better understanding and control of these hybrid systems. For example, Quantum dots emission can be modified through well-controlled self-assemblies [36, 35, ?]. In addition, the localized surface plasmon resonance (LSPR) properties of metallic nanoparticles may be greatly varied by the cou-pling between nanoparticles [27]. In particular, formation of linear self-assemblies is highly desirable since it exhibits anisotropic optical properties which can be activated by external parameters, like light polarization [9], similarly to oriented nano-rods for example [7, 23].
In the case of nanoparticles dispersed in thermotropic LCs, two main mechanisms have been identified, which facilitate control of the nanoparticles self-assembly by the LC matrix. First a segregation process leads to a local-ization of the nanoparticles at the LC/air interface. For cholesteric LC films (CLCs), the obtained nanoparticle as-semblies can mimic the well-known cholesteric fingerprints [4]. Second, trapping phenomena have been demonstrated for systems with topological defects, such as saturn ring defects surrounding micrometer sized colloids [34], blue
2 MATERIALS
phase disclinations [17, 13, 33, 34], screw disclinations of twist-grain-boundary phases [8] or linear patterns of smec-tic edge dislocations[9, 26]. In the presence of topological defects, nanoparticles are viewed as particulate impurities that distort the LC in their vicinity, or induce disorder. Located in topological defects, they take the place of a portion of the already disordered defect cores and allow for a decrease of the energy within the system [17]. When the defects are linear, like in smectic oily streaks dislocations, single chains of nanoparticles can be obtained exhibiting highly anisotropic LSPR [9]. It now becomes important to identify if new kinds of topological defects can be ori-ented. Two questions can thus be asked: First, are other kinds of topological defects appropriate for a controlled and oriented self-assembly of nanoparticles? Second, how the nature of the trapping sites controls the self-assembly structure, in particular the spacing between nanoparticles which, in return, controls the optical response of the hy-brid system associated with gold nanoparticles?
The goal of the present paper is to study gold nanopar-ticle self-assembly based on the nanoparnanopar-ticles dispersion in a CLC matrix distorted by competing anchorings at the substrate/CLC and CLC/air interfaces. These competing anchorings are known to produce a 90◦ rotation of the
cholesteric helix in the vicinity of the CLC/air interface [2, 6]. Below the area associated with the 90◦rotation, the cholesteric helix is perpendicular to the substrate. Above this area, the helix is parallel to the CLC/air interface, its orientation being linked to the ratio e/p, with e the thick-ness and p the cholesteric pitch [2, 6]. A rotation of the helix parallel to the CLC/air interface can consequently be induced when the pitch is varied, for example by irra-diation of cholesterics doped by photoactive chiral dopants [10, 6]. However the intimate structure of the area associ-ated with 90◦rotation of the cholesteric helix is not known.
The electromagnetic coupling between gold nanoparticles of diameter 4.2nm trapped in the distorted CLC matrix has been evidenced through the measurements of a well-defined anisotropic LSPR. In a second step, the majority of the CLC matrix has been eliminated by evaporation, re-vealing nanoparticle self-assemblies with a needle shape. Analysis of LSPR data using calculations within the frame of generalized Mie theory allows to interpet both data, with and without CLC. They both appear to be consis-tent with the presence of nanoparticle needles. Whereas these hybrid systems lead to the formation of only slightly anisotropic aggregates for large nanoparticles [1] the bal-ance between aggregation and trapping phenomena turns in favor of trapping for small nanoparticles. Moreover the comparison with LSPR data obtained with smectic topo-logical defects or nanoparticle deposition on the substrate without liquid crystal evidences a shorter
internanoparti-cle distance in CLC matrix. Interpretation of these data suggests that the presence of CLC topological defects may induce the trapping of nanoparticles and the formation of needles, but within a defect core of typical diameter smaller than the nanoparticle size. The results demon-strate a direct relation between nanoparticles spacing and nature of liquid crystal traps. They demonstrate addition-ally that the study of nanoparticle self-assembly processes can reveal information about the intrinsic deformations of the LC film.
2
Materials
Polyvinyl alcohol (PVA) was spin coated onto cleaned glass slides, baked at 120◦C to polymerize, and
manu-ally rubbed unidirectionmanu-ally with cotton to promote pla-nar anchoring at the surface. A cholesteric liquid crys-tal (CLC) mixture was prepared by doping 2wt.-% of the chiral agent S-2011 (MLC-6247 from Merck) in the nematic liquid crystal E7 (Merck). This sets the heli-cal pitch at p = 5.5µm. E7 is composed of the meso-gens 5CB (4’-pentyl-4-cyanobiphenyl), 7CB (4-heptyl-4’-cyanobiphenyl), 8OCB (4-octyloxy-4’-cyanobiphenyl) and 5CT (4-cyano-4”-pentylterphenyl) and is in the nematic phase at room temperature with the phase diagram of K(−20◦C)N(58◦C)I. Here K, N and I stand for the
crys-talline, nematic and isotropic phase respectively. It has a high optical anisotropy ∆n = ne− no = 0.23, where
ne= 1.75 is the extraordinary index, parallel to the
opti-cal axis and no= 1.52 is the ordinary index, perpendicular
to the optical axis.
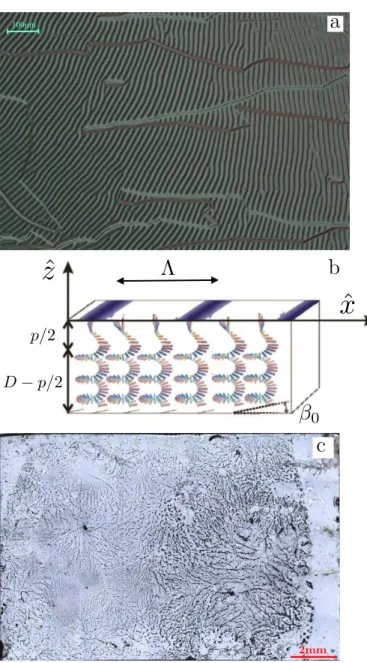
The CLC mixture was spin coated onto the rubbed PVA-coated glass to give an average thickness of∼ 12µm. Inspection by optical microscopy showed a striped tex-ture, of period Λ, of the cholesteric hybrid sample (Fig-ure 1a). Here the PVA substrate promotes planar an-choring and the CLC helical axis, at the substrate and within the bulk, is perpendicular to the substrate. At dis-tance around p/2 below the CLC/air interface, the helical axis undergoes a rotation to change from perpendicular to the substrate in order to better accommodate the direc-tor’s preferred homeotropic boundary condition [2, 6] (Fig-ure 1b). Stripes are observed by optical microscopy and are associated with the helical axis parallel to the CLC/air interface. They are perpendicular to the helix axis and of period slightly larger than two times the cholesteric pitch [2, 6].
Gold nanoparticles have been prepared following the ”inverted Brust-Schiffrin” method, as described by Li et al. [21]. 1.4mL of a 0.2 mmol solution of HAuCl4/3H2O
3 RESULTS 100µm
a
0ˆ
x
ˆ
z
p/2
D
p/2
⇤
b
2mmc
Figure 1 (a) A typical area of the CLC sample, which exhibits the expected striped texture of a hybrid aligned CLC, (b) The director field of the aligned CLC sample. The helical axis is along the ˆz axis, perpendicular to the planar aligning surface over a thickness (D − p/2), p being the cholesteric pitch. It gives way to a rotation of the director within a thickness around p/2 from the CLC/air interface to allow the director to meet the homeotropic boundary condition at the interface[6]), (c) map of the entire sample after evaporation of the liquid crystal.
TOAB in toluene (TOAB is trioctadecylammonium bro-mide), under vigorous stirring at room temperature. After 1 hour, 2mL of freshly prepared aqueous solution (3 mmol) of NaBH4are added. After 10 minutes, 2mL of a 0.6mmol
solution of dodecanethiol in toluene are added. The reac-tion medium is left under stirring for 20 hours. The or-ganic phase is kept, washed once with 500mL of a 2 percent sulfuric acid solution, and then three times with 500mL of pure water. The organic phase is then centrifuged to elim-inate the larger aggregates. The supernatant is kept and evaporated under vacuum down to a volume of a few mL. It is poured into an excess of ethanol. A light centrifuga-tion is performed (2 minutes at 2000rpm), the supernatant is discarded, the precipitate is dried under vacuum. Gold nanoparticles, 4.2nm in diameter (polydispersity 18 per-cent) were then suspended in toluene. A solution of con-centration of 500µg/mL was used. Deposition of 10µL of the suspended nanoparticles solution was conducted on a hot CLC sample, at 55◦C to preserve the striped
tex-ture but to expedite the evaporation of the solvent. After the toluene evaporated, the sample was removed from the heating stage and the CLC texture was observed by opti-cal microscope to confirm the absence of any modification to the period of the stripes. This demonstrates that the CLC pitch was not affected. We can see the presence of nanoparticles by a change of colour of the striped areas larger than 500µm× 500µm. These were the only modi-fications to the striped textures we observed. This obser-vation allowed for localized measurements of the LSPR of the hybrid system, CLC/nanoparticles.
Extinction spectra were measured with an optical mi-croscope using a 50x objective lens, with a numerical aper-ture of 0.55. The sample was inverted such that the po-larized light is incident on the CLC/air interface. The transmitted light was collected and then dispersed using a LOT Oriel MS260i spectro-photometer. A 2mm pinhole allowed an area of 100µm× 100µm to be probed. To ob-tain only the extinction spectra of the nanoparticles, the spectrometer data of the CLC/nanoparticle hybrid sam-ple for a given area and stripe orientation was referenced to a CLC sample with a similar thickness and stripe ori-entation. Data were taken for incident light polarizations parallel and perpendicular to the stripes.
3
Results
3.1
LSPR of nanoparticles/CLC hybrid
films
The extinction spectra of Figure 2a were obtained on the CLC/gold nanoparticle film with stripes perpendicular to
3.2 AFM and LSPR after CLC evaporation 3 RESULTS 550 nm 568 nm Gaussian Para Gaussian Perp Para Perp E xt in ct io n 0.05 0.075 0.1 0.125 Isolated NPs λ = 516 nm E xt in ct io n 0.1 0.2 0.3 0.4 0.5 Wavelength (nm) 450 500 550 600 650 700 750 800
a
b
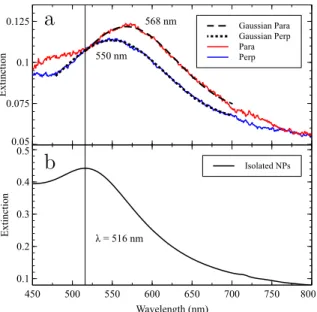
Figure 2 Localized surface plasmon resonance of (a) a typical area for the CLC/nanoparticle hybrid sample (stripes perpendicular to the anchoring direction) and (b) isolated gold nanoparticles suspended in toluene. Parallel (red) and perpendicular (blue) curves correspond to the incident light polarization orientation with respect to the stripe orientation. A Gaussian fit was performed to determine the band
wavelength value.
the anchoring direction. The experimental data were fit-ted with a Gaussian curve. Spectra in Figure 2a display a plasmon resonance of λpara = 568nm when the light
is polarized parallel to the stripes and λperp = 550nm
when the light is polarized perpendicular to the stripes. An extinction spectrum was measured for isolated gold nanoparticles in toluene (see Figure 2b) and the plasmon resonance peak was 516± 1nm. This gives a red-shift for the CLC/gold nanoparticles hybrid film of 52nm for light polarized parallel to the stripes and 34nm for light polar-ized perpendicular to the stripes, exhibiting an anisotropy in the LSPR with respect to the stripes orientation. How-ever the LSPR anisotropy appears to vary from place to place. In fact, LSPR anisotropy is related to anchoring orientation. For stripes oriented parallel to the anchor-ing direction (5 of the 15 measured zones), the larger red-shift occurs in majority for polarization perpendicu-lar to the stripes and thus for poperpendicu-larization perpendicuperpendicu-lar to the anchoring direction (4 of the 5 measured zones of stripes parallel to the anchoring direction). This is also true for stripes perpendicular to the anchoring direction. For these 10 measured zones, the red-shift is larger for polarization parallel to the stripes. If we consider only stripes perpendicular to the anchoring directions, we
ob-tainhλparai = 565 ± 3nm and hλperpi = 555 ± 5nm
It is well known that the localized surface plasmon res-onance of a metal nanoparticle is highly dependent upon the optical index of the surrounding media [14]. How-ever, for the case of metal nanospheres in a liquid crys-tal, Park and Stroud [28] have shown that the LSPR is weakly dependent on the orientation of the electric field along the ordinary or the extraordinary direction. By us-ing their model, we calculated an anisotropy of the LSPR of nanoparticles in CLC of only 2nm, against a maximum of 18nm observed experimentally (Figure 2a). Moreover, the obtained red shifts for the nanoparticles in the CLC with respect to the LSPR of the isolated nanoparticles in toluene, whose index of refraction is ntol = 1.498, is
calcu-lated to be of only 8 and 10nm, along the ordinary and ex-traordinary directions, respectively. Such an effect there-fore does not account for the large observed red-shifts. On the other hand, it is also known that the electromag-netic interaction of close particles can lead to large red-shifts (e.g. for polarisation along a chain of particle, or for two- or three-dimension aggregates). The observed red-shift, not explained by the index of refraction of the CLC, therefore indicates that aggregates of nanoparticles are likely present within the CLC matrix. As shown by the optical anisotropy, their shape and structure may be directly induced by the cholesteric matrix. To understand how the self-assembly process may occur, the aggregate’s shape and structure have to be elucidated.
3.2
AFM and LSPR after CLC
evapora-tion
To resolve the aggregate shape utilizing an atomic force microscope (AFM), the sample was placed in a vacuum oven to remove a significant portion of the liquid crys-tal. This evaporation was performed within a vacuum at 10−7 bar for two days and then heating the sample to
40◦ for an additional three days to expedite the
evapora-tion process. The sample was removed from the vacuum and the surface was mapped using optical microscopy (see Figure 1c). Pictures of the entire surface were taken using a Leica DMRX optical microscope with an objective lens magnification of 5x and then stitched together (Figure 1c). Not all of the CLC was evaporated, which is evident by the presence of the dark, divergent lines on the map cor-responding to thick CLC regions. This was expected since evaporation of large liquid crystal molecules is difficult. However, using this panoramic surface map, regions with only a thin CLC layer could be selected for AFM imaging (Figure 3c). In addition, these same areas were used for LSPR measurements (Figure 4).
3 RESULTS 3.2 AFM and LSPR after CLC evaporation 1 2
a
1b
Topography cross-sections Profile 1 Profile 2 nm −4 −2 0 2 4 35 nm Phase cross-sections Profile 1 D eg re es −5 −2.5 0 2.5 5 7.5 nm 0 50 100 150 200c
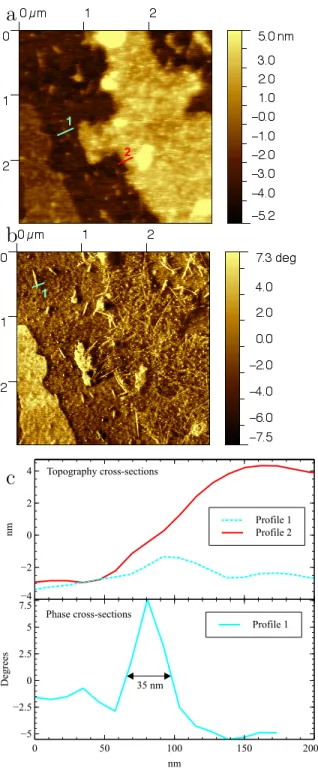
Figure 3 (a) AFM Topographical and (b) phase data for a region with a plasmon resonance peak. (c) Corresponding topographical cross sections according to the lines drawn on (a) and (b). A high number of anisotropic aggregates are visible in the phase data below a liquid crystal layer. The dimensions of a needle (width 35nm - (bottom of (c))) are determined using the phase data (b) as this allows for precise location of the needle’s edges.
were probed using the AFM. Regions of 100µm× 100µm, of size similar to the one measured by spectro-photometry, were imaged and zooms were performed until individual aggregates could be resolved. No particles could be imaged in regions without a plasmon resonance, in agreement with having the number of nanoparticles below the threshold for LSPR measurement. In areas that exhibited a LSPR, either a homogeneous AFM topography and phase were present or areas with needle-like structures were observed (Figure 3a and 3b). The needles, absent in the regions where no LSPR is measured, are therefore the nanoparti-cle aggregates, as it will be discussed in detail below. If we concentrate on Figure 3a, two distinct regions are ob-served with needles: 1) the valley area on the left half of the image and 2) the large, elevated region on the right half of the image. In the topography, flat needle-like ag-gregates are clearly visible, but only in the lowest region (1). In contrast, in the phase data (Figure 3b), the needle shaped aggregates are visible in the lowest region but also appear, less clearly but in larger quantity, in the highest region (2). The length of the needles varies from 100 to 400nm while the width varies from approximately 30 to 40nm. Taking into account the curvature radius of the AFM tip, varying typically between 5 and 30 nm [32], the needles width can not be precisely determined. It may range from 1 to 5 nanoparticles.
The topography of the needles investigated in the (1) valley (Figure 3c profile 1) shows a height of approximately 2− 3nm for the needles. Since the diameter of a nanopar-ticle is 4.2nm, one must conclude that the nanoparnanopar-ticle needles are flat on the surface, one particle thick but still partially submerged in the CLC. In addition, around the nanoparticles, in the lowest (1) as well as in the elevated (2) region, the AFM phase image is similar (Figure 3b). The phase is correlated with the stiffness of a given re-gion [25], and it suggests that both of these rere-gions are covered in CLC. Accordingly, the AFM phase on top of the nanoparticles is higher since nanoparticles consist of harder material. This is evident in the lowest area (1) where the AFM tip directly interacts with the nanoparti-cles. This is also the case in the most elevated region (2), although less clearly, in agreement with needles covered by CLC, as shown by topography data, with no protuberant needles. These needles, after CLC evaporation, get close to the air/CLC interface and modify its stiffness. This allows us to observe the needles using AFM. These results finally reveal the presence of needles mostly covered by CLC, which may be responsible for the LSPR signal (Fig-ure 4), meas(Fig-ured over the same area as the AFM data (Figure 3).
The region at the bottom left of the image is believed to correspond to a demixing of E7 liquid crystal induced
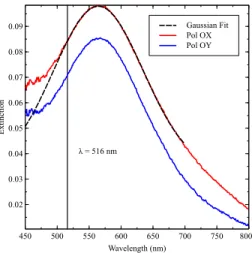
3.3 LSPR analysis 3 RESULTS λ = 516 nm Gaussian Fit Pol OX Pol OY E xt in ct io n 0.02 0.03 0.04 0.05 0.06 0.07 0.08 0.09 Wavelength (nm) 450 500 550 600 650 700 750 800
Figure 4 Extinction spectra from the selected region where AFM measurements were conducted. Parallel (red) and perpendicular (blue) curves correspond to the incident light polarization orientation with respect to anchoring orientation.
by the evaporation, leading to a crystallized hard area, as shown by phase image. It may correspond to pure 8OCB, pure 5CT or a mixture of the two, which are expected to be crystalline at ambient temperature.
Measurements of LSPR band performed on 7 areas of the evaporated sample mainly lead to similar LSPR band (Figure 4), parallel (x-axishλi = 564 ± 1nm) and perpen-dicular (y-axis hλi = 566 ± 1nm) to the anchoring direc-tion. The homogeneity of the LSPR signal suggests that the needles can be present but covered by a CLC film too thick to allow their observation with AFM. This is the case only when fully homogeneous topology and phase data are obtained with AFM. The absence of anisotropy, in contrast with the results obtained previous to evapo-ration, is in agreement with the observation by AFM of disordered needles. We will show in the following that for-mation of needles not only allows one to interpret the data after evaporation, but also allows one to interpret the opti-cal properties in hybrid nanoparticles/CLC films, strongly suggesting that aggregation phenomenon is mostly inde-pendent of the evaporation process. The small size of the needles is consistent with the absence of any change of texture for the hybrid nanoparticle/CLC films observed by optical microscopy compared to pure CLC. A smaller disorder of the needles orientation may be present in the CLC/nanoparticle hybrid sample, the CLC evaporation process modifying mainly the orientation of the needles.
3.3
LSPR analysis
To interpret the LSPR data after removal of the cholesteric film, we associate the needles with the presence of
nanoparticle ribbons of disordered orientation. We
have considered ribbons formed by hexagonally packed nanoparticles, characterized by the inter-nanoparticles edge-to-edge distance, the so-called spacing, s. To fit with the AFM data, we have considered long 2D rib-bons only and calculated the related LSPR by the gen-eralized Mie theory [24]. The optical index of the em-bedding medium has been taken equal to that of alkylth-iols, (n=1.458). Due to the small distance between the nanoparticles, there will be mainly alkylthiol molecules between them. It is well-known that in nanoparticle chains, for a given nanoparticle spacing, the red-shift of the LSPR wavelength with respect to isolated nanoparti-cles, increases with the length of the chain until it satu-rates [16, 40, 30, 11, 38]. We expect similar behavior for the ribbons, and we have considered ribbons of length 45 nanoparticles, of the order of the length of the measured
needles 45× 4.8nm = 216nm. AFM data show widths
of the order of 30− 40nm (Figure 3c). Taking into ac-count the convolution by the AFM tip of curvature radius around 10nm [32], the exact width values can not be ob-tained, only evidencing widths equal to or smaller than 5 nanoparticles. We note that the red-shift of ribbons sat-urates more slowly than chains and that the red-shift of a ribbon with a length of 45 nanoparticles is not com-pletely saturated but very close to saturation. Ribbons are associated with a LSPR wavelength for polarization parallel to the ribbons larger than the one for polarization perpendicular to the ribbons (Figure 5). For ribbons of disordered orientation, the average LSPR is proportional to the sum of both extinctions and is shown in Figure 5 for a width equal to 3 nanoparticles (s = 0.56nm). The spacings between nanoparticles accounting for an average plasmon band at 565nm, are summarized in table 1 for ribbons widths ranging from 1 to 5 nanoparticles. We can already conclude that s is smaller than 0.6nm, which sug-gests a strong interdigitation/compression of the alkylth-iols between the nanoparticles.
The anisotropy of LSPR bands observed in the pres-ence of cholesteric films is associated with ribbons that, on average, are oriented perpendicular to the anchoring direction. However, they are not strictly oriented perpen-dicular to the anchoring direction since a larger anisotropy than the maximum 18nm would be expected between the polarization parallel to the anchoring direction and the perpendicular polarization (Figure 5). If we consider the spectra of figure 2a, we can interpret the observed LSPR anisotropy of 18nm, as a consequence of some disorienta-tion of the ribbons, using the property that the final ex-tinction can be approximated by a linear combination of extinction parallel and perpendicular to the ribbons long axis. We will now explain briefly the theoretical argument
3 RESULTS 3.3 LSPR analysis
Figure 5 Extinction spectra calculated in generalized Mie theory in a thiol index for a ribbon of length 45 nanoparticles and width 3 nanoparticles (s = 0.56nm). In blue the
polarization is perpendicular to the ribbon in red it is parallel. In green the average extinction is presented.
underlying this property.
The extinction efficiency (cross-section normalized by the geometrical section) for an arbitrary incident polar-ization can be written as[5]:
Q(θ) = Qparcos2θ + Qperpsin2θ + Qpar,perpsin θ cos θ,
(1) where θ is the angle between the ribbon’s long axis and the incident polarization vector. Qpar and Qperp are the
extinction efficiencies for incident polarization parallel or perpendicular to the ribbon’s axis respectively. The term Qpar,perp, is the contribution due to cross-polarization
(off-diagonal terms in the scattering amplitude matrix are non-zero in general). We consider now the needles to be dis-oriented with respect to the incident polarization vector. If n(θ) is the distribution function of the angles, we can write the average extinction efficiency as
hQi = Z π
0
n(θ)(Qparcos2θ+Qperpsin2θ+Qpar,perpsin θ cos θ)dθ.
(2) For a uniform probability density function of the type n(θ) = 1/π (our hybrid films after evaporation), we get:
hQi = (Qpar+ Qperp)/2. (3)
In the case of a non-uniform distribution, the cross-term does not vanish in general. However, for the ribbons con-sidered here, we found that the factor Qpar,perp is
negligi-ble. This simplifies the analysis greatly, since now we can write the very simple equation:
hQi = QparC + Qperp(1− C), (4)
where we used the fact that the distribution n(θ) is
nor-malized to one. Hence C = Rπ
0 n(θ) cos
2θdθ, Q par and
Qperp being calculated. We can now use this equation to
fit the experimental data and estimate the alignment of the ribbons (C = 0.5 being completely random and C = 0.0 or C = 1.0 being perfectly aligned).
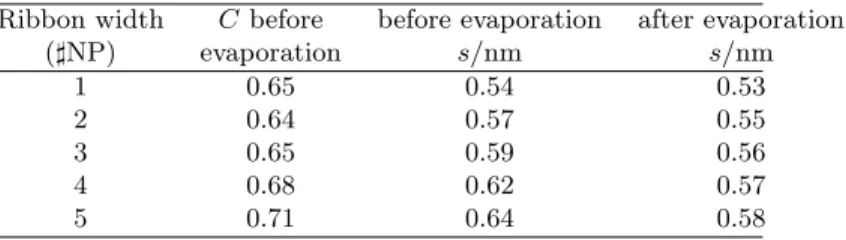
We have considered 5 cases to account for the extinc-tion spectra of figure 2a, each case being associated with a given ribbon width, ranging from 1 to 5 nanoparticles. The results are summarized in table 1. These results give a measure of the disorientation of the ribbons along the CLC stripes, around C = 0.65. They suggest that the areas where anisotropy is maximum (figure 2a) could dis-play homogeneous ribbons width and inter-particle spac-ings. We can not establish their exact values. However, from Table 1 it appears that the spacing obtained for the initial cholesteric film (before evaporation) is very similar to the one after evaporation. Only a small spacing reduc-tion after evaporareduc-tion is evidenced, which on the other hand depends on the considered ribbon width. For chains or thin ribbons with 2 nanoparticles-width, a very small reduction is associated with the LSPR data. Furthermore, because we expect a mainly constant inter-particle spac-ing in the initial cholesteric film, the position dependent anisotropy can be interpreted in two ways: 1. for a con-stant value of the aggregate width, the disorder varies (varying C from place to place), or 2. for a nearly constant C value, the width varies together with a possibly varying local nanoparticle concentration. More precisely: to main-tain the same anisotropy (for example the h∆λi = 18nm value of figure 2a), C has to increase (better alignment) together with the ribbon width. This is expected since chains have a higher aspect ratio than wide ribbons and the former are thus intrinsically more anisotropic. This is why we can expect a majority of thin ribbons in the area of maximum anisotropy (∆λ = 18nm) with C values around 0.64. With the hypothesis of mainly constant C value, the observed average smaller anisotropy (h∆λi = 10nm) could be the consequence of an increasing number of wider ribbons when local nanoparticle concentrations increase.
Table 1 Results of the fit using eq. 2, for different widths.
Ribbon width C before before evaporation after evaporation
(]NP) evaporation s/nm s/nm 1 0.65 0.54 0.53 2 0.64 0.57 0.55 3 0.65 0.59 0.56 4 0.68 0.62 0.57 5 0.71 0.64 0.58
4.2 Trapping sites for the needles 4 DISCUSSION
4
Discussion
4.1
Needles as the result of trapping in
specific areas
In order to understand the origin of the needles, the first question concerns their localization at the CLC/air inter-face or within CLC bulk. We have demonstrated by AFM that, even after evaporation of the majority of the liq-uid crystal film, most of the needles are still covered by CLC molecules. This suggests that they are composed of nanoparticles which have penetrated into the CLC film, in contrast with segregation at the surface. This latter process occurs for micrometrical colloids at cholesteric/oil interface [29, 22]. For nanoparticles it occurs in cholester-ics after long annealing [4] or for nanoparticles originally dispersed in bad solvants for liquid crystals, like water [1]. The second question directly concerns the origin of the needles. It is remarkable that the two kinds of nanoparticles, nanoparticles of diameter 20nm covered by PVP polymer, studied by Ayeb et al. [1] and the present nanoparticles of diameter 4.2nm with grafted do-decanethiol, both lead to formation of elongated aggre-gates of limited size, oriented on average by the CLC ma-trix. This is consistent with a minimum of energy as-sociated with a trapping of nanoparticles in a favorable area. One can not exclude that kinetic issues also are in-volved and that elongated aggregates only correspond to metastable states. On the other hand, our results reveal a more anisometric shape for the aggregates formed from small nanoparticles. In order to understand this differ-ence, let us recall first that in nematic 5CB in the absence of any localized deformation of the liquid crystal director, isotropic aggregates, possibly large, are formed from small nanoparticles coated with dodecanethiols [31], in contrast with large nanoparticles, of diameter larger than 30nm [?]. This shows a strong tendency for nanoparticles in the nematic film to aggregate, at least partially under the influence of Van der Waals forces. Comparison between nanoparticles size (4.2nm) and helix pitch (p = 5.5µm) shows that, in the CLC, in the absence of any specific distorsions, the environment around the nanoparticles is locally a very weakly twisted nematic. We thus would ex-pect formation of isotropic aggregates like in 5CB nematic films. However the observation of anisometric aggregates of limited size and on average oriented by the CLC matrix suggests that aggregation is balanced by a phenomenon of nanoparticle trapping. For large nanoparticles, cluster for-mation would occur prior to trapping, leading to forfor-mation of only slightly anisometric clusters. For small nanoparti-cles, we observe mainly long needles (with lengths of sev-eral hundreds of nanometers) with small width (not larger
than 5 nanoparticles). Such an anisotropy is not com-patible with bulk aggregation. This suggests that trap-ping would preferentially occur in a specific anisotropic area prior to Van der Waals induced aggregation. Aggre-gation would occur within this anisotropic trapping area in a second step, the complete process being associated with solvant evaporation. It is known that distorted liq-uid crystal areas attract nanoparticles due to the reduc-tion of elastic energy accompanying the replacement of a distorted volume by a nanoparticle. Nanoparticles are thus attracted by distortion gradients [39, 34]. In CLC it has been shown that even polymers can be attracted by distorted areas [?]. For nanoparticles this is expected to occur indepedently of the nature of the nanoparticles, but the attraction efficiency has been shown to depend on the anchoring around the nanoparticles [33, 34]. This may at least partially explain the better trapping observed for the small nanoparticles in CLC since they were covered by alkylthiol, in contrast with the large nanoparticles covered by PVP polymer [1], the nanoparticle size also coming into play.
4.2
Trapping sites for the needles
It is now well-known that, once nanoparticles are at-tracted, stable sites of trapping can be at liquid crystal topological defects. This is due to the particularly large energetic advantage associated with the replacement of a defect core by a nanoparticle. Stable sites have been ev-idenced for topological defects localized on micrometer-size colloids in nematic films [34], for disclinations in blue phases [41, 13, 33], screw disclinations of twist-grain-boundary phases [8] as well as for smectic dislocations [9, 26]. To better understand the nature of the trapping sites in the present CLC, it may be useful to compare trapping within the CLC film and trapping within smec-tic dislocations for the same nanoparsmec-ticles.
We thus have trapped our 4.2nm nanoparticles in lin-ear patterns of smectic dislocations of 8CB [9], expected to be associated with a linear dislocation core of diameter several nanometers and composed of disordered molecules [19]. We have obtained chain-like aggregates along the dis-location patterns associated with a LSPR band at 553nm for light polarized parallel to the dislocations, whereas the LSPR for light polarized perpendicular to the dislocations remains close to that of isolated nanoparticles (516nm). Analysis with Generalized Mie theory gives an average distance of 0.98nm between nanoparticles, larger by more than 50 percent than the distance obtained in the CLC. Moreover, when a simple monolayer of nanoparticles is formed in the absence of liquid crystal by depositing a drop of nanoparticles in toluene on the rubbed PVA
sub-4 DISCUSSION 4.2 Trapping sites for the needles
strate, we observe a LSPR band of 556nm, independent of the light polarization. This band does not vary with the nanoparticles concentration. It consequently does not vary with the size of the domains of the monolayer. This implies that the monolayer is formed of 2D domains of coupled nanoparticles that can be considered as infinite for a simulation of the monolayer LSPR since their phys-ical size can be considered as beyond the coupling satu-ration for LSPR. As shown by dipole approximation cal-culations performed for an infinite hexagonal network of nanoparticles in a medium with an optical index equal to that of alkylthiol, the inter-particle spacing is s = 1nm. This suggests that, in smectic defects, the spacing between nanoparticles is very similar to that in the monolayer net-work and may be mainly mediated by the same attractive Van der Waals interactions between nanoparticles, as well as steric repulsive interactions. This is not the case in CLC.
In CLC, compression of the nanoparticles spacing im-poses a larger interdigitation between the thiols around the nanoparticles. This compression must be imposed by the surrounding CLC and confirms localization of the nee-dles within the CLC film. This compression may arise from the disorder induced by the nanoparticles in the cholesteric sample. If the trapping area is not fully ordered, the presence of nanoparticles locally induces dis-order in the liquid crystal, entailing an additional energetic cost that is absent in topological defects with large enough disordered cores. Consequently in CLC, the distance be-tween two nanoparticles must be as close as possible to reduce the disordered volume around the nanoparticles in contrast with smectic disordered cores [9].
A simple calculation can be made to account for nanoparticles that are further attracted by the 0.4nm dif-ference that is observed between nanoparticles spacing in nanoparticle monolayers without liquid crystal or in smec-tic defects vs. in CLC. If we calculate the Van der Waals interactions between two 4.2nm gold spheres in a thiol environment, for a spacing 0.98nm, an energy of 1.5kT is obtained. For a spacing 0.6nm, an energy of 4.5kT is obtained [15]. In the monolayer, Van der Waals attrac-tions are balanced by steric interacattrac-tions that do not allow for a reduced spacing. Due to the alkanethiol coating, allowing quasi-no LC to penetrate between the nanopar-ticles, we can consider that the Hamaker constant for the nanoparticle monolayer on PVA is similar to that for the nanoparticle needles in CLC, as only the host medium has changed. The CLC compression must be significantly larger than the gain due to Van der Waals interactions in order to successfully compete with steric repulsion as-sociated with strong interdigitation and compression im-posed by the thiol molecules between nanoparticles [15].
To obtain an increase of disorder energy of 50 times the attractive Van der Waals energy (150kT) when s decreases by 0.4nm, we need a disordered volume of E7 around the nanoparticle equal to approximately 50nm3. This volume
is calculated using the heat capacity of 8CB [37], which has been shown to be very close to 5CB, the major com-ponent of E7 [12]. This disordered volume (50nm3)
corre-sponds to a shell of disordered liquid crystal of the order of 3.5nm surrounding the nanoparticles. This liquid crystal disorder induced in the presence of the alkylthiols around nanoparticles has previously been suggested to explain the observed attraction of these nanoparticles by distorted liq-uid crystal areas [33, 9]. It is also in agreement with the better trapping observed for the 4.2nm nanoparticles with respect to the large ones covered by PVP.
Despite the observed stability of the hybrid systems, the disorder energy may cancel the energy advantage as-sociated with trapping, unlike the case where nanopar-ticles are trapped in smectic dislocations. On the other hand, in the presence of a shell of disordered CLC around the nanoparticles, we expect spherical aggregations of the nanoparticles to be of smaller disorder energy than rib-bons. Spherical aggregation occurs in nematic liquid crys-tals [31] but not in our distorted CLC. The large difference between the disorder energies of nanoparticles aggregated in spheres and nanoparticles aggregated in ribbons can be compensated by the advantage associated with the local-ization of the nanoparticles in topological defect cores. It can not be compensated by a localization of nanoparticles only in elastically distorted areas. Two interpretations are possible to explain such a result. First nanoparticles are trapped by topological cores. These cores must be signif-icantly smaller than the nanoparticle size. Thus molecu-lar disorder is induced around the nanoparticles and com-pression of the nanoparticles spacing occurs. Second, nee-dles may not be trapped by disordered defect cores but by highly distorted cholesteric areas. This would corre-spond to a metastable state. For example, at a distance D from the center of curvature of a curved nematic, the replacement of the distorted liquid crystal constitutes an elastic advantage that can be roughly estimated to be 4KR3/D2, where K is the bend modulus, of the order
of 10−11Jm−1, and R the particle radius. For particles
of radius 2.1nm, the elastic term is larger than kT (k is Boltzmann’s constant) if D is smaller than 10nm, only two times the nanoparticle diameter. We consequently do not expect a strong stability of trapping by elastically dis-torted areas for small nanoparticles. The observed stabil-ity of the hybrid systems, together with the observation that no modification in the CLC texture is observed by optical microscopy more likely suggests the presence of disordered defect cores as trapping zones.
REFERENCES
It has been shown that dislocations at the CLC/air interface, associated with the connection between pla-nar cholesteric helix and homeotropic anchoring, can trap micrometer-sized colloids [29, 22]. We do not believe that they are responsible for the present nanoparticles trapping since only one dislocation is expected per stripe, as shown in figure 1a. This would produce a small density of needles, not consistent with the intense well-defined LSPR usually observed, together with AFM observations of locally large numbers of needles. It thus appears natural to assume that trapping occurs in the area where the cholesteric helix ro-tates by 90oto become parallel to the CLC/air interface.
The trapping area may be constituted by an array of lin-ear disclinations, on average perpendicular to anchoring direction, of width smaller than 5nm. To account for such a small width, they may correspond to the so-called τ dis-locations, of singular nematic director [18]. Due to this small width, we expect formation of nanoparticle chains in a first step. The formation of chains may be followed in a second step by a localization of the nanoparticles around the chains in the elastically deformed zones around the de-fect cores to produce thicker ribbons (Figure 3b). This is in agreement with LSPR data which can be interpreted by a majority of thin ribbons, chains or ribbons of 2 nanopar-ticles width, for the more anisotropic zones (Figure 2a). The observation of an experimental extinction anisotropy of hybrid films associated with needles mainly perpendic-ular to the anchoring orientation for various stripe direc-tions can be interpreted as the signature of an evolution of the 90o helix deformation with the film thickness. The
stripe orientation with respect to the anchoring direction is indeed proportionnal to the thickness [2]. This would be true at least for the range of CLC film thickness used in the present study, around twice the cholesteric pitch.
5
Conclusion
We show that CLC films, deformed by competing an-choring at the interfaces, planar unidirectional versus homeotropic, are characterized by the presence of linear traps for nanoparticles. They may be either highly elasti-cally distorted areas, or oriented linear defects with disor-dered cores of width smaller than a few nanometers, asso-ciated with the helix rotation in the vicinity of CLC/air interface, the stability of the hybrid system being in favour of the latter assumption. These traps lead to the for-mation of nanoparticle needles of width smaller than 5 nanoparticles, of length larger than 50 nanoparticles and characterized by an intense and well-defined anisotropic LSPR response. The spacing between nanoparticles in the needles appears to be about 50 percent smaller than for
the same nanoparticles deposited on the substrate without liquid crystal or trapped within smectic dislocation cores. This may be related to disorder induced by the nanopar-ticles within CLC elastically distorted areas or around the CLC defect cores. The corresponding disorder is estimated to be a disordered CLC shell around the nanoparticles of some nanometers. In the presence of topological de-fects, the main parameter controlling the nanoparticles spacing is the size of the defect disordered cores versus the nanoparticle diameter. These results not only gives a limit for the defect size in the CLC distorted films, but they illustrate the role of the defects nature on the crystal-lographic characteristics of the induced nanoparticle self-assembly. These hybrid films are finally characterized by nanoparticles strictly confined within a specific area, in the thickness of the CLC film. They open a route for a number of hybrid systems of anisotropic optical properties. They also open a path for new anisotropic electro-optical prop-erties, with the possibility, for example, to locally heat within the CLC film trapping area, using the LSPR field excitation. This would allow for further control of the ro-tation of macroscopic objects under irradiation of molecu-lar motors replacing the classical chiral dopants [10, 6]. We finally note that studying the LSPR of trapped nanopar-ticles gives new information on the nature of highly de-formed areas in these CLC films.
6
Acknowledgement
We would like to thank Dominique Demaille of INSP for TEM measurements and Mohammed Selmane of LCMCP
(Paris-France) for making SAXS measurements. We
would like to thank M.H. Li and P. Keller from Institut Curie for providing the rubbing machine. The CWRU experimental work was supported by the National Sci-ence Foundation’s Condensed Matter Physics and Solid State and Materials Chemistry Programs under Grant No. DMR-1065491 and the analysis and exposition were sup-ported by the US Dept. of Energy under grant No. DE-FG02-01ER45934. JSP’s travel and expenses at UPMC were supported by the Chateaubriand fellowship and the Partner University Fund.
References
[1] H. Ayeb, J. Grand, H. Sellame, S. Truong, J. Aubard, N. Felidj, A. Mlayah, and E. Lacaze. Gold nanopar-ticles in a cholesteric liquid crystal matrix: self-organization and localized surface plasmon proper-ties. J. Mater. Chem., 22:7856–7862, 2012.
REFERENCES REFERENCES
[2] J. Baudry, M. Brazovskaia, L. Lejcek, P. Oswald, and S. Pirkl. Arch-texture in cholesteric liquid crystals. Liquid Crystals, 21(6):893–901, 1996.
[3] H. K. Bisoyi and S. Kumar. Liquid-crystal
nanoscience: an emerging avenue of soft
self-assembly. Chem. Soc. Rev., 40:306–319, 2011. [4] R. Bitar, G. Agez, and M. Mitov. Cholesteric liquid
crystal self-organization of gold nanoparticles. Soft Matt., 7:8198–8206, 2011.
[5] C. Bohren and D. Huffman. Absorption and scatter-ing of light by small particles. Wiley science paper-back series. Wiley, 1983.
[6] A. Bosco, M. G. M. Jongejan, R. Eelkema, N. Katso-nis, E. Lacaze, A. Ferrarini, and B. L. Feringa. Pho-toinduced reorganization of motor-doped chiral liq-uid crystals: Bridging molecular isomerization and texture rotation. JACS, 130(44):14615–14624, 2008. PMID: 18839947.
[7] K. C. Chu, C. Y. Chao, Y. F. Chen, Y. C. Wu, and C. C. Chen. Electrically controlled surface plasmon resonance frequency of gold nanorods. Appl. Phys. Lett., 89(10):103107, 2006.
[8] G. Cordoyiannis, V. S. R. Jampani, S. Kralj, S. Dhara, V. Tzitzios, G. Basina, G. Nounesis, Z. Kutnjak, C. S. P. Tripathi, P. Losada-Perez, D. Jesenek, C. Glorieux, I. Muˇseviˇc, A. Zidansek, H. Ameinitsch, and T. J. Different modulated struc-tures of topological defects stabilized by adaptive tar-geting nanoparticles. Soft Matt., 9:3956–3964, 2013. [9] D. Coursault, J. Grand, B. Zappone, H. Ayeb,
G. L´evi, N. F´elidj, and E. Lacaze. Linear self-assembly of nanoparticles within liquid crystal defect arrays. Adv. Mat., 24(11):1461–1465, 2012.
[10] R. Eelkema, M. Pollard, J. Vicario, N. Katso-nis, B. Ramon, C. Bastiaansen, D. Broer, and B. Feringa. Nanomotor rotates microscale objects. Nature, 7081(440):163–163, 2006.
[11] C. Girard. Near fields in nanostructures. Rep. Progr. Phys., 68(8):1883, 2005.
[12] G. S. Iannacchione and D. Finotello. Specific heat de-pendence on orientational order at cylindrically con-fined liquid crystal phase transitions. Phys. Rev. E, 50:4780–4795, Dec 1994.
[13] E. Karatairi, B. Roˇziˇc, Z. Kutnjak, V. Tzitzios, G. Nounesis, G. Cordoyiannis, J. Thoen, C. Glorieux,
and S. Kralj. Nanoparticle-induced widening of the temperature range of liquid-crystalline blue phases. Phys. Rev. E, 81:041703, Apr 2010.
[14] K. L. Kelly, E. Coronado, L. L. Zhao, and G. C. Schatz. The optical properties of metal nanoparti-cles: the influence of size, shape, and dielectric envi-ronment. J. of Phys. Chem. B, 107(3):668–677, 2003. [15] S. J. Khan, F. Pierce, C. M. Sorensen, and
A. Chakrabarti. Self-assembly of ligated gold
nanoparticles: Phenomenological modeling and com-puter simulations. Langmuir, 25(24):13861–13868, 2009.
[16] N. G. Khlebtsov and L. A. Dykman. Optical
properties and biomedical applications of plasmonic nanoparticles. Journal of Quantitative Spectroscopy and Radiative Transfer, 111(1):1 – 35, 2010.
[17] H. Kikuchi, M. Yokota, Y. Hisakado, H. Yang, and T. Kajiyama. Polymer-stabilized liquid crystal blue phases. Nat Mater, 1(1):64–68, 09 2002.
[18] M. Kleman and L. O. Cholesteric Liquid Crystals: Defects and Topology. Springer–Verlag New York, Inc.
[19] M. Klman. Points, lines and walls in liquid crystals, magnetic systems and various ordered media. John Wiley Sons, 1983.
[20] J. P. Lagerwall and G. Scalia. A new era for liquid crystal research: Applications of liquid crystals in soft matter nano-, bio- and microtechnology. Currt App. Phys., 12(6):1387 – 1412, 2012.
[21] Y. Li, O. Zaluzhna, B. Xu, Y. Gao, J. M.
Mod-est, and Y. J. Tong. Mechanistic insights into
the brust?schiffrin two-phase synthesis of organo-chalcogenate-protected metal nanoparticles. JACS, 5(133):2092–209, 2011.
[22] J. S. Lintuvuori, P. A. C., K. Stratford, M. E. Cates, P. S. Clegg, and D. Marenduzzo. Colloidal templat-ing at a cholesteric-oil interface: Assembly guided by an array of disclination lines. Phys. Rev. Lett., 18(110):187801–5, 2013.
[23] Q. Liu, Y. Cui, D. Gardner, X. Li, S. He, and I. I. Smalyukh. Self-alignment of plasmonic gold nanorods in reconfigurable anisotropic fluids for tunable bulk metamaterial applications. Nano Lett., 10(4):1347– 1353, 2010. PMID: 20334353.
REFERENCES REFERENCES
[24] D. W. Mackowski. Calculation of total cross sec-tions of multiple-sphere clusters. J. Opt. Soc. Am. A, 11(11):2851–2861, Nov 1994.
[25] S. Magonov, V. Elings, and M.-H. Whangbo. Phase imaging and stiffness in tapping-mode atomic force microscopy. Surf. Sci., 375(2ˆa“3):L385 – L391, 1997. [26] J. Milette, S. Relaix, C. Lavigne, V. Toader, S. J. Cowling, I. M. Saez, R. B. Lennox, J. W. Goodby, and L. Reven. Reversible long-range patterning of gold nanoparticles by smectic liquid crystals. Soft Matt., 8:6593–6598, 2012.
[27] V. Myroshnychenko, J. Rodriguez-Fernandez,
I. Pastoriza-Santos, A. M. Funston, C. Novo, P. Mul-vaney, L. M. Liz-Marzan, and F. J. Garcia de Abajo. Modelling the optical response of gold nanoparticles. Chem. Soc. Rev., 37:1792–1805, 2008.
[28] S. Y. Park and D. Stroud. Splitting of surface plas-mon frequencies of metal particles in a nematic liquid crystal. Appl. Phys. Lett., 85(14):2920–2922, 2004. [29] A. Pawsey, J. Lintuvuori, T. Wood, J. Thijssen,
D. Marenduzzo, and P. Clegg. Colloidal particles at the interface between an isotropic liquid and a chiral liquid crystal. Soft Matt., 32(8):8422–8428, 2012.
[30] M. Pelton, J. Aizpurua, and G. Bryant.
Metal-nanoparticle plasmonics. Laser Photon. Rev.,
2(3):136–159, 2008.
[31] H. Qi, B. Kinkead, V. Marx, H. Zhang, and T. Heg-mann. Miscibility and alignment effects of mixed monolayer cyanobiphenyl liquid-crystal-capped gold nanoparticles in nematic cyanobiphenyl liquid crys-tal hosts. ChemPhysChem, 10(8):1211–8, 2009. [32] R. D. Rodriguez, E. Lacaze, and J. Jupille. Probing
the probe: Afm tip-profiling via nanotemplates to determine hamaker constants from phaseˆa“distance curves. Ultramicr., 121(0):25 – 30, 2012.
[33] B. Roˇziˇc, V. Tzitzios, E. Karatairi, U. Tkalec, G. Nounesis, Z. Kutnjak, G. Cordoyiannis, R. Rosso, E. Virga, I. Muˇseviˇc, and S. Kralj. Theoretical and experimental study of the nanoparticle-driven blue phase stabilisation. Eur.Phys. J. E, 34:1–11, 2011. 10.1140/epje/i2011-11017-8.
[34] B. Senyuk, J. S. Evans, P. J. Ackerman, T. Lee, P. Manna, L. Vigderman, E. R. Zubarev, J. v. d.
Lagemaat, and I. I. Smalyukh. Shape-dependent ori-ented trapping and scaffolding of plasmonic nanopar-ticles by topological defects for self-assembly of col-loidal dimers in liquid crystals. Nano Lett., 12(2):955– 963, 2012.
[35] L. C. T. Shoute and D. F. Kelley. Spatial organi-zation of gase quantum dots: organic/semiconductor liquid crystals. J. Phys. Chem. C, 111(28):10233– 10239, 2007.
[36] D. Sun, H.-J. Sue, and N. Miyatake. Optical prop-erties of zno quantum dots in epoxy with controlled dispersion. J. Phys. Chem. C, 112(41):16002–16010, 2008.
[37] J. Thoen, H. Marynissen, and W. Van Dael. Temper-ature dependence of the enthalpy and the heat ca-pacity of the liquid-crystal octylcyanobiphenyl (8cb). Phys. Rev. A, 26:2886–2905, Nov 1982.
[38] S. Tripathy, R. Marty, V. K. Lin, S. L. Teo, E. Ye, A. Arbouet, L. Saviot, C. Girard, M. Y. Han,
and A. Mlayah. Acousto-plasmonic and
surface-enhanced raman scattering properties of coupled
gold nanospheres/nanodisk trimers. Nano Lett.,
11(2):431–437, 2011.
[39] D. Voloschenko, O. P. Pishnyak, S. V. Shiyanovskii, and O. D. Lavrentovich. Effect of director distortions on morphologies of phase separation in liquid crystals. Phys. Rev. E, 65:060701, Jun 2002.
[40] H. Yockell-Leli`evre, D. Gingras, R. Vall´ee, and A. M. Ritcey. Coupling of localized surface plas-mon resonance in self-organized polystyrene-capped
gold nanoparticle films. J. of Phys. Chem. C,
113(51):21293–21302, 2009.
[41] H. Yoshida, Y. Tanaka, K. Kawamoto, H. Kubo, . Tsuda, A. Fujii, S. Kuwabata, H. Kikuchi, and M. Ozaki. Nanoparticle-stabilized cholesteric blue phases. Appl. Phys. Expr., 2:121501, 2009.