HAL Id: hal-01126777
https://hal.uca.fr/hal-01126777
Submitted on 9 Mar 2015
HAL is a multi-disciplinary open access
archive for the deposit and dissemination of
sci-entific research documents, whether they are
pub-lished or not. The documents may come from
teaching and research institutions in France or
abroad, or from public or private research centers.
L’archive ouverte pluridisciplinaire HAL, est
destinée au dépôt et à la diffusion de documents
scientifiques de niveau recherche, publiés ou non,
émanant des établissements d’enseignement et de
recherche français ou étrangers, des laboratoires
publics ou privés.
Experimental and numerical simulation of shear
behavior on sand and tire chips
Daiki Takano, Bastien Chevalier, Jun Otani
To cite this version:
Daiki Takano, Bastien Chevalier, Jun Otani. Experimental and numerical simulation of shear behavior
on sand and tire chips. 14th IACMAG International Conference, Sep 2014, Kyoto, Japan.
�hal-01126777�
Computer Methods and Recent Advances in Geomechanics – Oka, Murakami, Uzuoka & Kimoto (Eds.) © 2015 Taylor & Francis Group, London, ISBN 978-1-138-00148-0
Experimental and numerical simulation of shear behavior on sand and tire
chips
D. Takano
Port and Airport Research Institute, Yokosuka, Japan
B.J. Chevalier
Plytech-Department of Civil Engineering, Blaise Pascal University, France
J. Otani
X-Earth center, Graduate School of Science and Technology, Kumamoto University, Kumamoto Japan
ABSTRACT: One cost effective application of mixed sand with tire chips is to use them behind retaining structures as reducing earth pressure and to use its highly permeable nature of this type of materials as an agent for reducing liquefaction induced deformation. However, the precise mechanical properties of tire chips and mixed sand with tire chips have not been clarified yet. The objective of this paper is to investigate the shear behavior of tire chips and mixed sand with tire chips. First of all, the direct shear test which is one of the typical tests to obtain strength and deformation characteristic of granular materials was conducted for tire chips, sand and mixed sand with tire chips. Using X-ray CT, three dimensional behaviors of the materials were investigated without any destruction. In order to discuss the deformation and strain from the CT images, a full field measurement technique on image analysis called Digital Image Correlation (DIC) was used. Here, the displacement and strain fields were measured in each shear displacement level. These direct shear behaviors were also simulated using 3-D Discrete Element Method (DEM) and compared to the experimental results. Finally, the mechanical properties such as deformation and failure in the materials of tire chips and mixed sand with tire chips were precisely discussed based on all the results.
1 INTRODUCTION
There are a large number of people who have their own car in Japan and as a result, about one million ton of scrap tire has been generated. About 90% of these generated scrap tires are recycled for thermal, material and retreading purposes. A major share of scrap tire recycling goes to the thermal recycling, how-ever, this process generates carbon dioxide (CO2). So with growing concern for sustainable environment, emphasis has been shifting from the thermal recycling to material recycling. This trend has led to the use of a new class of a geomaterials such as tire chips and tire shreds made out of scrap tires. So, atten-tion has been growing on using such tire products as materials in civil engineering as a whole and geotech-nical engineering in particular (Youwai et al., 2003, Bergado, et al., 2005 and Hazarika, et. al, 2009). This emerging new class of geomaterials can be expected to be characterized by lightweight, compressible, per-meable, durable, resilient, and thermally insulating. As far as the applications in geotechnical engineering is concerned, one cost effective application of mixed sand with tire chips is to use them behind retaining
structures for reducing earth pressure and to use its highly permeable nature as an agent for reduc-ing liquefaction induced deformation. However, the mechanical properties of tire chips and mixed sand with tire chips have not been clarified yet. The authors have used X-ray CT scanner for geomaterials to inves-tigate or characterize any kinds of geomaterials (Otani et al., 2000, Otani, et al., 2002, Otani, et. al, 2005 and Otani, et. al, 2006).
The purpose of this paper is to investigate shear behavior of tire chips and mixed sand with tire chips using micro focus X-ray CT. Here, direct shear behav-ior is picked up as a typical shear behavbehav-ior; behavbehav-ior of tire chips and mixed sand with tire chips are mostly concerned. In order to discuss on the deformation and strain from the CT images, one of common techniques on full field measurement called Digital Image Corre-lation (DIC) is used. These direct shear behaviors were also simulated using Discrete Element Method (DEM) to compare with experimental results and to evaluate the contact between particles that cannot be obtained from the experiment. Finally, the characterization of shear behavior of tire chips and mixed sand with tire chips are discussed precisely.
Figure 1. Grain size distributions.
2 OUTLINE OF DIRECT SHEAR TEST 2.1 Test materials and cases
Photo 1 shows tested materials which are tire chips and No.3 silica sand. Moreover, the grain size distribution of materials used in this test is shown in Fig. 1. The properties of both materials are listed as follows: (1) Tire chips: average grain size= 2.0 mm, soil
par-ticle density= 1.15 g/cm3;
(2) Silica sand: average grain size= 2.0 mm, soil particle density= 2.65 g/cm3.
Here, the grain size distribution of both materials is almost equal. Tire chips were made by shredding scrap tires and particle size was set as 2.0mm in average after taking out all the metals and textiles from the scrap tires. Direct shear tests were conducted in this paper and Table 1 shows the test cases. There were four cases: No.3 silica sand for both upper and lower soil shear boxes (CASE1), tire chips for both boxes (CASE2), and two cases of mixed sand with tire chips for both boxes, with mixing rates that percentage of tire chips is 50% and 20% in volume (CASE3 and CASE4), respectively.
2.2 Test procedure
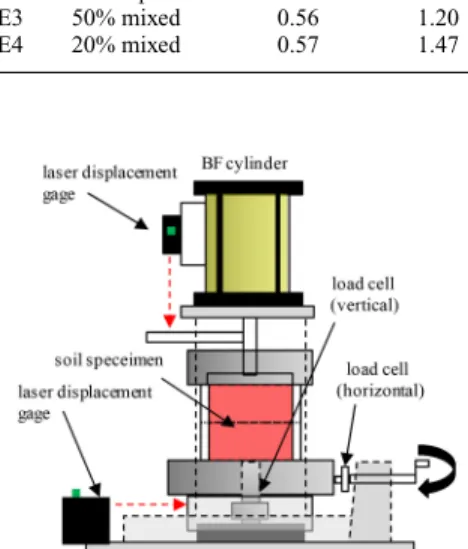
Figure 2 shows the schematic view of direct shear test apparatus used in this study (Takano, 2008). The size of the soil specimen for direct shear test was 40 mm height (20 mm for lower box and 20 mm for the upper
Table 1. Test cases.
dry density CASE materials void ratio (g/cm3)
CASE1 No.3 Silica sand 0.59 1.66 CASE2 tire chips 0.55 0.75
CASE3 50% mixed 0.56 1.20
CASE4 20% mixed 0.57 1.47
Figure 2. Schematic view of the direct shear apparatus.
one) with 80 mm diameter. In this test, after prepar-ing each specimen, the apparatus was mounted on the X-ray CT system and a confining pressure of 100 kPa was applied until the vertical displacement becomes stable. Then the lower box was displaced horizontally with a velocity of 0.6 mm/min until the displacement of 8.0 mm. The upper box is fixed. Photo 2 shows inside of the micro focus X-ray CT scanner. A series of CT scanning for the soil box were conducted respec-tively for the initial state and for shear displacements of 2.5 mm (around the peak for sand), 5.0 mm (post-peak) and 8.0 mm (end of the test). It is noted that the shear displacement was fixed during CT scanning of the soil box. 3D images of the specimens were then analyzed using DIC. The DIC analysis presented in this paper is based on the method proposed by Hall et al. (2006), which can provide the 3D volume of dis-placement vectors between in-situ acquired CT images at different loading stages.
2.3 DEM simulation
The DEM used here is based on the molecular dynamics (Cundall, 1979). This method is used in 3-dimensions with a code called SDEC (Magnier, 1997). In general, spherical and round particles are used in DEM in consideration of the computing time, how-ever it is difficult to reproduce the shear behavior of sand with spherical particle (Katzenbach et al, 2004). In these simulations, non-spherical particles, called clumps, were used for the model of sand and tire chips. A clump particle used in DEM simulations is shown
Photo 2. Inside of micro focus X-ray.
Table 2. Mechanical parameters for DEM simulation. No. 3 Silica sand Tire chips Particle density (g/cm3) 2.65 1.15
Particle shape (angularity) 0.7 0.7
Diameter (mm) 1.95 2.04
Friction angle (deg) 35 10 Normal stiffness (N/mm) 2.24× 10⁹ 1.12× 10⁷
Tangential stiffness (N/mm) 2.24× 10⁸ 1.12× 10⁶
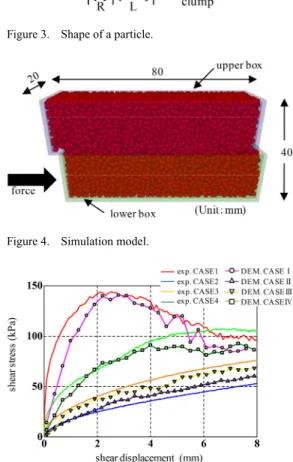
in Fig. 3. Here, the parameter of particle shape, called angularity, is defined as follows:
where L is distance between center of two particles; R is radius of particle. The simulation model of direct shear test is shown in Fig. 4. The width of the shear box used in the numerical modeling is equal to 20mm which is smaller than the actual shear box, in order to limit the number of particles and so as the calculation time. The samples used for DEM simulation were pre-pared by inflating particles without any gravity force or friction in a shear box until the particles contact to the other. Table 2 shows the mechanical parameters in the simulations. The value of angularity and internal friction angle gave a reproduction of the shear behavior consistent with the results of experiments. The shear box was modeled as rigid wall and friction between walls and particles was set as zero. Four cases were followed about the simulation as well as for the exper-iment: case of No.3 Silica sand (CASE I), case of tire chips (CASE II), and two cases of mixed sand with tire chips, with mixing rates of 50% and 20% (CASE III and CASE IV). Here, the relative density in the case of sand was set to approximately 90%, and the void ratio became 0.50. In other cases, it is set to the same void ratio as the case of sand. 100 kPa of confining pressure was applied for all the simulation cases.
Figure 3. Shape of a particle.
Figure 4. Simulation model.
Figure 5. Shear stress-shear displacement relationships.
3 RESULTS AND DISCUSSIONS 3.1 Mechanical responses
Figure 5 shows the results from direct shear tests giving shear stress versus shear displacement obtained from experiment and numerical modeling. For CASE1, there is a peak stress of 140 kPa obtained for shear displacement of 2.5 mm, while the case of tire chips (CASE2) shows monotonic increase in the shear stress without showing any peak. For cases of mixed sand with tire chips (CASE3 and CASE4), the trend of the relationship shear stress-shear displacement is close to that of CASE2. And then, paying attention to the shear behavior obtained with different of tire chip mix-ing rates, it can be confirmed that the shear stress increases as the mixing rate of tire chip decreases. As for these, a similar tendency was also obtained with DEM simulation.
Figure 6 shows the relationship between vertical displacements and shear displacement for both experi-mental and numerical results. For CASE1, the behavior of dilatancy is remarkable.And for the case of tire chips
Figure 6. Vertical displacement-shear displacement rela-tionships.
(CASE2), there is a tendency of contractancy. It can be explained by the compressibility of tire chips. For the cases of 50% mixed sand with tire chips (CASE3), the relationship vertical and shear displacement is close to the CASE2. Compared with this, there is a tendency of expansion after shear displacement of 2.5 mm in case of 20% mixed sand with tire chips (CASE4). So, it can be confirmed the difference of shear behavior due to the change of mixing rates. However, as far as the dilatancy behavior is concerned for the case of sand (CASE1 and CASE I), there are some differences between these two results, so that the modeling of sand
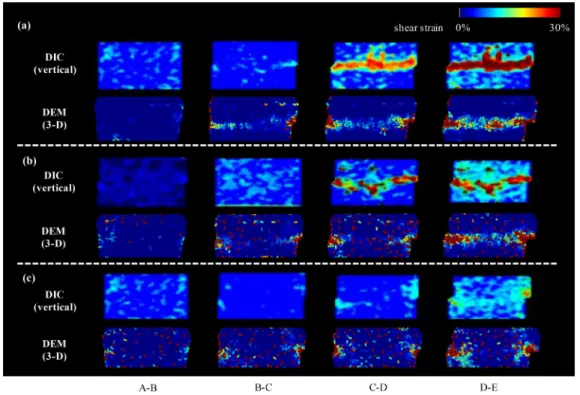
Figure 7. Distribution of shear strain obtained from (a) Case 1 and Case I, (b) Case 4 and Case IV and (c) Case 3 and Case III.
in DEM needs some improvements. Therefore, for the case of mixed sand especially CASE IV, the mate-rial expansion is overestimated in numerical modeling. Besides, for the case of tire chips (CASE2 and CASE II), the experiment result was well reproduced by DEM simulation, and it can be said that elastic bodies such as tire chips can be analyzed in DEM simulations. 3.2 Results from DIC and DEM
Figure 7 shows the distributions of shear strains in the specimens for all the cases, at the displace-ment levels of 0 mm–1.0 mm (A-B), 1.0 mm–2.5 mm (B-C), 2.5 mm–5.0 mm (C-D) and 5.0 mm–8.0 mm (D-E) using the results of displacements by DIC and DEM. This strain was obtained using the change of the shape of each small area in the sample due to shearing. As seen from this figure, the area of high shear strain appears at the edges of the boundary between lower and upper boxes for all the cases at the beginning of shearing. And then, this high shear strain areas propa-gated inside the specimen along this boundary for case of sand (CASE1 and CASE I). For the case of mixed sand with tire chips (CASE3, CASE4, CASE III and CASE IV), the trend of distribution of shear strain is close to the case of tire chips, and no significant differ-ence could be observed between mixing rates of 20% and 50%. Meanwhile, tire chips and mixed sand can-not confirm a clear shearing band like the case of sand. It can be said that tire chips induced a homogenization of the material so that localization is not observed in these cases. Based on these results, it can be concluded
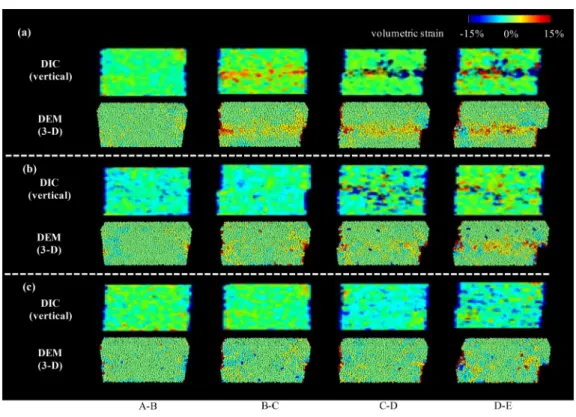
Figure 8. Distribution of volumetric strain obtained from (a) Case 1 and Case I, (b) Case 4 and Case IV and (c) Case 3 and Case III.
Figure 9. Distribution of contact force obtained from (a) Case 1 and Case I, (b) Case 4 and Case IV and (c) Case 3 and Case III.
that the tire chips can reduce the propagation of shear stain which could be considered to be local shear band, so that tire chip could have a potential property for reducing soil failure.
Figure 8 shows the distribution of volumetric strains in the specimens for all the cases. The distribution of volumetric strains shows that the volume expansion and compression can respectively be confirmed for the cases of sand (CASE1 and CASE I). For the case of 50% mixed sand with tire chips (CASE3 and CASE III), there is a tendency to compress as for the case of
tire chips only. However, for the case of 20% mixed sand with tire chips (CASE4 and CASE IV), the ten-dency of expansion at the displacement of 8.0mm was confirmed. This trend is also shown in Fig.6, it can be considered that the volume expansion and compres-sion have happened with same level for the case of 20% mixed sand with tire chips.
Figure 9 shows relative contact force distributions at the displacement levels of 2.5 mm, 5.0 mm and 8.0 mm from DEM simulations. The color ranges from blue to red depending on the value of relative contact force.
The case of initial condition was also shown in this fig-ure. For CASE I and CASE IV, relative contact force distribution acting between particles is not uniform, and corresponds to the reticulation of the sample at the initial state. Then, the particle with high contact force develops along the shearing from bottom left to top right. However, this tendency decreased as the volume of tire chips increased. Moreover, neither the distorted distribution of shear strain nor the distribu-tion of contact force is similar. So, it is necessary to study for relation of these results particularly.
4 CONCLUSIONS
A series of direct shear tests were conducted for not only tire chips but also sand. X-ray CT scanning was conducted to investigate the material behavior in the shear box. Moreover, results of X-ray CT and DEM simulations were compared for sand, tire chips and mixed sand with tire chips. As a result, it can be con-firmed that the results of X-ray CT is close to the results of DEM.
Following findings were drawn from this study: (1) Shear stress of the tire chips and mixed sand
with tire chips under direct shearing are small and increased monotonically compared with that of sand; there is no peak stress observed for the samples containing tire chips;
(2) There is a less dilatancy effect with the tire chips and mixed sand with tire chips compared to sand, so that it may be effective for the use of backfill materials;
(3) The tire chips can reduce the propagation of shear strain which could be considered to be local shear bands, so that tire chip could have a potential property for reducing soil failure;
(4) The particle with high contact force develops along the shearing from top right to bottom left, this ten-dency has decreased as the tire chip mixing rate increases; and
(5) Finally, precise behavior was investigated using X-ray CT and DEM simulation
As for the future, the relation between the contact force distribution and the shear distribution is being examined in details.
REFERENCES
Bergado, D., Youwai, S. and Rittirong, A. 2005.
Géotech-nique, Vol.55, No.8, pp.603–606.
Cundall P. A. and Strack O. D. L. 1979. A discrete numer-ical model for granular assemblies, Geotechnic 29 (1), pp.47–65.
Hall, S.A. 2006. A methodology for 7D warping and deformation monitoring using time-lapse seismic data.
Geophysics, 71 (4): O21–O31.
Hazarika, H., Yasuhara, K. and Hyodo. 2009. M.: SUS-TAINABLE MATERIAL RECYCLING OF SCRAP TIRES∼FEW INNOVATIVE APPLICATIONS IN JAPAN∼, International Joint Symposium on Geodisas-ter Prevention and Geoenvironment in Asia, JS-Fukuoka
2009, pp.179–184.
Katzenbach, R. and Schmitt, A. 2004. Micromechanical modeling of granular materials under triaxial and oedo-metric loading, Numerical modeling in Micromechanics
via Particle Methods, pp.313–322.
Magnier S.A. and Donze F. V. 1997. Discrete Element Project, Un-iversité du Québec-Montréal.
Otani, J. Mukunoki, T., Obara, Y. 2000. Application of X-ray CT method for characterization of failure in soils, Soils
and Foundations, Vol.40, No.2, pp.111–118.
Otani, J., Mukunoki, T., Kikuchi, Y. 2002. Visualization for engineering property of in-situ light weight soils with air foams, Soils and Foundations, Vol.42, No.3, pp.93–105. Otani, J., Mukunoki, T., Sugawara, K. 2005. Evaluation of
particle crushing in soils using X-ray CT data, Soils and
Foundations, Vol.45, No.1, pp.99–108.
Otani, J., Pham, K.D., Sano, J. 2006. Investigation of failure in sand due to laterally loaded pile using X-ray CT, Soils
and Foundations, Vol.46, No.4, pp.529–535.
Takano, D. 2008. The study on Design and Construction of Tunneling – Application of X-ray CT-, Doctor Thesis Youwai, S. and Bergado, D. T. 2003. Strength and deformation
characteristics of rubber shredded tire – sand mixtures.