C E N T R E D'E T U D E S E T D E R E C H E R C H E S S U R L E D E V E L O P P E M E N T I N T E R N A T I O N A L
SERIE ETUDES ET DOCUMENTS DU CERDI
Immigration, growth and unemployment:
Panel VAR evidence from OECD countries
Ekrame BOUBTANE, Dramane COULIBALY, Christophe RAULT
Etudes et Documents
n° 04
January 2013
CERDI
65 BD. F. MITTERRAND
63000 CLERMONT FERRAND – FRANCE
TÉL. 0473717400
FAX 0473177428
Etudes et Documents n° 04, CERDI, 2013
The authors
Ekrame BOUBTANE
Associate Professor, Clermont Université, Université d'Auvergne, CNRS, UMR 6587, CERDI, 63009 Clermont Ferrand
Email: Ekrame.BOUBTANE@udamail.fr
Dramane COULIBALY
Associate Professor, University of Paris Ouest, EconomiX-CNRS, Email: dcoulibaly@u-paris10.fr
Christophe RAULT
Professor, University of Orléans, Leo-CNRS Email : chrault@hotmail.com
La série des Etudes et Documents du CERDI est consultable sur le site :
http://www.cerdi.org/ed
Directeur de la publication : Patrick Plane
Directeur de la rédaction : Catherine Araujo Bonjean Responsable d’édition : Annie Cohade
ISSN : 2114 - 7957
Avertissement :
Les commentaires et analyses développés n’engagent que leurs auteurs qui restent seuls responsables des erreurs et insuffisances.
Etudes et Documents n° 04, CERDI, 2013
Abstract
This paper examines empirically the interaction between immigration and host country economic conditions. We employ a panel VAR techniques to use a large annual dataset on 22 OECD countries over the period 1987-2009. The VAR approach allows to addresses the endogeneity problem by allowing the endogenous interaction between the variables in the system. Our results provide evidence of migration contribution to host economic prosperity (positive impact on GDP per capita and negative impact on aggregate unemployment, native- and foreign-born unemployment rates). We also find that migration is influenced by host economic conditions (migration responds positively to host GDP per capita and negatively to host total unemployment rate).
Mots clés / Key Words: Immigration, growth, unemployment, panel VAR Codes JEL / JEL classification: E20, F22, J61
Acknowledgements / Remerciements
We are very grateful to two anonymous referees for their useful comments and suggestions. We are also grateful to the participants of INFER Workshops (in Orleans) on Regional Competitiveness and International Factors Movements for very helpful comments and suggestions on a previous version of this paper. Usual disclaimer applies.
Immigration, growth and unemployment:
Panel VAR evidence from OECD countries
∗
Ekrame Boubtane
CERDI-University of Auvergne
CES-University of Paris 1
Dramane Coulibaly
EconomiX-CNRS, University of Paris Ouest
Christophe Rault
LEO - University of Orl´
eans
Toulouse Business School, France
Abstract
This paper examines empirically the interaction between immigra-tion and host country economic condiimmigra-tions. We employ a panel VAR techniques to use a large annual dataset on 22 OECD countries over the period 1987-2009. The VAR approach allows to addresses the endogeneity problem by allowing the endogenous interaction between the variables in the system. Our results provide evidence of migration contribution to host economic prosperity (positive impact on GDP per capita and negative impact on aggregate unemployment, native-and foreign-born unemployment rates). We also find that migration is influenced by host economic conditions (migration responds positively to host GDP per capita and negatively to host total unemployment rate).
Keywords: Immigration, growth, unemployment, panel VAR. JEL classification: E20, F22, J61.
∗We are very grateful to two anonymous referees for their useful comments and
sug-gestions. We are also grateful to the participants of INFER Workshops (in Orleans) on Regional Competitiveness and International Factors Movements for very helpful comments and suggestions on a previous version of this paper. Usual disclaimer applies.
1
Introduction
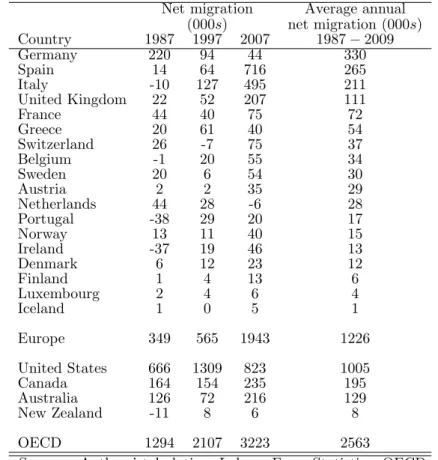
International labour migration to OECD countries has increased significantly over past decades. Net migration, - the number of migrants arriving in OECD countries minus those leaving, - reached almost three million migrants on average over the period 1987 to 2009 (see Table A-1 and Figure A-1). With aging populations and the decline in the percentage of young people in the labour force, more labour migration will be needed in the future in many OECD countries. Immigration helps to expand the working age population, and is its principal source of growth in Europe (OECD, 2006). Immigration therefore contributes to the stabilization of the working age population and attenuates the consequences of the aging of populations (Blanchet, 2002; Chojnicki, 2005).
At the same time, the increasing share of migrants in the labour force raises concerns about the impact of international immigration on economic conditions in the host countries.
The theoretical studies on the effects of immigration on unemployment do not establish unanimous results. Harris and Todaro (1970) employs a two-sector model of migration and unemployment to describe the possible nega-tive effects of immigration on nanega-tive-born unemployment. However, Ortega (2000) provides a theoretical rationale for the positive effects of immigra-tion on the native-born unemployment rate. Generally, the empirical studies on the impact of immigration on labour market in host countries conclude that migration flows do not reduce the labour market prospects of natives. This is the case for the empirical studies based on the spatial correlation approach (Simon et al. (1993) for USA; Pischke and Velling (1997) for Ger-many; Dustmann et al. (2005) for U.K.). Contrary to the studies mentioned above, which were conducted at the country level, Angrist and Kugler (2003) use a panel of 18 European countries from 1983 to 1999 and find a slightly negative impact of immigrants on native-born labour market employment. Jean and Jimenez (2007) evaluate the unemployment impact of immigration (and its link with product and labour market policies) in 18 OECD countries over the period 1984 to 2003, and they do not find any permanent effect of immigration.
Some theoretical studies examine the impact of immigrants on growth and conclude that the effects of migration on economic growth depend on the skill composition of the immigrants (Dolado et al., 1994; Barro and Sala-i-Martin, 1995. The more that More migrants are educated, the more immigration has a positive effect on the economic growth in the host country. Estimating an augmented Solow model on data from OECD economies during the pe-riod 1960 to 1985, Dolado et al. (1994) find that because of their human
capital content, migration inflows have less than half the negative impact of comparable natural population increases. Ortega and Peri (2009) estimate a pseudo-gravity model on 14 OECD countries over the period 1980 to 2005 and find that immigration does not affect income per capita.
Since economic conditions in the destination countries can affect migra-tion, some empirical papers address this endogeneity problem using Instru-mental Variables. Generally empirical studies which use the spatial correla-tion approach exploit previous informacorrela-tion concerning immigrant settlement as an instrumental variable (Card, 2007). An alternative approach is to use
natural experiments in order to avoid the endogeneity problem. Migration
flows may be attributable to political rather than economic factors (Card, 1990 for the Mariel Boatlift, and Hunt (1992) for the repatriation of
Pieds-Noirs from Algeria into France). A further approach is to use time-series
analysis in order to address the endogeneity interaction between immigration and host country economic conditions. Several studies examine the causal link between immigration and unemployment (Pope and Withers (1985) for Australia; Marr and Siklos (1994) and Islam (2007) for Canada). These studies find no evidence of migration causing higher average rates of unem-ployment, but find evidence that host country unemployment has a negative impact on immigration. In this line, Morley (2006) examines the causal link between migration and per capita GDP, and finds evidence of a long-run causality running from per capita GDP to immigration using data for Aus-tralia, Canada and USA. These results are in line with the findings of studies on the determinants of migration flows (Gross and Schmitt, 2012; Bertoli and Fern´andez-Huertas, 2011; Mayda, 2010).
This paper is related to the extensive literature on the economic impact of immigration in host countries. Specifically, this paper is in line with previ-ously cited studies on the endogenous interaction between immigration and host country economic conditions. All these analyses are based on an individ-ual country framework. Our paper contributes to this existing literature on the endogenous interaction between immigration and host country economic conditions by using a panel vector autoregression (panel VAR) approach. The panel VAR approach allows us to use a large annual dataset for 22 OECD countries over the period 1987 to 2009. The VAR approach addresses the endogeneity problem by allowing for the endogenous interaction between the variables in the system. In other words, the VAR approach takes into account the fact that migration can have an impact on the economy of a host country; at the same time, migration can be influenced by host country economic conditions. Our study is similar to a recent work by Damette and Fromentin (2013) which examine the interaction between immigration and host country labour market (wages and unemployment) for 14 OECD
coun-tries using panel methodology. Our study is relatively close to the work by Barcellos (2010) that employs a panel VAR methodology on US states to ex-amine the interaction between immigration and wages. Contrary to Damette and Fromentin (2013) and Barcellos (2010), we estimate a 3-variable VAR which includes immigration rate, host country GDP per capita, and variables for employment opportunities in the host country (total unemployment, to-tal employment, native-born unemployment or foreign-born unemployment rates). We use GDP per capita to examine whether migration can contribute to economic growth in the host country. Moreover, we use different measures of employment opportunities in the host country. First, we use total unem-ployment rate to examine the interaction between migration and unemploy-ment. Second, we use total employment rate instead of total unemployment rate, to control for the influence of immigrants on participation. Third, the native-born unemployment rate is used to examine the main concern in the host countries, which is the worry about the potential adverse impact of immigration on employment opportunities of native-born residents. Finally, we consider the foreign-born unemployment rate to examine the response of migration to the unemployment rate of foreign-born persons (foreign-born persons can decide to migrate to a country or leave it if their employment opportunities are bad)1.
Our results show evidence of a bidirectional relationship between immi-gration flows and host country economic conditions. More precisely, we find a positive bidirectional relationship between immigration and host country GDP per capita, and a negative bidirectional relationship between immigra-tion and host country total unemployment rate. Therefore, migraimmigra-tion inflows contribute to host country economic prosperity (positive impact on GDP per capita and negative impact on total unemployment rate). This may reflect the high skill levels of migrants in recent decades. As mentioned above, the more migrants are educated, the more immigration has a positive effect on economic growth in the host country. We also find a positive impact of migration on host country total employment rate, indicating that the nega-tive impact of migration on total unemployment rate is not due to the fact that migration discourages job seekers. Moreover, like total unemployment, immigration negatively influences both native- and foreign-born unemploy-ment rates. However, contrary to total unemployunemploy-ment rate, migration does not respond to native- and foreign-born unemployment rates. Therefore, our results show that the main concern in host countries about the adverse im-pact of immigration on employment opportunities of native-born persons is not confirmed. Further, our results indicate that foreign-born persons decide
to migrate to a country or leave it because of bad employment opportunities at the aggregate level.
The remainder of the paper is organized as follows. Section 2 presents the econometric methodology. Section 3 describes the data used in the empirical investigation. Section 4 describes the empirical results and their interpreta-tion. Finally, Section 5 concludes.
2
Econometric methodology
We use panel VAR techniques to estimate the impulse response functions. The econometric model takes the following reduced form:
Xit = Γ(L)Xit+ ui+ ϵit (1) where Xit is a vector of stationary variables, Γ(L) is a matrix polynomial in the lag operator with Γ(L) = Γ1L1 + Γ2L2 + . . . + ΓpLp, ui is a vector of country specific effects and ϵit is a vector of idiosyncratic errors.
As it is now well known that, in a dynamic panel, the fixed-effects es-timator is not consistent because fixed effects are correlated with the re-gressors due to lags of the dependent variables, we use forward mean dif-ferencing or orthogonal deviations (the Helmert procedure), following Love and Zicchino (2006). In this procedure, to remove the fixed effects, all vari-ables in the model are transformed in deviations from forward means. Let ¯
xmit =∑Ti
s=t+1x m
is/(Ti− t) denotes the means obtained from the future values of xm
it, a variable in the vector Xit = (x1it, xit2, . . . , xMit)′, where Ti denotes the last period of data available for a given country series . Let ¯ϵm
it denotes the same transformation of ϵmit, where ϵit = (ϵ1it, ϵ2it, . . . , ϵMit)′. Hence we get transformed variables: ˜ xmit = δit(xmit − ¯xmit) (2) and ˜ ϵmit = δit(ϵmit − ¯ϵ m it) (3) where δit= √
(Ti− t)/(Ti− t + 1). For the last year of data this transforma-tion cannot be calculated, since there are no future values for the constructransforma-tion of the forward means. The final transformed model is thus given by:
˜
where ˜Xit= (˜x1it, ˜x2it, . . . , ˜xMit)′ and ˜ϵit= (˜ϵ1it, ˜ϵ2it, . . . , ˜ϵMit )′
The first-difference procedure has the weakness of magnifying gaps in unbalanced panels (as in our case). The forward means differencing is an alternative to the first-difference procedure and has the virtue of preserving sample size in panels with gaps (Roodman, 2009). This transformation is an orthogonal deviation, in which each observation is expressed as a deviation from average future observations. Each observation is weighted so as to standardize the variance. If the original errors are not autocorrelated and are characterized by a constant variance, the transformed errors should exhibit similar properties. Thus, this transformation preserves homoscedasticity and does not induce serial correlation (Arellano and Bover, 1995). Additionally, this technique allows use of the lagged values of regressors as instruments, and estimates the coefficients by the generalized method of moment (GMM). In order to investigate the interaction between immigration, unemploy-ment and economic activity, we estimate a first system of stationary variables:
M odel 1 : Xit = (∆Mit, ∆Yit, ∆Uit)
where M is the net migration rate in logarithms, Y is GDP per working age population in logarithms and U is unemployment rate in logarithms, ∆ is the first difference operator.
For robustness analysis, in a second model we replace unemployment by employment in the system to control for the influence of immigrants on participation in the host country labour force1. The arrival of immigrants
discourages job seekers and prompts them to leave the labour force. As result, unemployment decreases while employment may be constant. This second model is given by the following system:
M odel 2 Xit= (∆Mit, ∆Yit, ∆Eit)
where E denotes employment rate (in logarithms).
Overall changes in aggregate unemployment and employment can hide important differences between native-and foreign-born. As noted above, the main concern in the host countries is about the link between migration flows and employment opportunities of native-born residents. Therefore, we also consider the following model:
M odel 3 : Xit = (∆Mit, ∆Yit, ∆N BUit)
where N BU denotes the unemployment rate of native-born residents (in logarithms).
Since foreign-born persons can decide to migrate to a country or leave it because of a high unemployment rate of foreign-born persons, we finally con-sider a model which examines the interaction between migration and foreign-born unemployment1:
M odel 4 : Xit = (∆Mit, ∆Yit, ∆F BUit)
where F BU denotes unemployment rate of foreign-born persons (in log-arithms).
Once all the coefficients of the panel VAR are estimated, we compute the impulse response functions (IRFs) and the variance decompositions (VDCs).2
Impulse response functions describe the response of an endogenous variable over time to a shock in another variable in the system. Variance decomposi-tions measure the contribudecomposi-tions of each source of shock to the (forecast error) variance of each endogenous variable, at a given forecast horizon. We apply bootstrap methods to construct the confidence intervals of the IRFs.
In order to compute the IRFs we use the Cholesky decomposition. The assumption behind the Cholesky decomposition is that series listed earlier in the VAR order impact the other variables contemporaneously, while se-ries listed later in the VAR order impact those listed earlier only with lag. Consequently, variables listed earlier in the VAR order are considered to be more exogenous. It is obvious that the decision to migrate is based on the past value of host country economic conditions (as noted in studies based on a spatial correlation approach (Pischke and Velling, 1997; Card, 2007). In other words, migrant working in host country at time t has decided to migrate before time t. This is particularly true for our measure of migration. In fact, we use a measure of net migration from OECD which includes only perma-nent and long-term movements (see Subsection 3.1). Permaperma-nent migration and long-term decisions are generally decided early. So, it is natural to place immigration variables first in the VAR ordering since immigration inflows can contemporaneously impact the host country economy, while changes in host economic conditions will impact immigration only with a lag. GDP per capita is placed second in the ordering and unemployment (or employment) rate is placed last. Hence, the VAR ordering in the different models are :
M odel 1 : (∆Mit, ∆Yit, ∆Uit)
M odel 2 : (∆Mit, ∆Yit, ∆Eit)
M odel 3 : (∆Mit, ∆Yit, ∆N BUit)
2The panel VAR is estimated by using the package provided by Inessa Love. This package is used in Love and Zicchino (2006).
M odel 4 : (∆Mit, ∆Yit, ∆F BUit)
Changing this ordering does not significantly impact on the main results of our study (see Appendix).
3
Data and Econometric investigation
3.1
Data
We use annual data over the period 1987-2009 for 22 OECD countries which are the major host countries3. All variables are taken from OECD Databases.
To characterize immigration, we use net migration rate measured as total an-nual arrivals less total anan-nual departures (net migration), divided by total population. We use net migration data from the OECD Population and Vital Statistics Dataset, this choice is motivated by several reasons. First, net migration data present less problems of comparability compared to the available data on inflows and outflows. Since the comparability problem is generally caused by short-term movements, as argued by the OECD, using net migration tends to eliminate those movements which are the main source of non-comparability. Second, compared to the available data for inflows and outflows, net migration data provide better coverage for the 22 OECD countries in our sample.
It should be noted that net migration data consider all immigrants including OECD immigrants and do not make a distinction between nationals and for-eigners. Further, only permanent and long-term movements are considered. Entries of persons admitted on a temporary basis are not included in the statistics4.
To assess economic conditions in host countries, we use real GDP (expressed in 2000 Purchasing Power Parities) per head of total working age population as a measure of economic activity. Real GDP data are from OECD Annual National Accounts. Data on unemployment and employment rates are from OECD Annual Labour Force Statistics. Data on native- and foreign-born unemployment rates, which are more difficult to compile, are from statisti-cal tables’ published in the annual OECD Continuous Reporting System on Migration (known by its French acronym SOPEMI) reports. Due to data availability (notably for native-and foreign-born unemployment rates), our 3The sample includes: Australia, Austria, Belgium, Canada, Denmark, Finland, France, Germany, Greece, Ireland, Iceland, Italy, Luxembourg, Netherlands, New Zealand, Norway, Spain, Sweden, Switzerland, Portugal, United Kingdom and United States.
4Unauthorized migrants are not taken into account at the time of arrival. They may be included when they are regularized and obtain a long-term status in the country.
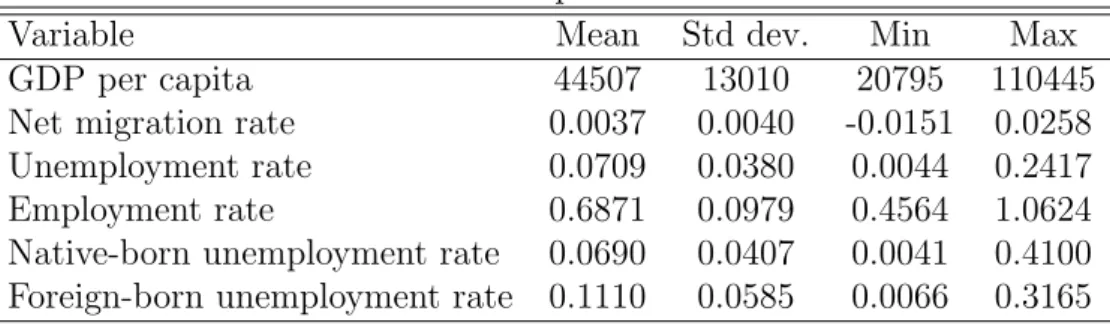
sample covers the period 1987-2009. Figure A-1 in the Appendix reports the evolution of net migration rates in selected OECD countries over the period 1987-2007. This figure shows that net migration rate is heterogeneous among countries (very small for some countries like Denmark, France, Germany, the Netherlands, or Switzerland), but it changes over time for all countries in our sample. Table 1 reports the summary statistics for the variables.
Table 1: Descriptive Statistics
Variable Mean Std dev. Min Max
GDP per capita 44507 13010 20795 110445
Net migration rate 0.0037 0.0040 -0.0151 0.0258 Unemployment rate 0.0709 0.0380 0.0044 0.2417 Employment rate 0.6871 0.0979 0.4564 1.0624 Native-born unemployment rate 0.0690 0.0407 0.0041 0.4100 Foreign-born unemployment rate 0.1110 0.0585 0.0066 0.3165
3.2
Panel unit root test and cointegration analysis
The first step of the analysis is to look at the data properties. Two classes of tests allow the investigation of the presence of a unit root: the first genera-tion panel unit-root tests (including Hadri (2000) and Im et al. (2003)), were developed on the assumption of cross-sectional independence among panel units (except for common time effects), and may be at odds with economic theory and empirical results. On the other hand, second generation tests (see for instance, Smith et al. (2004); and Pesaran (2007)) relax the assumption of cross-sectional independence, allowing for a variety of dependence across the different units. To test for the presence of such cross-sectional dependence in our data, we implemented the simple test of Pesaran (2004) and computed the cross-section Dependence (CD) statistic. This test is based on the aver-age of pair-wise correlation coefficients of the ordinary-least-squares (OLS) residuals obtained from standard augmented Dickey-Fuller (ADF) regres-sions for each individual. Its null hypothesis is cross-sectional independence and is asymptotically distributed as a two-tailed standard normal distribu-tion. The results (available upon request) indicate that the null hypothesis is always rejected, regardless of the number of lags included in the ADF auxiliary regression (up to five lags), at the 5% level of significance. This confirms that OECD nations are, as expected, cross-sectionally correlated, which may reflect the presence of similar regulations in various fields such as macroeconomic policies, trade, legislation, business administration, and
increasing financial and economic cooperation.
To determine the degree of integration of our series of interest in our panel of 22 OECD countries, we carry out two second-generation panel unit root tests.
The first second generation unit root test that we use is the test by Pesaran (2007) who suggests a simple way of getting rid of cross-sectional dependence that does not require the estimation of factor loading. His method is based on augmenting the usual ADF regression with the lagged cross-sectional mean and its first difference to capture the cross-sectional dependence that arises through a single-factor model. The resulting individual ADF test statistics (CADF), or the rejection probabilities, can then be used to develop modified versions of the t-bar test proposed by Im et al. (2003), such as the cross-sectionally augmented IPS (CIP S = N−1∑Ni=1CADFi) , or a truncated version of the CIPS statistic (CIPS*) where the individual CADF statistics are suitably truncated to avoid undue influences of extreme outcomes, or the inverse normal test (or the Z test) suggested by Choi (2001) which combines the p-values of the individual tests (CZ). Critical values reported in Pesaran (2007) are provided through Monte Carlo simulations for a specific specifica-tion of the deterministic component, and depend both on the cross-secspecifica-tional and time series dimensions. The null hypothesis of all tests is the unit root. The second set of unit root tests of the second generation are the bootstrap tests of Smith et al. (2004), which use a sieve sampling scheme to account for both the time series and cross-sectional dependencies of the data through bootstrap blocks. The specific tests that we consider are denoted ¯t, LM , max and min. ¯t is the bootstrap version of the well known panel unit root
test of Im et al. (2003), LM = N−1∑Ni=1LMi is a mean of the individ-ual Lagrange Multiplier (LMi) test statistics, originally introduced by Solo (1984), max is the test of Leybourne (1995), and min = N−1∑Ni=1mini is a (more powerful) variant of the individual Lagrange Multiplier (LMi), with
mini = min(LMf i, LMri), where LMf i and LMri are based on forward and backward regressions (see Smith et al. (2004) for further details)5. We use bootstrap blocks of m = 20. All four tests are constructed with a unit root under the null hypothesis and heterogeneous autoregressive roots under the alternative, which means that a rejection should be taken as evidence in favor of stationarity for at least one country.
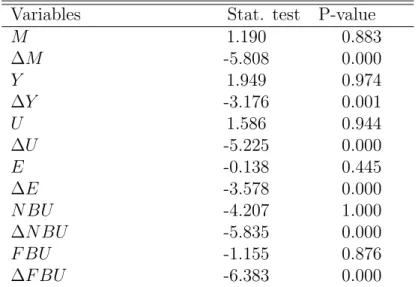
Table 2 reports the results of the first second generation unit root test of Pesaran (2007) for the variables in the system. At conventional levels of significance, the results show that all variables are not stationary in levels,
Table 2: CADF panel unit root test Variables Stat. test P-value
M 1.190 0.883 ∆M -5.808 0.000 Y 1.949 0.974 ∆Y -3.176 0.001 U 1.586 0.944 ∆U -5.225 0.000 E -0.138 0.445 ∆E -3.578 0.000 N BU -4.207 1.000 ∆N BU -5.835 0.000 F BU -1.155 0.876 ∆F BU -6.383 0.000
The statistic test is the Cross-sectionally Augmented Dickey-Fuller(CADF) of Pesaran (2007). The test has the null hy-pothesis of presence of a unit root. For variables in level 2 lags are introduced to allow for serial correlation in the errors. For variables in first difference 1 lag is introduced.
but stationary in first-difference.
Similar results in Table 3, suggest that for all the series the unit root null cannot be rejected at any conventional significance level by the four boot-strap tests of Smith et al. (2004)6.
Therefore, in our panel of 22 OECD countries, we conclude that the variables are non-stationary in level but stationary in first-diffence.7
6The order of the sieve is allowed to increase with the number of time series observations at the rate T1/3, while the lag length of the individual unit root test regressions are determined using the Campbell and Perron procedure (see Campbell and Perron (1991)). 7The lag order in the individual ADF-type regressions is selected for each series using the Akaike information criterion (AIC) model selection criterion. Another crucial issue is the selection of the order of the deterministic component. In particular, since the cross-sectional dimension is rather large here, it may seem restrictive not to allow at least some of the units to be trending, suggesting that the model should be fitted with both a constant and a trend. However, since the trending turned out not to be very pronounced, we considered that a constant is enough in our analysis. In fact, the results of the bootstrap tests of Smith et al. (2004) are not very sensitive to the inclusion of a trend in addition to a constant in the estimated equation (see Statistic b in Table 3). We have also checked using the bootstrap tests of Smith et al. (2004) that the first difference of the series are stationary; hence, confirming that the series expressed in level are integrated of order one.
Table 3: Bootstrap panel unit root test1
Net migration rate(M)
Test Statistic(a)2 Bootstrap P-value Statistic(b)2 Bootstrap P-value ¯ t -1.684 0.374 -2.366 0.202 LM 2.641 0.742 5.466 0.210 max -0.358 0.798 -1.97 0.114 min 1.412 0.684 4.609 0.124 GDP per capita (Y)
Test Statistic(a)2 Bootstrap P-value Statistic(b)2 Bootstrap P-value
¯ t -1.530 0.453 -1.595 0.867 LM 2.740 0.617 3.710 0.839 max -0.364 0.830 -1.419 0.634 min 1.278 0.781 3.128 0.594 Unemployment rate (U)
Test Statistic(a)2 Bootstrap P-value Statistic(b)2 Bootstrap P-value ¯ t -2.268 0.152 -2.657 0.130 LM 3.091 0.412 5.785 0.174 max -1.012 0.254 -2.011 0.184 min 2.640 0.142 3.464 0.401 Employment rate (E)
Test Statistic(a)2 Bootstrap P-value Statistic(b)2 Bootstrap P-value
¯
t -1.834 0.184 -2.546 0.128
LM 4.141 0.114 6.253 0.108
max -1.501 0.171 -2.145 0.121
min 1.937 0.415 3.968 254
Native-born unemployment rate (N BU)
Test Statistic(a)2 Bootstrap P-value Statistic(b)2 Bootstrap P-value ¯
t -2.368 0.134 -2.582 0.119
LM 4.224 0.104 6.239 0.111
max -1.409 0.187 -2.222 0.117
min 1.842 0.401 4.082 0.251
Foreign-born unemployment rate (F BU)
Test Statistic(a)2 Bootstrap P-value Statistic(b)2 Bootstrap P-value ¯
t -2.170 0.145 -2.440 0.144
LM 3.668 0.214 5.928 0.112
max -1.532 0.164 -1.972 0.165
min 2.357 0.214 4.193 0.164
1 Test based on Smith et al. (2004) with rejection of the null hypothesis indicating stationarity in at least one country. All tests are based on 1.000 bootstrap replications to compute the p-values.
2Statistic (a) = model includes a constant; Statistic (b) = model includes both a constant and a time trend.
Table 4: Panel cointegration tests Model 1: (M, Y, U )
Statistic Value P-value Gτ -1.545 0.232
Gα -3.130 0.990
Pτ -7.721 0.106
Pα -3.624 0.141
Model 2: (M, Y, E) Statistic Value P-value Gτ -1.624 0.139
Gα -3.782 0.960
Pτ -6.970 0.026
Pα -4.772 0.150
Model 3: (M, Y, N BU ) Statistic Value P-value Gτ -1.389 0.487
Gα -3.115 0.990
Pτ -7.959 0.203
Pα -3.878 0.191
Model 4: (M, Y, F BU ) Statistic Value P-value Gτ -1.606 0.157
Gα -4.080 0.933
Pτ -8.351 0.218
Pα -4.756 0.150
P-values are robust critical values obtained through bootstrap-ping with 1000 replications.
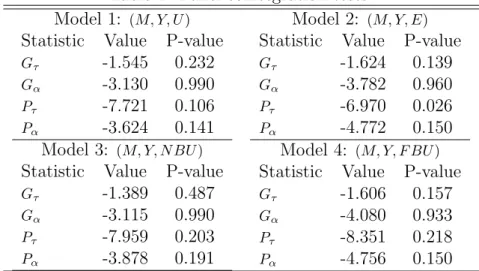
Table 4 reports the results of the cointegration tests, these are error cor-rection based panel cointegration tests developed by Westerlund (2007). The underlying idea is to test for the absence of cointegration by determining whether error correction exists for individual panel members or for the panel as a whole. These tests are flexible to allow an almost completely heteroge-neous specification of both the long and short run parts of the error correction model, where the latter can be determined from the data. Moreover, these tests can take into account cross-section interdependence through bootstrap-ping. The null hypothesis of these tests is the absence of cointegration. The
Gαand Gτ statistics test whether cointegration exists for at least one individ-ual. The Pα and Pτ statistics pool information over all the individual series to test whether cointegration exists for the panel as a whole. To take into ac-count cross-section interdependence the robust p-value is computed through bootstrapping with 1000 replications. As shown by the robust p-value, for all models considered, the null hypothesis of no cointegration cannot be rejected by all the four tests.
Therefore, the empirical properties of the variables examined require es-timation of the VAR in first differences, since no cointegration relationships exist between the (non stationary) variables (in level).
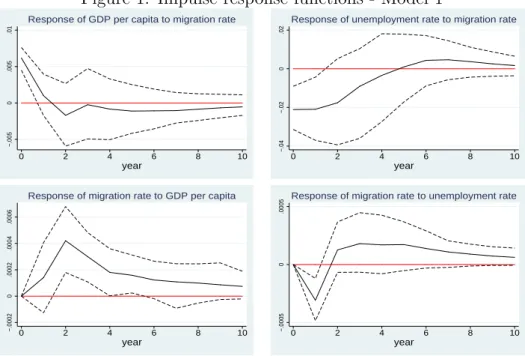
Figure 1: Impulse response functions - Model 1 −.005 0 .005 .01 0 2 4 6 8 10 year
Response of GDP per capita to migration rate
−.04 −.02 0 .02 0 2 4 6 8 10 year
Response of unemployment rate to migration rate
−.0002 0 .0002 .0004 .0006 0 2 4 6 8 10 year
Response of migration rate to GDP per capita
−.0005
0
.0005
0 2 4 6 8 10
year
Response of migration rate to unemployment rate
Note: The solid line shows the impulse responses. The dashed lines indi-cate five standard error confidence band around the estimate. Errors are generated by Monte-Carlo with 1000 repetitions.
4
Empirical results
This section presents the impulse response functions and the variance decom-position from the panel VAR. The correct lag length selection is essential for panel VAR, having lags which are too short fails to capture the system’s dynamics, leading to omitted variable bias; having too many lags causes a loss of degrees of freedom, resulting in over-parameterization. Based on the Lagrangian Multiplier (LM) test for residual autocorrelation, we use three lags for each model.
Figures 1 and 2 display the impulse responses functions of Model 1 and Model 2, respectively.
The impulse response functions in Figure 1 show that GDP per capita growth of host country responds positively and significantly to migration in-flows, while total unemployment rate of host country responds negatively and significantly to migration inflows. Figure 1 also shows that migration inflows respond positively and significantly to GDP per capita growth and nega-tively and significantly to total unemployment rate of host country. Firstly, our results indicate that the economic impact of immigration may be posi-tive in OECD countries. Theses results are in line with some previous
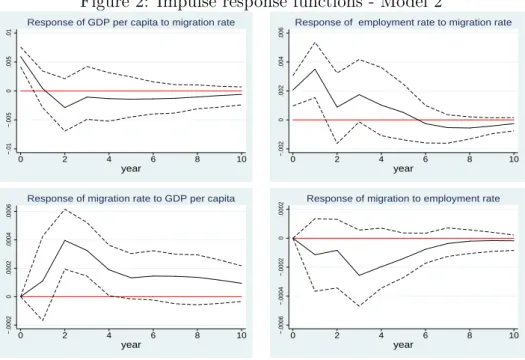
stud-Figure 2: Impulse response functions - Model 2 −.01 −.005 0 .005 .01 0 2 4 6 8 10 year
Response of GDP per capita to migration rate
−.002 0 .002 .004 .006 0 2 4 6 8 10 year
Response of employment rate to migration rate
−.0002 0 .0002 .0004 .0006 0 2 4 6 8 10 year
Response of migration rate to GDP per capita
−.0006 −.0004 −.0002 0 .0002 0 2 4 6 8 10 year
Response of migration to employment rate
Note: The solid line shows the impulse responses. The dashed lines indi-cate five standard error confidence band around the estimate. Errors are generated by Monte-Carlo with 1000 repetitions.
ies. Secondly, net migration is influenced by the capacity of a country to receive foreign-born labour (reflected by GDP per capita growth and unem-ployment rate of host country). The finding that the unemunem-ployment rate in the host country negatively influences migration is in line with previous empirical studies (Pope and Withers, 1985; Marr and Siklos, 1994; Islam, 2007). Our finding that per capita GDP growth at destination positively in-fluences migration is line with the literature which has estimated models for bilateral migration flows (Gross and Schmitt, 2012; Bertoli and Fern´ andez-Huertas, 2011; Mayda, 2010). Our study confirms the findings by Damette and Fromentin (2013) which show immigration is conditioned by levels of unemployment and wages, while migration has no adverse effect on unem-ployment in OECD countries. Since increase in wages can reflect high GDP per capita growth or low unemployment rate, our results also corroborate partially the findings by Barcellos (2010) that employing a panel VAR on US states shows that immigration does not affect wages while wages do impact immigration. However, our findings do not corroborate the results of Ortega and Peri (2009) who find that immigration does not affect per capita income. Despite the methodology, this difference in results can be explained by the difference in samples (time period and number of countries).
Figure 3: Impulse response functions- Model 3 −.005 0 .005 .01 0 2 4 6 8 10 year
Response of GDP per capita to migration rate
−.06 −.04 −.02 0 .02 0 2 4 6 8 10 year
Response of NB unemployment to migration rate
−.0002 0 .0002 .0004 .0006 0 2 4 6 8 10 year
Response of migration rate to GDP per capita
−.0004 −.0002 0 .0002 .0004 .0006 0 2 4 6 8 10 year
Response of migration rate to NB unemployment rate
Note: NB stands for native-born. The solid line shows the impulse responses. The dashed lines indicate five standard error confidence band around the estimate. Errors are generated by Monte-Carlo with 1000 repetitions.
Figure 2 displays the impulse response functions using total employment rate instead of total unemployment rate. The impulse response functions in Figure 2 corroborate the finding that migration inflows respond positively to GDP per capita and vice-versa. Total employment rate responds positively to migration inflows, while migration inflows do not respond significantly to total employment rate. Therefore, the results in Figure 2 indicate that the negative impact of migration on unemployment rate is not due to the fact that migration can discourage job seekers. Immigration flows do not reduce the participation rate of the host country residents. These results also show that net migration flows are not influenced by employment rate.
Using native-born unemployment instead of total unemployment, Figure 3 confirms the finding that migration inflows respond positively and signifi-cantly to GDP per capita growth and vice-versa. Native-born unemployment rate has no significant negative impact on migration, while migration has a negative significant impact on native-born unemployment rate. These results indicate that immigrants do not reduce the job prospects of natives. More-over, changes in native-born unemployment rate do not seem to affect the net migrations flows.
Figure 4: Impulse response functions- Model 4 −.01 −.005 0 .005 .01 0 2 4 6 8 10 year
Response of GDP per capita to migration rate
−.08 −.06 −.04 −.02 0 .02 0 2 4 6 8 10 year
Response of FB unemployment rate to migration rate
−.0002 0 .0002 .0004 .0006 0 2 4 6 8 10 year
Response of migration rate to GDP per capita
−.0005 0 .0005 .001 0 2 4 6 8 10 year
Response of migration rate to FB unemployment rate
Note: FB stands for foreign-born. The solid line shows the impulse responses. The dashed lines indicate five standard error confidence band around the estimate. Errors are generated by Monte-Carlo with 1000 repetitions.
also shows the bidirectional positive relationship between migration inflows and GDP per capita growth. Foreign-born unemployment has the same link with migration as native-born unemployment. More precisely, the foreign-born unemployment rate has no significant impact on migration inflows, while migration negatively influences the foreign-born unemployment rate. These results indicate that the arrival of immigrants reduces the unemployment rate of foreign-born residents. Immigrants are mainly concerned by aggre-gate unemployment, which is a better indicator of host country employment opportunities.
Even though impulse responses give information about the effect of changes in one variable on another, they do not show how important shocks on one variable are in explaining fluctuations in other variables. To assess the im-portance of changes in one variable in explaining changes in other variables, we perform a variance decomposition. Table (5) reports the variance decom-position analysis. The variance decomdecom-position shows that GDP per capita and agregate unemployment rate of the host country explain respectively ap-proximately 8% and 5% of the fluctuations of migration. Migration explains approximately 5% of changes in GDP per capita, 6% of the fluctuactions of unemployment rate, and 4% of the changes in the employment rate of the
Table 5: Variance decomposition analysis
Variation in the row variable explained by column variable (in %, 10 periods ahead)
Model 1 ∆M ∆Y ∆U ∆M 87.73 7.51 4.75 ∆Y 4.82 78.57 16.60 ∆U 3.89 44.92 51.20 Model 2 ∆M ∆Y ∆E ∆M 89.55 7.58 2.89 ∆Y 5.82 89.71 4.47 ∆E 5.99 38.40 55.61 Model 3 ∆M ∆Y ∆N BU ∆M 86.97 7.92 5.11 ∆Y 4.76 84.75 10.49 ∆N BU 2.10 15.62 82.28 Model 4 ∆M ∆Y ∆F BU ∆M 88.80 7.64 3.57 ∆Y 5.13 86.16 8.71 ∆F BU 6.78 23.22 69.99
host country. Native- and foreign-born unemployment rates explain respec-tively 5% and 4% of the variation in migration inflows. Migration explains 2% of the fluctuations in native unemployment rate, and 7% of the changes in foreign born unemployment rate.
In summary, we find evidence that net migration inflows are influenced by the host country’s economic conditions (reflected by GDP per capita growth and total unemployment rate). A first factor explaining these findings is the reaction of immigrant flows to economic demand. During periods of rapid economic growth, labour demand increases, and a part of the addi-tional labour supply comes from abroad. Indeed, the migration decision is related to the job opportunities and the probability of employment in the host country. Better economic conditions in host countries increase the in-centive for migrants to migrate. A second explanation is that governments adjust immigration policies to changes in the labour market situation, or the state of public opinion (see Benhabib, 1996; Ortega, 2005), especially during economic downturns. Governments have the possibility to restrict the deliverance of permanent residence permits in periods of high unemploy-ment. Immigration is subject to policy restricting, while there is no control on outflows8. Therefore, the negative response of net migration (measur-ing permanent and long-term movements) to unemployment seems to be related to immigration policy. Moreover, better economic conditions in the host country can reduce the concern about the link between migration and native-born employment opportunities, and so reduce the incentives of lob-8Nationals and foreigners may move from one country to another according to economic situation.
bies against labour migration (Facchini et al., 2011; Facchini and Steinhardt, 2011).
We also find evidence that immigration inflows contribute to host country economic prosperity (positive response of GDP per capita and a negative re-sponse of unemployment rate). The arrival of immigrants does not reduce the job prospects of host country residents (native- or foreign-born). Immigrants also contribute to host country economic growth. This may reflect the high skill level of migrants in recent decades. As shown by the theoretical studies (Dolado et al., 1994; Barro and Sala-i-Martin, 1995) the more migrants are educated, the more immigration has a positive effect on the economic growth of the host country.
5
Conclusion
This paper examines empirically the interaction between immigration and host country economic conditions. The empirical study is conducted using a panel VAR approach using data of 22 OECD countries over the period 1987 to 2009. Our results provide evidence that there is a positive bidirectional relationship between immigration and host country GDP per capita, and a negative bidirectional relationship between immigration and host country total unemployment rate. We also find a positive impact of migration on host country total employment rate indicating that the negative impact of migration on total unemployment rate is not due to the fact migration can discourage job seekers. Moreover, as is also the case for total unemployment, immigration negatively influences both native- and foreign-born unemploy-ment rates. However, contrary to total unemployunemploy-ment rate, migration does not respond to native- or to foreign born unemployment rates. Therefore, our results show that the main concern in host countries about the adverse impact of immigration on employment opportunities for native-born resi-dents is not found. Also, our results indicate that immigrants are mainly concerned by aggregate unemployment which represents a better indicator of host country employment opportunities.
Our evidence that migration inflows are influenced by the capacity of a country to receive foreign labour (reflected by GDP per capita growth and total unemployment rates) can be explained by the following reasons. On the one hand, a migration decision is related to the job opportunities and the probability of employment in the host country. Better economic conditions in the host country increase migrants’ incentives to migrate. On the other, governments adjust migration policies to changing labour market needs. In fact, in most host countries, government restrict the deliverance of permanent
residence permits in periods of high unemployment. Therefore, the negative response of net migration (as measured by permanent and long-term move-ments) to unemployment seems to be related to immigration policy. More-over, better economic conditions in the host country can reduce the concern about the link between migration and native-born employment opportuni-ties, and so reduce the incentives of anti-immigration lobbies. Countries with higher unemployment are less attractive to migrants and are willing to pur-sue more restrictive immigration policies.
Our finding that migration inflows contribute to host country economic pros-perity (positive impact on GDP per capita and total unemployment rate) reflects the high skill levels of migrants in recent decades. As shown by the theoretical studies (Dolado et al., 1994; Barro and Sala-i-Martin, 1995 the more migrants are educated, the more immigration has a positive effect on economic growth in the host country.
In order to tackle the problem of aging populations, immigration may be considered as a potential solution to compensate for labour shortage in many OECD countries. Our results indicate that immigration flows, do not harm the employment prospects of residents,native- or foreign-born. Hence, OECD countries may adjust immigration policies to labour market needs, and can receive more migrants, without worrying about a potential negative impact on growth and employment.
Appendix
A-1
Migration Trends
Table A-1: Net migration in some OECD countries 1987-2009 Net migration Average annual
(000s) net migration (000s) Country 1987 1997 2007 1987− 2009 Germany 220 94 44 330 Spain 14 64 716 265 Italy -10 127 495 211 United Kingdom 22 52 207 111 France 44 40 75 72 Greece 20 61 40 54 Switzerland 26 -7 75 37 Belgium -1 20 55 34 Sweden 20 6 54 30 Austria 2 2 35 29 Netherlands 44 28 -6 28 Portugal -38 29 20 17 Norway 13 11 40 15 Ireland -37 19 46 13 Denmark 6 12 23 12 Finland 1 4 13 6 Luxembourg 2 4 6 4 Iceland 1 0 5 1 Europe 349 565 1943 1226 United States 666 1309 823 1005 Canada 164 154 235 195 Australia 126 72 216 129 New Zealand -11 8 6 8 OECD 1294 2107 3223 2563
Source : Authors’ tabulation, Labour Force Statistics, OECD (2011)
Figure A-1: Net migration rate in some OECD countries (per 1000 inhabi-tants) 0 5 10 15 1987 1992 1997 2002 2007 Australia
Net migration rate
YEAR 0 5 10 1987 1992 1997 2002 2007 Austria
Net migration rate
YEAR 0 2 4 6 1987 1992 1997 2002 2007 Belgium
Net migration rate
YEAR 4 6 8 10 1987 1992 1997 2002 2007 Canada
Net migration rate
YEAR 0 2 4 6 1987 1992 1997 2002 2007 Denmark
Net migration rate
YEAR 0 1 2 3 1987 1992 1997 2002 2007 Finland
Net migration rate
YEAR .5 1 1.5 2 1987 1992 1997 2002 2007 France
Net migration rate
YEAR 0 5 10 15 1987 1992 1997 2002 2007 Germany
Net migration rate
YEAR 0 5 10 15 1987 1992 1997 2002 2007 Greece
Net migration rate
YEAR −20 −10 0 10 20 1987 1992 1997 2002 2007 Iceland
Net migration rate
YEAR −10 0 10 20 1987 1992 1997 2002 2007 Ireland
Net migration rate
YEAR 0 5 10 1987 1992 1997 2002 2007 Italy
Net migration rate
YEAR
Net immigration rate is the number of immigrants less the number of emigrants expressed per 1,000 population.
Figure A-1: Net migration rate in some OECD countries (per 1000 inhabi-tants) (continued) 0 5 10 15 1987 1992 1997 2002 2007 Luxembourg
Net migration rate
YEAR −2 0 2 4 1987 1992 1997 2002 2007 Netherlands
Net migration rate
YEAR −10 −5 0 5 10 1987 1992 1997 2002 2007 New Zealand
Net migration rate
YEAR 0 5 10 1987 1992 1997 2002 2007 Norway
Net migration rate
YEAR −5 0 5 10 1987 1992 1997 2002 2007 Portugal
Net migration rate
YEAR 0 5 10 15 1987 1992 1997 2002 2007 Spain
Net migration rate
YEAR 0 2 4 6 1987 1992 1997 2002 2007 Sweden
Net migration rate
YEAR 0 5 10 15 1987 1992 1997 2002 2007 Switzerland
Net migration rate
YEAR 0 1 2 3 4 1987 1992 1997 2002 2007 United Kingdom
Net migration rate
YEAR 2 3 4 5 1987 1992 1997 2002 2007 United States
Net migration rate
YEAR
Net immigration rate is the number of immigrants less the number of emigrants per 1,000 total population.
A-2
Sensitive analysis to alternative ordering
This section reports results using two alternative orderings in VAR: Alternative ordering 1: (∆Y, ∆U, ∆M )
Alternative ordering 2: (∆Y, ∆M, ∆U )
Figure A-2: Impulse response functions- Alternative ordering 1
−.005 0 .005 .01 0 2 4 6 8 10 year
Response of GDP per capita to migration rate
−.04 −.02 0 .02 0 2 4 6 8 10 year
Response of unemployment rate to migration rate
0 .0002 .0004 .0006 .0008 0 2 4 6 8 10 year
Response of migration rate to GDP per capita
−.0005
0
.0005
0 2 4 6 8 10
year
Response of migration rate to unemployment rate
Note: The solid line shows the impulse responses. The dashed lines indi-cate five standard error confidence band around the estimate. Errors are generated by Monte-Carlo with 1000 repetitions.
Table A-2: Variance decomposition analysis- Alternative orderings Variation in the row variable explained by column variable
(in %, 10 periods ahead) Alternative ordering 1 ∆M ∆Y ∆U ∆M 88.55 6.40 5.44 ∆Y 6.26 77.77 16.91 ∆U 8.03 30.65 61.44 Alternative ordering 2 ∆M ∆Y ∆U ∆M 89.75 5.52 4.72 ∆Y 5.76 77.68 16.56 ∆U 8.53 30.40 61.19
Figure A-3: Impulse response functions- Alternative ordering 2 −.002 0 .002 .004 .006 .008 0 2 4 6 8 10 year
Response of GDP per capita to migration rate
−.04 −.02 0 .02 0 2 4 6 8 10 year
Response of unemployment rate to migration rate
0 .0002 .0004 .0006 .0008 0 2 4 6 8 10 year
Response of migration rate to GDP per capita
−.0004 −.0002 0 .0002 .0004 0 2 4 6 8 10 year
Response of migration rate to unemployment rate
Note: The solid line shows the impulse responses. The dashed lines indi-cate five standard error confidence band around the estimate. Errors are generated by Monte-Carlo with 1000 repetitions.
References
Angrist, J.D. and Kugler, A.D. (2003). Protective or counter-productive? Labour market institutions and the effect of immigration on EU natives?
Economic Journal, 113(488), 302-331.
Arellano, M. and Bover, O. (1995). Another Look at the Instrumental Vari-able Estimation of Error-Components Models. Journal of Econometrics 68(1), 29-52.
Barcellos, S. H. (2010). The Dynamics of Immigration and Wages. RAND Working Paper No. WR-755.
Barro, R. and Sala-i-Martin, X. (1995). Economic Growth. McGraw-Hill. New York.
Benhabib, J. (1996). On the political economy of immigration. European
Economic Review, 40(9), 1737-1743.
Bertoli, S., Fern´andez-Huertas M. J. (2011). Multilateral Resistance to Mi-gration. IZA Discussion Papers 5958, Institute for the Study of Labor (IZA).
Blanchet, D. (2002). Immigration et avenir d´emographique. Commissariat g´en´eral du Plan, Octobre, 359-365.
Campbell, J. and Perron, P., (1991). Pitfalls and Opportunities: What Macroeconomists Should Know about Unit Roots. NBER Macroeconomics
Annual, eds. O. Blanchard and S. Fisher Cambridge, Massachusetts: MIT
Press.
Card, D. (1990) The impact of the Mariel boatlift on the Miami labor market.
Industrial and Labor Relations Review, 43(2), 245-257.
Card, D. (2007). How Immigration Affects U.S. Cities. CReAM Discus-sion Paper Series 0711, Centre for Research and Analysis of Migration (CReAM), Department of Economics, University College London.
Choi I., (2001). Unit root tests for panel data.Journal of International Money
and Banking, 20, 249272.
Chojnicki, X., Docquier, F. and Ragot, L. (2005). L’immigration “choisie” face aux d´efis ´economiques du vieillissement d´emographique. Revue
´economique, 56(6), 1359-1384.
Damette, O. and Fromentin, V. (2013). Migration and labour markets in OECD countries: a panel cointegration approach. Applied Economics, 45(16).
Dolado, J., Goria, A. and Ichino, A. (1994). Immigration, human capital and growth in the host country: evidence from pooled country Data. Journal
of Population Economics, 7(2), 193-215.
Dustmann, C., Fabbri, F. and Preston, I. (2005). The Impact of Immigration on the British Labour Market. The Economic Journal, 115(507), 324-341. Facchini, G., Mayda, A. M., Mishra, P. (2011). Do interest groups affect US immigration policy? Journal of International Economics, 85(1), 114-128. Facchini, G., Steinhardt, M. F. (2011). What drives U.S. immigration policy?
Evidence from congressional roll call votes. Journal of Public Economics 95(7-8), 734-743.
Gross, D. M. and Schmitt, N. (2012) Low- and high-skill migration flows: free mobility versus other determinants, Applied Economics, 44, 120. Hadri,K., (2000). Testing for Stationarity in Heterogeneous Panel Data.
Econometric Journal, 3(2), 14861.
Harris, J. and Todaro, M. 1970. Migration, Unemployment and Development: A Two-sector Analysis. American Economic Review, 60, 126142.
Hunt, J. (1992) The impact of the 1962 repatriates from Algeria on the French labor market. Industrial and Labor Relations Review 45(3), 556-572. Im, K., Pesaran, M. and Shin,R.,(2003). Testing for Unit Roots in
Heteroge-neous Panels. Journal of Econometrics, 115(1), 5374.
Islam, A. (2007). Immigration and Unemployment Relationship: Evidence from Canada. Australian Economic Papers, 46(1), 52-66.
Jean, S. and Jimenez, M. (2007). The Unemployment Impact of Immigration in OECD Countries. OECD Economics Department Working Paper, No. 563.
Leybourne, S., (1995). Testing for Unit Roots Using Forward and Reverse DickeyFuller Regressions. Oxford Bulletin of Economics and Statistics, 57(4), 55971.
Love, I. and Zicchino, L. (2006). Financial development and dynamic invest-ment behavior: Evidence from Panel VAR. Quarterly Review of Economics
and Finance, 46(2), 190-210.
Marr, W. and Siklos, P. (1994). The Link between Immigration and Unem-ployment in Canada. Journal of Policy Modeling, 16(1), 1-26.
Mayda, A. M. (2010). International migration: a panel data analysis of the determinants of bilateral flows. Journal of Population Economics, 23, 124974.
Morley, B. (2006). Causality between economic growth and immigration: An ARDL bounds testing approach. Economics Letters, 90(1), 72-76.
OECD (2008). International Migration Outlook. OECD Publishing. OECD (2011). Labour Force Statistics 2011.OECD Publishing.
Ortega, F. (2000). Pareto Improving Immigration in an Economy with Equi-librium Unemployment. Economic Journal, 110, 92112.
Ortega, F. (2005). Immigration quotas and skill upgrading. Journal of Public
Economics, 89(9-10), 1841-1863.
Ortega, F., and Peri, G. (2009). The Causes and Effects of International Migrations: Evidence from OECD Countries 1980-2005. NBER Working
Paper No. 14833
Pesaran, M., (2004). General Diagnostic Tests for Cross Section Dependence in Panels. Cambridge Working Papers in Economics no. 435 and
CE-Sifo Working Paper Series no. 1229, University of Cambridge, Cambridge,
United Kingdom.
Pesaran, M.H., (2007). A simple panel unit root test in the presence of cross-section dependence. Journal of Applied Econometrics 27(2), 265-312. Pischke, J. and Velling, J. (1997). Employment effects of immigration to
Germany: an analysis based on local labor markets. Review of Economics
and Statistics 79(4), 594-604.
Pope, D. and Withers, G. (1985). Immigration and Unemployment.
Eco-nomic Record 61(2), 554-563.
Roodman, D. (2009). How to Do xtabond2: An Introduction to “Difference” and “System” GMM in Stata. Stata Journal 9(1), 86-136.
Simon, J.L., Moore, S. and Sullivan, R. (1993). The effect of immigration on aggregate native unemployment: an across-city estimation. Journal of
Labor Research, 14(3), 299-316.
Smith, V., Leybourne, S., Kim, T.H and Newbold, P., (2004). More Powerful Panel Unit Root Tests with an Application to the Mean Reversion in Real Exchange Rates. Journal of Applied Econometrics 19(2), 14770.
Solo,V., (1984). The Order of Differencing in ARIMA Models. Journal of the
American Statistical Association, 79(388) , 91621.
Westerlund, J. (2007). Testing for error correction in panel data. Oxford