Biofuels
Supply Chain Characterization
byAnindya Banerjee Bachelor of Technology Indian Institute of Technology
Jos6 Luis Noguer Master of Science
Pontificia Universidad Cat6lica de Chile
Submitted to the Engineering Systems Division in Partial Fulfillment of the Requirements for the Degree of
Master of Engineering in Logistics
at theMassachusetts Institute of Technology
June 2007@ 2007 Anindya Banerjee & Jose Luis Noguer
All rights reserved
The author hereby grants to MIT permission to reproduce and to
distribute publicly paper and electronic copies of this thesis document in whole or in part.
'A Signature of Authors ... ...
E neerin tems Division "May 16, 2007
Certified by ... ...
Chris Caplice Executi e Di r, Master of Engineering in Logistics Thesis Supervisor
Accepted by ... ... ... S e.. . YP esi Sheffi Professor of Civil and Envii4 mental Engineering
MASSACHUSETTS INSTITUTE
OF TECHNOL03Y
JUL 3
1
2007
LIBRARI•ES
Yrofessor of Engineering Systems Director, MIT Center for Transportation and Logistics
Biofuels Supply Chain
Characterization
byAnindya Banerjee And Jos6 Luis Noguer
Submitted to the Engineering Systems Division on May 17, 2007 in Partial Fulfillment of the
Requirements for the Degree of Master of Engineering in Logistics
Abstract
Ethanol can be made from agricultural residues like wheat straw and from crops dedicated to energy use, like switchgrass. We study the logistics aspects of this transformation and determine the main characteristics of the supply chain making ethanol from cellulose. Important to the final acceptability of ethanol as a transportation fuel is both the economics as well as the
environmental aspect of using ethanol. In this study we analyze the buildup of cost as biomass is transformed into fuel. We also look at all the steps involved and describe them from a supply chain perspective
We have found that the main cost components in the cellulosic ethanol production are biomass production, harvesting and ethanol refining. We have also found that the main factor in reducing the overall production cost is the biomass to ethanol conversion factor. The development of new technologies to convert biomass into ethanol becomes a critical issue to achieve the cost targets imposed in order to make ethanol more competitive with other sources of energy such as fossil fuels. An increase in the current conversion factor of 42% could potentially yield to a decrease of nearly 15% in the: total production cost of cellulosic ethanol. Other factors such as increasing the refining plant size and biomass yield can also help to reduce the production cost but we found its impact to be lower than that of the conversion factor.
Finally, we also performed a strategic analysis of the entire supply chain to determine how is this industry likely to develop and who will have more bargaining power and therefore will realize most of the value and profits in the supply chain. Our analysis shows that in such a dynamic scenario as in the alternate energy industry, the best option is to build sustained advantage by strong alliances with different partners within the supply chain.
Thesis Supervisor: Chris Caplice
Acknowledgements
We wish to thank Esme' Fantozzi and Iris Lewandowski at Shell for their help, patience and support. Without their guidance and those many hours on the phone we would have never made it through this thesis.
We also wish to thank our thesis supervisor, Chris Caplice, for his valuable insight and dedication.
Anindya Banerjee's Acknowledgements
My year at MIT drew from the combined efforts and wishes of many people. I would like to
thank my family (especially my father and my uncle) and Narayan Venkatasubramanian. At MIT I have been helped in many ways by many people. I would like to thank my thesis partner Jose for his help and understanding, and my friend Xiaoyan for her support and friendship.
Jose Luis Noguer's Acknowledgements
Now that I finally see the light of the end of this intense yet exciting tunnel that the MLog turned into, I would like to thank all of those who helped and supported me to get here. In particular I would like to thank my parents and sisters for their love and support.
Also, I cannot thank enough my wife Paulina for her love, support, tons and tons of patience and also for encouraging me to take on this adventure. Without her, all of this wouldn't have been possible.
Biographical Note
Anindya Banerjee received his MLOG degree from MIT in 2007 and his Bachelor's degree in Industrial Engineering from IIT (Kharagpur) in 2001. He has worked as a software engineer with IBM Global Services and as an optimization consultant with i2 Technologies. He can be reached at [email protected].
Jose Luis Noguer received his MLOG degree from MIT in 2007. Prior to attending MIT, he worked as Procurement Logistics Leader for two large engineering and construction projects in the forestry industry in Chile. Jose Luis holds a Master of Science degree from the Pontificia Universidad Catolica the Chile where he also carried out his undergraduate studies in Industrial Engineering (with a minor in Mining Engineering). He can be reached at
Table of Contents
Abstract ... 2 Acknowledgem ents... 3 Biographical N ote ... 4 Table of Contents ... 5 List of Tables ... 7 List of Figures ... 7 1 Introduction ... 10 1.1 Energy use... 11 1.2 Ethanol ... 161.3 First generation of biofuels ... 18
1.4 Second generation of biofuels... 19
1.5 Technology ... ... 22
1.6 Trade offs ... 24
2 M atching D em and and Supply... 26
2.1 A ggregate D em and ... ... 26
2.2 A ggregate Supply... ... 29
2.3 Transportation Strategies for Ethanol ... .... ... 31
2.3.1 G asoline Transport... 31
2.3.2 Ethanol Transport... ... 31
2.3.3 Transportation Routes from North Dakota ... .... 34
3 D escription of the supply chain ... 36
3.1 Com petitive Analysis... ... 36
3.1.1 Fluid Phase... 37
3.1.2 Transitional Phase... 38
3.1.3 M ature Phase... 39
3.1.4 D isruption Phase ... 39
3.2 Seed Production ... . 40
3.3 Farm ing and H arvesting ... ... . 41
3.4 Biom ass Transport and Storage ... 43
3.5 Refining ... 45
3.6 Ethanol Transport ... ... 46
3.7 D istribution ... ... 46
3.8 Strategic Inference ... 46
4 M ethodology and Cost m odel... 48
4.1 W heat straw ... ... 49
4.1.1 Production ... ... 49
4.1. 2 H arvest ... ... 53
4.1.3 Inventory at the field...53
4.1.4 Transportation ... 54
4.1.5 Refining/processing ... ... 56
4.2 Sw itchgrass ... ... 58
4.2.1 Production ... 58
4.2.:2 H arvest ... ... 59
4.2.3 Inventory at the field ... .59
4.2.4 Transportation ... 60
4.2.5 Refining/processing ... 60
4.3 D istribution of Ethanol ... ... 60
5 A nalysis... ... 63
5.1 A Couple of Analytical M odels ... 63
5.1.1 The Facility Size M odel... 63
5.1.2 Facility Size Model (Including Ethanol Prices)... 66
5.2 Results... 67
5.3 Sensitivity on parameter assumptions... 74
5.4 Scenarios for different technologies ... ... 76
6 Conclusions... 81
List of Tables
Table 1: Wheat yields by scenario ... 50
Table 2: Wheat straw production costs ... .... .. 51
Table 3: Wheat straw generation ... 52
Table 4: Wheat straw harvesting costs... 53
Table 5: Conversion factor from wheat straw into ethanol... ... 56
Table 6: Variable refining costs ... 57
Table 7: Switchgrass yield by scenario... 58
Table 8: Switchgrass harvesting costs ... 59
Table 9: Plant to terminal transportation rates ... 61
Table 10: Plant to terminal transportation leadtimes ... ... 61
Table 11: Unit cost per gallon of ethanol produced from wheat straw... . 68
Table 12: Unit cost per gallon of ethanol produced from switchgrass ... 68
Table 13: Unit cost per GJ of ethanol produced from wheat straw ... . 70
Table 14: Unit cost per GJ of ethanol produced from switchgrass ... 70
List of Figures
Figure 1: World energy consumption trend (Source: Energy Information Administration (2006) ... 14Figure 2: US Ethanol production between 1980 and 2006 (Source: Renewable Fuels Association) ... ... 16
Figure 3: Wheat field ... 21
Figure 4: Switchgrass plants ... 21
Figure 6: Growth in M andated U sage... 27
Figure 7: States with MTBE ban schedules (dark states) ... ... 28
Figure 8: Ethanol Production (Volume and Cost). Source (Steiner, 2003) ... 29
Figure 9: Current Ethanol Production (Darker shades mean more production) ... 30
Figure 10: Wheat Production by county ... 30
Figure 11: Ethanol transport from North Dakota... 35
Figure 12: The biofuel supply chain ... ... 36
Figure 13: The Utterback Model of Technology Lifecycle ... ... 37
Figure 14: Combine Harvesting of Wheat ... 42
Figure 15: Truck transportation of bales... 43
Figure 16: Trailer transportation of bales ... 44
Figure 17: Field storage of bales of wheat straw ... ... ... 44
Figure 14: Ethanol Supply Chain... ... 49
Figure 15: Biofuel transportation diagram... 56
Figure 16: Ethanol conversion process ... 62
Figure 21: Optimal Facility size by scale parameter ... ... 66
Figure 18: Cost structure per gallon of ethanol produced from wheat straw (intermediate scenario) ... ... 71
Figure 19: Cost structure per gallon of ethanol produced from switchgrass (intermediate scenario) ... ... ... ... 72
Figure 20: Cost per gallon of ethanol produced from wheat straw... 73
Figure 21: Cost per gallon of ethanol produced from switchgrass ... 73
Figure 22: Sensitivity analysis of total cost per gallon of ethanol vs. plant size ... 75
Figure 24: Sensitivity analysis of total cost per gallon of ethanol vs. biomass yield ... 77 Figure 25: Sensitivity analysis of total cost per gallon of ethanol vs. ethanol conversion factor. 79
1
Introduction
The quest for alternate sources of energy is a high priority for many countries. The US
government supports biofuels through the Department of Energy (DOE) and the Department of Agriculture. During 2007, the DOE has committed over $600 millions in alternative energy and efficiency projects, mainly to support bioethanol refineries. Furthermore, the 'Twenty in Ten' initiative pursues to reduce the gasoline consumption in the US by twenty percent in the next ten years. The idea is to achieve this goal by improving the fuel economy standards for cars and light trucks and by increasing the supply of renewable and alternative fuels. The objective is to
increase the actual production from nearly 6 billion gallons in 2006 to 35 billion gallons of ethanol by 2017, which is roughly five times the current objective for 2012. Similarly,
governments all over the world are passing legislation or funding research to develop alternative sources of energy. Yet the development of biofuels is not without significant challenges.
It is well understood now that logistics costs and inadequate logistics infrastructure pose difficult challenges to the biofuel industry. A study of the mechanics of the entire supply chain is a precursor to any efforts in optimizing the supply chain.
The nature of the supply chain in biofuels is different from the traditional hydrocarbon supply chain. The energy density of the raw materials (feedstock) as well the final product (ethanol) is less than those of crude and processed gasoline. Distributing ethanol has its own set of challenges since it absorbs water and is corrosive. New investments will be required to store
and transport ethanol, and these investments will be best driven by an understanding of the supply chain dynamics involved.
We are confident that efficient operation of this supply chain will require new strategies and new models.
In the first section of this thesis we present an overview of the main aspects of ethanol production. In the second section, we discuss some of the key factors driving the supply and demand for biofuels and actual strategies used to cope with these issues. The third section presents a description of the supply chain for biofuels and its main components.
In the fourth section we introduce the model we have built to study the ethanol supply chain. We will describe the methodology and present the parameters we used to estimate the production costs for two types of biomass: wheat straw and switchgrass. In the following section we analyze some of the results and how they would be affected by changes in the main
parameters being considered. We also discuss potential changes in the current scenario based on technological improvements. Finally in the sixth and last section we present the conclusions from our work.
1.1
Energy use
There has been an increasing interest in finding alternate sources of energy, triggered by increasing world energy demand, concerns about the effect of fossil fuels on global warming, and, for most countries, energy security. Globally this has been reflected in several initiatives such as the United Nations Convention on Climate Change and the Kyoto Protocol (UNFCCC,
1997), where targets have been set for the use of biofuels as a way to mitigate climate change. At the same time while demand for biofuels has increased over the last decade, not enough
emphasis has been put to developing new technologies for producing and distributing biofuels and in designing the supply chain for them.
According to Allen et al. (1998) the biomass supply chain consists of a range of different activities. These activities include ground preparation, planting and harvesting, handling, storage, processing, transport and utilization as fuel. The most common way to transport biomass from the field is by road, given the short distances involved and the flexibility provided by road transport.
There are several options for supply chain configuration but these are tied to the
technological processes used to convert biomass into ethanol and to the cost implications of such a configuration. In this thesis we will discuss some of the key decisions that must be made when designing the supply chain for the production of ethanol and the trade-offs between these
decisions. For instance, some of the most important decisions include where to locate the ethanol refineries - closer to the supply or closer to the demand - and what is the most convenient
stocking strategy.
Biofuels can be produced from several different resources such as dedicated crops, wood, forestry and agricultural residues, and organic wastes or residues. In this thesis we will focus our attention on two of these sources: wheat straw as an agricultural residue and switchgrass
Agricultural residues such as wheat straw are by-products of food production. Their main advantage is that as by-products, they are currently relatively cheap and extensively available. From a farmer's point of view most of the production cost is borne by the main crop, any income coming from this source will be beneficial. Their main disadvantage is that farming is optimized for the production of the main crop, in this case wheat. Consequently, the quality of the biomass obtained from residues may be inferior in terms of degradation, size or water content.
On the other hand, dedicated crops have higher energy yields which make them attractive for the production of ethanol. Although the cost of growing and producing the dedicated crop is often higher than the cost of agricultural residues, this cost difference can be offset by a smaller planting requirement of biomass to produce the same amount of ethanol. These also have several
other advantages, such as less quantity of land required to grow the crop and therefore less transportation costs from the field to the plant. Additionally, dedicated crops tend to have a more consistent quality since they are grown specifically to be used as biomass.
There are mainly three drivers behind this increasing use of biomass as a source of energy for transportation. These drivers are:
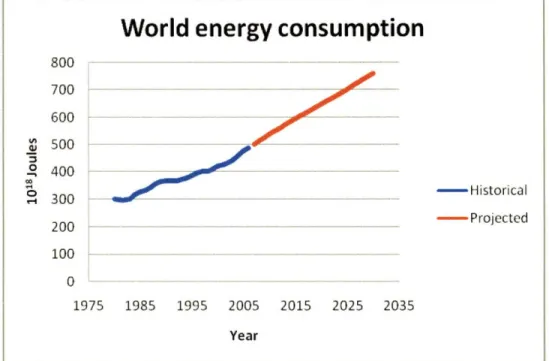
Increasing world energy demand: the energy consumption is expected to increase over time and since up until now most of the energy has been obtained from non-renewable sources such as fossil fuels, many countries are looking for alternate and renewable energy sources. According to Walsh et al. (2003) currently the US uses about 3.7-1018 Joules of biomass energy, mainly in the form of ethanol, and while there is a potential to increase the use of biomass, in order to support future increases in the energy demand, the use of specialized bioenergy crops will be necessary. This is still a very small fraction
of the entire world energy consumption. According to the Energy Information
Administration (2006), the world energy consumption in 2005 reached nearly 500-1018 Joules and by the year 2030 it is expected to increase to approximately 750.108 Joules.
World energy consumption
800 - -..- -- --700 600 S500 o 400 - 300 -Historical
Figure 1: World energy consumption trend (Source: Energy Information Administration (2006)
* Global warming and climate change: greenhouse gas emissions have increased
significantly in the last decades. This is believed to have had an impact on some of the climatic changes the world is experiencing such as an increase in the average
temperature, in what has been called global warming. One of the main reasons behind the increase in greenhouse gases such as carbon dioxide (CO2) is the increase in the use of fossil fuels. For this reason a group of nations have signed the Kyoto Protocol which is a legally binding international agreement which aims at reducing the green house gases emissions. In this agreement industrialized countries commit themselves to reduce the emissions of greenhouse gases by 5% by 2012. As of 2005, 153 nations have ratified the
14 200 - -- - - - ---- Projected 100
0
---
--
-
---1975 1985 1995 2005 2015 2025 2035 Year
agreement, although the US withdrew support for the Kyoto Protocol in 2001. The use of biofuels has been considered as one of the best ways to contribute to the reduction of CO2 emissions by replacing part of the energy demand for fossil fuels.
Energy security and dependency on imported oil: due to geopolitical reasons the US is trying to limit the amount of fuels it is importing in order to decrease its dependency on
imported oil mainly. Developing biofuels from biomass presents an opportunity to increase the amount of energy produced from both a local and renewable sources.
Brazil has been a pioneer and one of the leaders in the development and adoption of bioethanol from sugar cane. For decades, Brazilian cars have been able to run either on regular gas, ethanol or a mix of both fuels. On 2006, Brazil produced almost 4.5 billion gallons of ethanol equivalent to one third of the entire world production only behind the US with a production of almost 4.9 billion gallons (Renewable Fuels Association, 2006).
Kerstetter & Lyons (2001) performed a technical and economic assessment of the production of ethanol using wheat straw. This assessment was performed in the state of
Washington and quantifies the availability of wheat straw, develops biomass supply curves, and calculates the cost of delivering biomass to a processing facility. This cost ranges from $32 to $54 per ton depending on the availability of wheat straw. Also, according a study performed by the National Renewable Energy Laboratory (Aden et al., 2002) the cost of producing ethanol from biomass is still substantially higher than ethanol made from corn ($1.1 versus $1.7 per gallon) although this value is expected to decrease as processing technology is improved.
1.2
Ethanol
Ethanol, or ethyl alcohol, is a chemical compound produced by the fermentation of sugars with yeast. It is also commonly present in all alcoholic beverages. Ethanol's use as a fuel has
increased steadily in the last 20 years as shown by the following graph.
US Ethanol Production
6000 0VVV .2 4000 o 3000 o 2000 1000 0~ F-A F" F" Ii I." F" I4 - NJ NJ NJ NJ o k t0 o . o 'O '.0 o Q0 .0 0) 0 0 0 00 c0 00 00 00 'o 'o .o .o k.o o o o o 0 4J 0 o) 00 0 Nj 4-h M C 0 o j D o YearFigure 2: US Ethanol production between 1980 and 2006 (Source: Renewable Fuels Association)
Ethanol is produced from a number of biomass sources such as sugar cane, corn, wheat, and almost any other crop with minimum sugar or cellulose content. Biomass is composed of cellulose, hemicellulose, lignin, ash and extractives. Cellulose is difficult to convert into sugars while hemicellulose can be broken down into sugar relatively easy. Hemicellulose is composed of six-carbon sugars and five-carbon sugars. Lignin is used as a source of fuel to provide steam and power to run the ethanol plants. The content of sugars will depend on the biomass. For instance, wheat straw contains approximately 37% of six-carbon sugars (glucose), 21% of
carbon sugars (xylose), and 12% of ash. Hardwoods on the other hand contain about 55% of six-carbon sugars, 19% five-six-carbon sugars and very low ash content (1%) (Kerstetter & Lyons, 2001). The composition of the biomass will determine the energy content of the biostock and how it will be transformed into biofuel.
The economic feasibility of producing ethanol has been a major subject of research over the last several decades. Kaylen et al. (2000) developed a mathematical programming model to determine the optimal refining plant size by comparing transportation costs versus capital expenditure. Allen et al. (1998) studied the logistics management of biomass for use as fuel for
electricity generation. Their study focused on comparing different supply systems in terms of costs. One of the key results of this study is that they show that the use of bales reduces
significantly the delivered costs of biomass. Also, the use of intermediate storage facilities between the field and plant increases the total cost by 10 to 20%.
Gigler et al. (2002) studied the optimization of the supply chain for agricultural products by dynamic programming. Their research focuses on the quality biomass and how that
determines transportation and storage decisions. They identified three types of actions along the chain: handling, processing and transportation. Another technique that has been used to study the biomass supply chain is simulation. Mukunda et al. (2006) studied the logistics operations of corn stover supply for an ethanol plant. They identified unloading operations as the bottleneck and by using simulation they determined the optimal number of trucks required and average trip times. Kadam et al. (2000) studied the use of rice straw as biomass in California. They reviewed different harvesting techniques and determined a total delivered cost of about 20 $/ton using post harvesting baling and high density bales.
Similarly., another focus for research has been dedicated to crops which can be used as biomass. Mani et al. (2004) described and characterized the grinding properties of several crops in terms of energy required for grinding. One of the key results of this research is that
switchgrass presents the highest heating value (energy content) and lowest ash content of the reviewed crops. Lewandowski et al. (2003) studied four varieties of perennial grasses. This study showed that the high yields, low input requirements and multiple ecological benefits make perennial grasses a good source of biomass for the US and Europe. Switchgrass and miscanthus
are the two species that show the best potential.
Sokhansanj et al. (2006) developed a model that simulates the different stages in the biomass supply chain to predict the costs per ton of biomass delivered at the refinery. Using EXTEND they obtained a value of 32.45 $/ton of corn stover. Another study that looks into the different stages in biomass supply chain is Hamelinck et al. (2005). In this study, the authors developed a modular structure model to compare different possible chains in terms of different types of biomass and several parameters such as distance, mode of transport, and energy conversion technology. This study highlights the importance of transportation costs and densification of the biomass prior to conversion into biofuel.
1.3
First generation of biofuels
The first generation of biofuels technology uses biostock such as sugarcane, beet, and corn. The main attraction of these crops is that their high sugar or starch content transforms easily into ethanol. The main first generation biofuels are biodiesel, bioethanol, pure oils or methyl esters and the two largest producers are the US and Brazil. Actually, Brazil is the second largest
producer of ethanol in the world with 4.5 Billion gallons per year, produced mainly from sugar cane (RFA, 2006).
Two main characteristics of first generation biofuels are the following:
a. Taking advantage of higher contents of sugars in the biomass (sugarcane, beet, etc.) to obtain a simpler conversion into alcohols (ethanol).
b. Competition with food for the use of biomass, and its ethical implications. The major concern in this case is that as prices for biomass for the production of biofuels increase, a larger proportion of this biomass will be destined for the production of biofuels instead of using that to produce food. Between 1980 and 1998 the production of ethanol in the U.S. grew from 175 million gallons to 1.4 billion gallons, mainly produced from corn
(DiPardo, 2002). The increasing use of corn to produce ethanol has caused an increase in the price of corn, which is one of the main sources of food. For instance, in Mexico this has caused a so called "Tortilla Crisis" where thousands of people have participated in protests against the government and accusing the president of wanting them to die of hunger (Boston Globe, January 31, 2007).
1.4
Second generation of biofuels
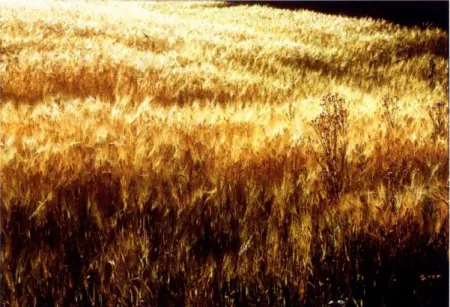
The second generation of biofuels is produced from lignocellulosic or woody sources. In this category we can consider some crop residues such as corn stover and wheat straw (Figure 3) and perennial grasses which have been widely used as fodder crops for centuries. According to
Lewandowski et al. (2003) the main characteristics that make perennial grasses attractive for biomass production are:
a. Use as energy crop does not compete with use for food. Lignocellulosic biofuels are produced using biomass that does not have an alternate use for food. In fact most of these biofuels are produced from either residues or crops without an alternate use other than to produce biofuels.
b. Higher energy content - high content of lignin and cellulose are desirable because they have higher carbon content which causes a higher heating value. Also, perennial grasses have lower water content than other annual crops. The benefit of this is that less biomass is required to achieve a certain production of ethanol, thus reducing the plantation and transportation requirements.
c. More energy efficient - some perennial grasses may be able to provide a higher amount of biomass yield per acre because of their more efficient photosynthetic pathway. Also some perennial grasses present a higher efficiency of water and nitrogen use.
d. Use of areas not under current cultivation - most of the perennial grasses can be grown in areas where there is no other use for the land and with little or no maintenance. This way, these crops do not compete for land with other uses such as the food industry.
Second generation biofuels can also be produced from agricultural and forest residues which are relatively inexpensive and that otherwise would need to be disposed of. Additionally this could represent an additional source of income for farmers.
English et al. (2004) studied the availability of switchgrass (Figure 4) and other residues at a US level as a function of the unit price per ton. Through a 10-year simulation they concluded that as the price increases, so does the availability of biomass reaching a total of 153 million tons at a price of $40/ton (53 million tons of switchgrass and 100 million tons of residues).
Figure 3: Wheat field
Figure 4: Switchgrass plants
McLaughlin et al. (1999) describes the main characteristics of switchgrass for use as a bioenergy crop. The average yield depends on whether it is harvested once or twice a year. In the
first case the average yield ranges between 16 and 20 metric tons/hectare, while in the second case it ranges between 22 and 24 metric tons/hectare mainly in the southern states. This study also emphasizes the potential for use as biofuels reaching with an ethanol recovery of 280 liters per metric ton.
1.5
Technology
Several technologies have been developed to transform biomass into ethanol, but none of these have been successful enough in terms of costs and efficiencies to dominate the market.
The main process to produce Ethanol from lignocellulosic biomass has been developed
by the National Renewable Energy Laboratory (NREL) based on corn stover (Aden et al., 2002)
and consists of four steps.
U1
Figure 5: Four steps of ethanol production
1. Pretreatment: the biomass is reduced in size and chemically pre-treated. The chemical pretreatment may include dilute acid, alkaline, organic solvent, ammonia, sulfur dioxide
or other chemicals. This process is used to release most of the hemicellulose sugars and acetic acid.
2. Hydrolysis: the feedstock is sent to an enzymatic or acid hydrolysis where cellulose and hemicellulose polymers are broken down into their basic sugars. According to Sun & Cheng (2002) the high cost and low yield of the current hydrolysis technologies are the main challenges to make ethanol more competitive as a biofuel. Major technologies used for hydrolysis are: dilute acid hydrolysis, strong acid hydrolysis and enzymatic
hydrolysis. While dilute and strong acid hydrolysis are the most developed technologies, enzymatic hydrolysis is the technology that seems to have the better potential for
achieving a cheaper and more efficient transformation.
3. Fermentation: sugars are fermented through the use of yeast into ethanol. Six-carbon sugars can be easily converted into ethanol by using yeast. However, this is more difficult for five-carbon sugars and accordingly the NREL and the University of Florida are working in developing yeasts that can convert both six-carbon and five-carbon sugars into ethanol (Kerstetter & Lyons, 2001).
4. Concentration: the final step in the process is the concentration of the ethanol. In this process ethanol is separated from the fermentation achieving a concentration of up to 95% ethanol. The yield for this process will depend on the biomass being used. For the corn stover the process has an estimated yield of 320 liters per metric ton.
The processing cost is very dependent on the type of biomass. For instance, for sugar cane the processing cost ranges between $0.21 and $0.25 per liter while for lignocellulosic biomass it ranges between $0.31 and $0.38 per liter (Huber et al., 2006). These costs are still about twice of that for the equivalent fossil oil price which is why there is increasing pressures to reduce costs throughout the supply chain.
There have been some other attempts to find a more efficient process to convert biomass into ethanol although most of them are still in an experimental phase. One of these processes is Zeolite upgrading of sugars, which has been developed by researchers at Mobil (Huber et al., 2006)
1.6
Trade offs
This study covers the entire process, from converting biomass on the fields to gasohol at the distribution terminals. As is common with any supply chain analysis, we will look at the important trade-offs inherent in the supply chain, and how to characterize them. While we will look at each of these decisions in more detail in later chapters, the following list provides a quick background that will help the reader structure the discussion later in this thesis.
a. Transportation vs. Economies of Scale. Biomass refining, like crude oil refining, has inherent scale economies that encourage the construction of larger refineries. Balancing this is the fact that larger refineries will need more feedstock, and hence a larger area from which the feedstock is grown. This will increase both the inbound cost of feedstock transportation, as well as the risk of feedstock supply instability.
b. Storage location. The two feedstocks we study - switchgrass and wheat straw - are harvested only twice a year. The resulting biomass needs to be stored for the rest of the year. This can be done in near the fields where the feedstock is harvested, or near the biomass refinery. Other options include building intermediate storage units along with storage units at the refinery locations. The cost of feedstock storage will be determined by the choice made.
c. Capital cost of inventories: one of the key decisions in the design of a supply chain for biofuels is where to hold inventories. Is it more convenient to store it as a raw material, when it's cheaper but more subject to degradation or as a finished product, when it's more expensive and requires higher infrastructure?
Capital cost of investments in facilities: the production of ethanol from biomass requires extensive investment on facilities to process and store biomass and the finished goods. The investment required to build a 100 million gallon/year refining plant is around $100 million (Kerstetter & Lyons, 2001). Larger facilities could benefit for larger economies of scale but also at a larger capital cost of the investment.
2
Matching Demand and Supply
In this chapter we take a look at the sources of aggregate demand and supply within the United States. We also look at possible distribution strategies for cellulosic ethanol. Almost all of the ethanol being produced today is corn based, and concentrated around the mid-western states.
Cellulosic ethanol will be produced by other regions as well. These areas will need to use a combination of existing infrastructure and also new facilities built to support the expansion in ethanol use.
2.1
Aggregate Demand
Gasoline is reformulated with Methyl Tertiary Butyl Ether (MTBE) for two reasons. Firstly, it is used widely as an alternative to lead to enhance the octane number of gasoline. It is also used in higher concentrations in some areas to deal with smog and other air-pollution issues, as it imparts clean burning characteristics to gasoline. Due to recent concerns about the health impacts of MTBE, several states are replacing MTBE with ethanol to provide clean burning characteristics to gasoline. Aggregate demand is currently driven by the requirement of ethanol to serve as a replacement for MTBE. The popular versions are E10, which is 90% gasoline blended with 10% ethanol and E5.7 in which only 5.7% ethanol is used. E5.7 is used in California. 25 states have banned MTBE and more states are expected to follow suit. In this chapter, we estimate aggregate demand based on ethanol requirements as a replacement for MTBE.
Ethanol can also be used as a fuel in ethanol based vehicles. One such fuel is E85 which has 85% ethanol blended with 15% gasoline. This requires special infrastructure (car engines, gas terminals, etc.) as E85 is corrosive to current equipment. Most engines cannot handle such high concentrations of ethanol. The US has a small percentage of such vehicles. Brazil has a large proportion of vehicles that can use up to 100% ethanol as fuel. The growth of ethanol as a transport fuel beyond MTBE substitution will depend on the adoption of technologies that allow the use of more aggressive ethanol blends.
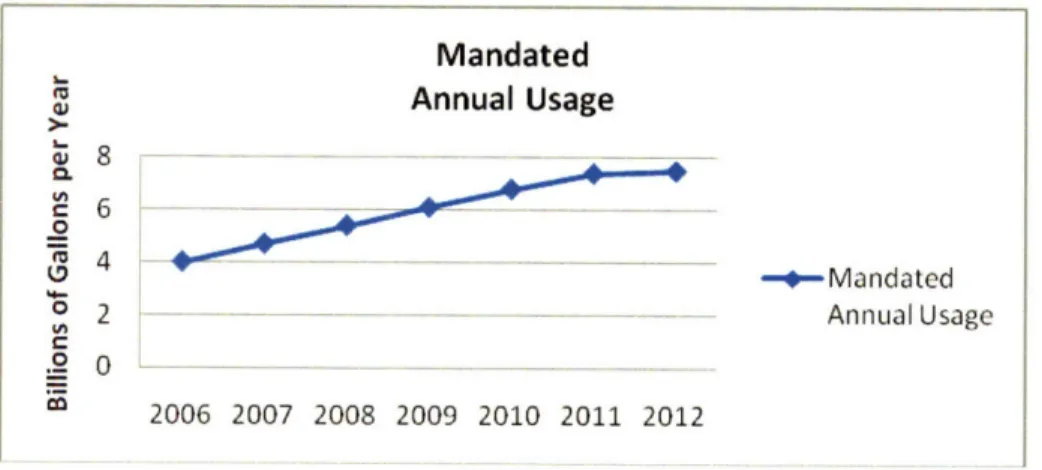
In the United States, two pieces of regulation are important in understanding the nature of ethanol demand. First is the Clean Air Act (CAA) of 1990 and second is the Energy Policy Act (EPA) of 2005. The CAA required the use of reformulated gasoline in urban areas with air pollution problems. The EPA, in turn, provides a mandate to triple the amount of ethanol that must be used in reformulated gasoline by 2012. Together, these two make for an explosive growth in the production and distribution of ethanol over the next decade or so. The following table shows the mandated use of ethanol according to the EPA (Scott D. Jensen, David C. Tamm, 2006). Mandated Annual Usage .2 - -- Mandated 2 .- -. - - -.- -. - Annual Usage 2006 2007 2008 2009 2010 2011 2012 co 2006 2007 2008 2009 2010 2011 2012
Figure 6: Growth in Mandated Usage
The CAA is being implemented in California, the East Coast, Dallas and Houston and some other areas. This is expected to grow as some other states implement CAA along with the MTBE ban. This map shows all states that have an active MTBE ban schedule in place.
Figure 7: States with MTBE ban schedules (dark states)
These states cumulatively constitute over 44% of the current MTBE consumption in the United States (Energy Information Administration, 2003). Several states have enacted their own specific legislation that mandates the use of ethanol by a combination of using ethanol as an oxygenate for the CAA and a ban on MTBE.
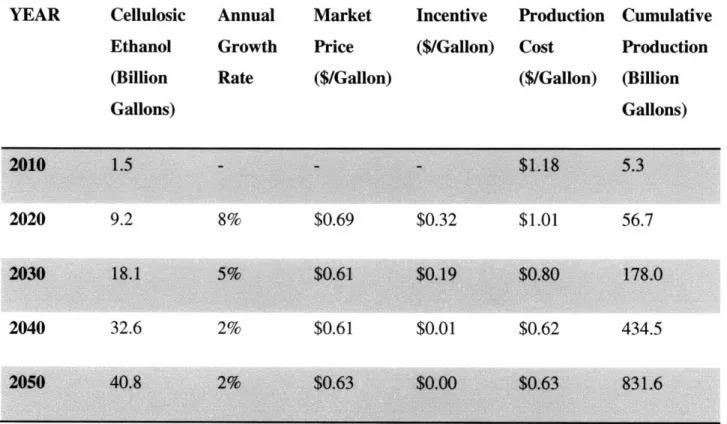
Combining the two acts, it is possible to come up with scenarios about future ethanol use. Here is the base scenario from an NREL study (Steiner, 2003). This table provides a scenario for the growth of cellulosic ethanol and the related production costs. We will revisit the production costs when we study the supply chain in greater depth in Chapter 4.
Y I i i ;i-~: '.·:'2· I i, i I -r- .. ,.i-·i-·-/
YEAR Cellulosic Annual Market Incentive Production Cumulative Ethanol Growth Price ($/Gallon) Cost Production
(Billion Rate ($/Gallon) ($/Gallon) (Billion
Gallons) Gallons) 2010 1.5 - $138 5.3 2020 9.2 8% $0.69 $0.32 $1.01 56.7 2030 18.1 5% $0.61 $0.19 $0.80 178.0 2040 32.6 2% $0.61 $0.01 $0.62 434.5 2050 40.8 2% $0.63 $0.00 $0.63 831.6
Figure 8: Ethanol Production (Volume and Cost). Source (Steiner, 2003)
The cost numbers here are just indicative, and have significant uncertainty built into them. We will do sensitivity analysis to understand the impact of this uncertainty later in chapter 4.
2.2
Aggregate Supply
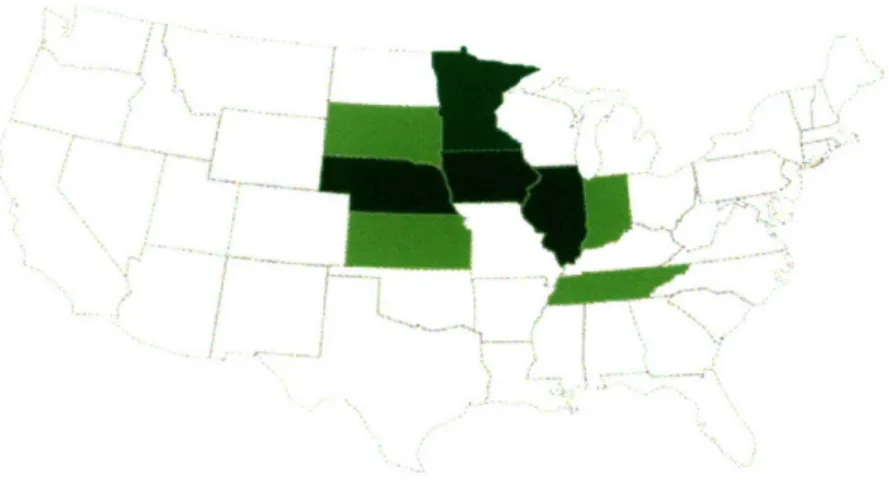
Currently, most of the supply is from corn based ethanol. The following map shows the 8 states most active in corn based ethanol manufacturing. These comprise of more than 96% of the total installed production capacity of ethanol today.
Figure 9: Current Ethanol Production (Darker shades mean more production)
Compare the current ethanol production picture to the figure below which shows the total area under wheat production by county.
Base acres (2002 only)Whea 2002-All States acres in county " *No Data .1 to 413 413 to 2,075 2,075 to 7,077 7,077 to 27,758 27,758 to 577,448 Source: USDNERS
Figure 10: Wheat Production by county
We can observe that the northern Great Plains, in particular the states of North Dakota, South Dakota and Montana have significant potential biomass supply. The possible quantity of the annual supply of biomass can be estimated by several parameters including the yield and soil
30
r ~~
·~·-conservation status. Equally interesting is to understand how ethanol produced in these parts of the country can be moved to the coasts, where most of the demand is. It is to this question that we turn next.
2.3
Transportation Strategies for Ethanol
Ethanol processed from wheat straw in North Dakota will find markets in the cities of California, the east coast as well as Houston and Dallas. Typically, gasoline will be transported to the same places, but using different infrastructure. A lot of the infrastructure in place for transporting gasoline cannot be used for ethanol. We begin by first describing the transportation of gasoline.
2.3.1 Gasoline Transport
Gasoline is transported from the refineries to the continental US via pipeline, trucks and rail cars. There are 2 major stages in the transport. In the primary stage, ethanol is transported via pipeline, rail or truck to bulk storage terminals. Ethanol is shipped to the same bulk storage terminal. The blending of gasoline and ethanol happens at these bulk storage terminals, and requires specialized equipment to monitor the quality of the blends.
2.3.2 Ethanol Transport
Ethanol can be transported in most of the basic modes including truck, train, barges and ships. Some or most of the routes within the US will involve two or more modes. In addition, as the market expands, we may expect ethanol to be shipped to and from product exchanges to provide access to different markets for far flung producers. These modes are described below.
Ships are the cheapest mode of transport to move ethanol from the gulf coast to the northeast market as well as the California market. According to Downstream Alternatives Inc. (2002) , ethanol can be shipped in vessels containing gasoline. Typically, such a vessel would transport 10.5 M Gallons. Distance from New Orleans to San Diego via the Panama Canal is 4,222 miles(Downstream Alternatives Inc., 2002). This means an average transit time of about
18 days. The transit time to New York harbor from New Orleans is about 6 to 7 days. There are different regulations for denatured ethanol and pure ethanol. The economics make pure ethanol easier to transport, but this may not be feasible due to lack of handling capacity at the receiving port.
There are two types of barges - inland barges and ocean barges. Inland barges are used on the Mississippi river and the connected waterways. These are currently used widely for ethanol transport from the mid-western states. For North Dakota and Idaho, the ethanol needs to be sent by train to the Mississippi. They usually carry 25 barges of approximately 10,000 barrels of ethanol capacity each (Downstream Alternatives Inc., 2002). Ocean barges are double the size of river barges. They are used for gasoline on the west coast, but not currently in use for ethanol. For plants located in North Dakota and Idaho, using barges means extra delay and handling at the ports, which will inevitably increase costs. However, this mode may be of interest when ethanol exchanges are constructed around the hubs.
Rail cars are usually of 30,000 gallons in size. There are various forms of service offered by the railroad companies, including single cars, gather trains and unit trains. Unit trains are the cheapest, and usually involve 95 cars carrying ethanol. Not all receiving terminals can handle unit trains, but these are commonly in use for larger refineries (with more than 100 M gallons per
year in capacity). Gather trains create a unit train from a number of smaller (2 to 3) refineries. The cost of putting together the gather train is borne by the refinery, and the rates for a gather train are higher per gallon of ethanol than a unit train. A single car of ethanol is usually only used for shorter distances and stop-gap measures rather than long distance bulk transport. There are 4 major railroad carriers in the United States, and atleast 2 of them, CSX and BNSF are increasing their capacity to transport ethanol from the mid-west and the norther great plains. It is interesting to note that the rail cars needed for ethanol transport are usually owned by the refinery and not by the railroad company. The refinery is responsible for loading the ethanol and the receiving terminal is responsible for unloading it.
A typical tanker carries around 8,000 gallons of ethanol. Trucks are usually used for transporting ethanol for short distances (200-300 miles) from source to loading terminals as well as to redistribute from a bulk receiving terminal to final retail locations or other smaller
terminals.
The differing capacities of each of the modes gives rise to the following equivalence:
1 ship (10.5M Gallons) = 4 unit trains (11M Gallons) = 25 river barges.
Due to the corrosive nature of ethanol, as well as its affinity for water, it is unlikely that ethanol will be transported through existing pipelines. The increasing volume of ethanol
transportation may cause these technical difficulties to be re-assessed. Another possibility is the emergence of biobutanol as a substitute for bioethanol. Biobutanol can be piped through existing pipelines with minimal retrofitting, and thus may make pipelines viable for biofuel transport.
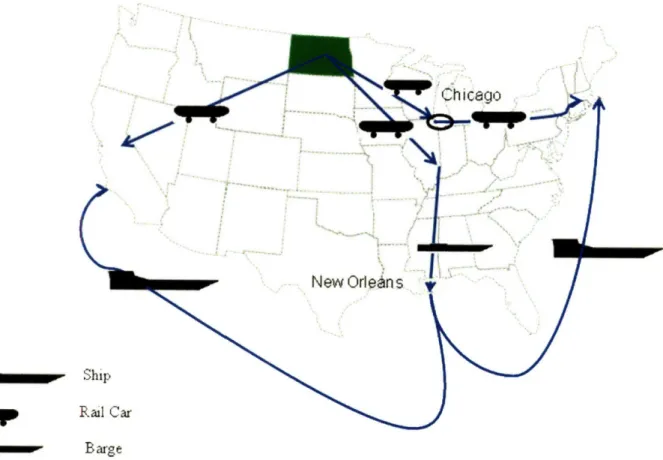
2.3.3 Transportation Routes from North Dakota
Combining the above modes, we can think of a few possibilities for transporting ethanol from North Dakota. We will make detailed cost estimation for the most likely mode (train) in chapter 4, but in this chapter we list the possibilities and the lead time implications of each of these possibilities.
1. North Dakota to California
a. Use a unit train or gather from one of the BNSF terminals. The turnaround time is 12 days, and each train will carry 2.85M gallons of ethanol.
b. Send the ethanol from North Dakota to a port on the Mississippi. From there, the ethanol is loaded on to a barge and sent down to New Orleans. At New Orleans, there
is another transfer to a large ocean barge or a ship. The total transportation time will depend on the delays at the transfer locations, but the time by ocean from the gulf coast to California via the Panama Canal is more than 2 weeks.
2. North Dakota to the North East
a. Use a BNSF unit train to transport the ethanol to Chicago. From Chicago, the train is transported on CSX owned tracks.
b. Use the combination of train-barge-ship that was used for California. For the east coast the transit times by ship are less than half of that of San Diego.
Chicago 1 e/ New Orieans v
w
B argeFigure 11: Ethanol transport from North Dakota
11,11,900,000
iooý;
Description of the supply chain
The previous chapter described the aggregate characteristics of the ethanol industry in the US. In this chapter we will take a more detailed view of the supply chain by describing the various stages involved. The diagram below is a schematic showing these stages.
SedPouctio
DA
U:
Ehn
Figure 12: The biofuel supply chain
As shown in the diagram, the supply chain for agricultural residue and energy crop based ethanol starts with seeds and ends with the distribution of reformulated gasoline to retail stations. Today, all the different stages have different players. With the rising volume in ethanol
production and consumption, these entities will compete among themselves to capture the value being created. These players are not equal in terms of their competitive and bargaining powers. We therefore present a strategic analysis of the industry to understand how profits will be distributed, and where the most profitable part of the supply chain is. This is especially of value to companies deciding in which part of the supply chain they wish to engage in.
3.1
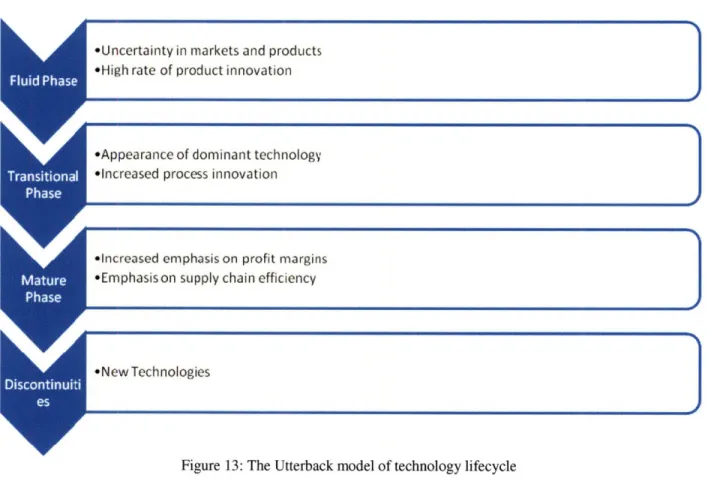
Competitive Analysis
The bioethanol industry, in many ways, is similar to high technology industries. The dynamics of industry evolution in high technology products was studied and presented by Roberts, (2001). There are four stages of market evolution, and these stages are different from each other in the
36
pace of technological innovation and the strategies followed by the key players in the market. The following graphic show these four phases.
*New Technologies
Figure 13: The Utterback model of technology lifecycle
3.1.1 Fluid Phase
Currently the cellulosic bioethanol industry is in the fluid stage. The state of the art in processing technology is being driven by small startup companies which are trying to improve the yield and reliability of the production process. These include companies working on plant genomics (to create better energy crops) to companies working on microbes that provide better yield of ethanol per ton of biomass produced. These companies are usually located near research universities and are different from the traditional oil and gas companies in many ways. To succeed, these companies need faster acceptance and an increased access to the end gasoline
market. For this the innovators will often form marketing alliances with the key player in the supply chain, i.e. traditional energy firms. Over the next several years, some of these
technologies will become available for commercial use, while many others will fail. One attractive alternative is to form an R&D alliance with the important startup companies and research universities. This may include minority equity investments. (Roberts, 2001). The key levers for advantage at this stage are an access to the thought leaders in the emerging
technologies, as well as an understanding of the operational aspects of processing cellulosic feedstock that can be used to make later decisions in technology investments.
3.1.2 Transitional Phase
As the processing technologies for cellulosic ethanol reaches some standardization, the focus will move to leverage existing infrastructure to provide a reliable supply of ethanol. In the transitional phase, the main lever for advantage is to ensure product availability. This would mean that a distributor would have to potentially collaborate with a number of small refining companies, creating supply contracts and marketing agreements. The distributor could also
signal its long term interests in specific geographic areas by making focused investments in processing and distribution capacity. Of course, the extent to which this strategy will make sense will depend on the existing infrastructure and position of the distributor in ethanol markets.
In this stage, there is also likely to be significant acquisition activities, and it is here that the partnerships built in the fluid stage come of use. There are some firms in the market today, like Delta-T (Delta-T, 2007), which are selling complete ethanol processing plants. This will significantly reduce the barriers to entry and make technology licensing the most viable option
for the innovators. This phase is also likely to see competition between traditional corn based ethanol plants, being retrofitted to refine the cellulosic part of the feedstock, and new plants that
are built to work on just cellulosic feedstock. The advantage in this market will belong to players that adapt to winning technologies early and build market share.
3.1.3 Mature Phase
One of the important insights from the relative diseconomies of inbound transportation of feedstock versus the economies of scale of refining is that most refineries will source feedstock from within 50 miles. This number is discussed later, in chapter 4, but for now this indicates that the ethanol refining industry has a high potential to develop in a distributed and possibly
fragmented pattern. The mature phase will thus see the margins eroded from refiners, and most of the value being captured by the distributors. While this is likely due to the fragmented nature of the refining business, the biofuel business is also likely to be disrupted again and again over the coming decades.
3.1.4 Disruption Phase
There are significant opportunities to disrupt cellulosic ethanol technologies at any stage of its development. These include new products (like biobutanol), new processing technology, new feedstock sources (possibly genetically modified) and also new business models. In this respect, the biofuels market can look at the evolution of the high technology industry evolution over the greater part of the last century for strategies that succeeded.
Success in the longer term will require a strategy involving two key elements. 39
* Sustained innovation in biofuel related technologies. The strategy will involve creating stakes in promising current research activities.
* Stability of ethanol supply in the longer term.
The stability of supply will involve multiple sources of feedstock supplies as well as multiple ethanol refineries. In the US market it is unlikely that any player would want to
integrate vertically, due to the vast disparity in the technologies and competencies in the different stages. Yet the most successful player will be able to build sustained relationships and stakes with the players in these different stages. Building these relationships will require some detailed understanding of the competitive position of each of the stages in the value chain.
3.2
Seed Production
Seed technologies for grain crops like wheat have been historically optimized towards higher production of grain. However, the yield of cellulosic biomass per unit harvested area is an
important factor in the eventual cost of delivered ethanol. Hence there is an expectation that seed technology will deliver improvements in the yield of energy crops like switchgrass. The existing agri-businesses in seed production are large science based corporations like Syngenta and
Monsanto. These companies are investing in next generation biofuel technologies, but there is an opportunity for someone to acquire intellectual property around energy crops by "shopping" for startups. There are many startups addressing all areas of yield improvement, like Ceres (Ceres Inc, 2006). Through acquisitions, other parties in the chain may get hold of these technologies. In such a case the position of the large seed companies could be weakened. There are other factors which may work to undermine the competitive advantage of large agri-businesses as well. One
being the new generations of production and harvesting technology that promises to deliver yield improvements to regular seeds.
While entrepreneurial activity in the yield improvement area can undermine the bargaining position of large corporations, it is likely that these corporations will retain tremendous influence over the entire supply chain. Part of this is because that apart from
intellectual property in the form of patents, large agri-businesses own the distribution channels. It will be difficult for smaller firms to sell to farmers without the reach or reputation of established firms. Besides, companies like DuPont are active in other areas of the supply chain like refining. DuPont is working with British Petroleum in and also developing alternatives to ethanol like biobutanol. (DuPont, 2007)
3.3
Farming and Harvesting.
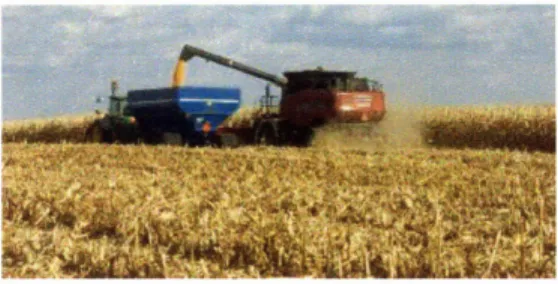
Wheat in the US is classified by the time in which it is planted. The two varieties are winter and spring wheat. Winter wheat is harvested in the summer. Spring wheat, used more in the Northern Plains, is harvested in late summer or fall. Harvesting of wheat is highly mechanized, and the harvesting of straw is also a well studied area. There are two basic approaches to collecting wheat straw (Kadam, 2000):
1. Simultaneous collection of grain and residue, also known as the total harvest method.
Figure 14: Combine Harvesting of Wheat
The most common practice is the post-harvest collection of straw. The grain harvest operations create "winrows" which are rows of straw in the field. These are then raked and baled. Baling creates bundles of straw. The size and density of these bales are discussed in chapter 4. These bales are then transported using trucks to the local refinery. The cost of the farming and harvesting operations are also discussed in chapter 4.
The farming of wheat is done for the value of the grain, and switchgrass is usually grown under conservation programs, aided by rent paid to not grow more intensive crops. The use of agricultural residues and energy crops creates new sources of revenue for the farmer. The value of the biomass will be determined by several factors, including its proximity to a refinery, its quality and availability. And most importantly, there will be an important dynamic between the seed producer, the refiner and the farmer to capture the value from the biomass being grown.
Traditionally governments and companies were able to buy or appropriate land if they needed to do so. It might be easier if the need is for energy and energy security. However, if we assume that the farmer is still the owner of the land in the 50-mile radius around the plant, then the position of the farmer becomes stronger. Most of the other parties in the chain will not be interested in buying and managing land. So even if in theory it is not hard to do, the other parties in the chain may lack the motivation to become landowners. Farmers have alternative uses for
the land - food and animal feed. Hence we expect that farmers will probably hold more power in this chain than they do in the traditional food supply chain.
The bargaining power of farmers will be seriously undermined if they need to buy energy-crops protected by patents, in which case their share of the margin may be driven down by high seed prices. If the process at the local consuming refinery is specific to a single feed, and the facility has been designed in such way that it will rely on the 50-mile radius suppliers, then the threat from substitution for the farmer is lower. If the process is flexible and can accept different feed and logistics costs are such that using woodchip or other feed is economical, then the threat of substitution becomes higher, and in this case the farmer will face pricing pressure. One possibility is that farming co-operatives license refining technology and become players in a bigger part of the supply chain by setting up biorefineries. This would increase their bargaining power, and make for an interesting interplay between the owners of the intellectual property in biofuels (seeds and refining) with the manufacturers of biofuels.
3.4
Biomass Transport and Storage
Biomass transport is currently done by trucks. The costs for truck transportation of biomass are considered in detail in chapter IV. The following picture shows a trailer transporting bales.
Figure 16: Trailer transportation of bales
For storage, there can be two scenarios. In the first scenario, harvesting and baling
operations are done by individual farms, and storage is mostly on farm, with bales stacked on top of each other. This is shown in the following picture.
Figure 17: Field storage of bales of wheat straw
The second scenario would have a central refinery doing baling and storage of straw. In this case the storage locations will be near a refinery and will serve that refinery only. This would imply higher costs for storing the straw, but at the same time ensure better conditions and hence higher quality of feedstock for the refinery compared to open field storage.
We expect the straw transportation and storage stage to have similar characteristics as the farming stage. In this stage, the main value being added is the preservation of the biomass between harvesting and eventual consumption. There might be future technologies that pre-process the biomass at the storage centers to improve the inbound logistics cost to the refinery.
either case, the value added will not be very significant. It is our view that this part of the supply chain will be owned by the weaker players in the supply chain.
3.5
Refining
For refineries, the location and ability of the refining process to handle different feeds without compromising quality of the final products will determine the strength of the refining step in the chain. The technology behind cellulosic ethanol is still evolving. It will be interesting to see if the technology is licensed out to manufacturers or used directly by the inventors of the
technology. If it is the former, we would expect relatively lower barriers to entry and hence increased competition. In any case, we expect that capital requirements would present some barriers to entry, though not very significant in the longer run when conversion technologies are proven and well tested.
The buyers of ethanol are terminal operators and energy companies. In case of excess supply of ethanol or excess refining capacity, these players would have significant power to reduce the profitability of the refineries. It is our expectation that the refining industry will be fragmented, and hence there is a possibility of overinvestment and overcapacity in ethanol. Currently, ethanol is being pushed as a clean alternative to MTBE. However, ethanol has
competition from other compounds for MTBE substitution as well as other forms of clean energy and even improved efficiency of gasoline use.
3.6
Ethanol Transport
Land locked states have to use railroads to transport ethanol to the main demand areas. This means that a majority of ethanol will be transported by rail in the foreseeable future. This gives the railroad companies some power to erode the profitability of refineries as well as energy companies. This is especially true for markets only reachable through one major railroad.
The substitutes for railroad are trucks, barges and pipelines. Trucks are more expensive, but provide an upper limit to the prices charged by railroad companies. Barges are useful only for certain routes (accessible by water). Pipeline is much cheaper, but will require significant investment to get started for bioethanol. There is another possibility, in which existing bio-ethanol plants are retrofitted to produce biobutanol, which can be transported using existing gasoline infrastructure, including pipelines.
3.7
Distribution
The distribution of ethanol will become one of the most important sectors in the supply chain. This is because current distributors have access to the markets and the infrastructure required. The demand for ethanol is being driven by government mandate. Gasoline distribution
companies are in a significant position to capture a large part of the value from this supply chain.
3.8
Strategic Inference
The value chain for cellulosic ethanol is diverse. Several of the key components are still evolving rapidly, most important among which are processing technology, transportation capacity and
bulk storage terminal capacity. The most important forces that will shape the strategic outcomes in this industry are:
1. The importance of process technology. The economics of cellulosic ethanol will be determined by process technology more than anything else.
2. Local advantages to processing. Favorable access to waterways or feedstock supply will determine the suitability of a region to biofuel refining. This also ties in with the fact that there are limited economies of scale in refining.
3. Growth in ethanol consumption will be shaped by environmental considerations and the various regulations. For the near future, most of the demand will be concentrated around major metropolis in California, New York and Texas.
In such a dynamic scenario, the best option is to build sustained advantage by strong alliances with different partners within the supply chain.
4
Methodology and Cost model
To determine the unit cost of producing Ethanol we determined several alternatives based on the available crops and the available technology. For simplicity and based on their characteristics and relative importance as a source of biomass, we have selected a residue, wheat straw, and a dedicated crop, switchgrass.
As mentioned earlier these two crops are very representative of the second generation of biomass. One crop, wheat straw, is relatively inexpensive as it can be considered a residue of the wheat production and therefore can be easily available in large quantities. The second crop, switchgrass, was selected because it is one of the perennial grasses with the better potential due to its high yields. Additionally, switchgrass has been one of the most researched energy crops by national programs.
to
4.1
Wheat straw
1O
Figure 18: Ethanol Supply Chain
To determine the costs of producing ethanol from wheat straw we based our calculation on parameters obtained for the state of Idaho. The main parameters our model uses are biomass yields, production costs, harvesting costs, transportation costs, biomass to ethanol conversion factors and distances from field to plant and from plant to terminal. Some of these are entered directly into our model and some others are calculated based on some of the previous parameters.
4.1.1 Production
To determine the production costs for the wheat straw, we used different scenarios based on a range of parameters. We started by defining a base size for a refining plant. Based on this size, we determined the required acreage and average distance from the field to the plant, based on
49
1*
Prdcto
L
-I
Hi-vs
Refining/Zý
ProcessinL,,
Trnpr
productivity parameters such as wheat yield, conversion factor of wheat to straw, conversion factor of biomass into ethanol and percentage of the land dedicated to production of the crops.
This way we defined a pessimistic scenario based on more conservative values for yields, costs and productivities; and optimistic scenario, based on more aggressive values; and finally an average scenario which considers the values more commonly used for the above mentioned parameters.
For these three scenarios, we first calculated the production of wheat in Idaho and later based on this number we obtained the amount of wheat straw available as a residue of the wheat
production. To determine the production of wheat for the three scenarios we used the
information from the US Department of Agriculture for the state of Idaho corresponding to the year 2004. For the pessimistic scenario we used the average yield of the Bear Lake County. For the optimistic scenario we used the yield of the Twin Falls County. Finally to calculate the wheat production for the average scenario we used the average yield for the whole state of Idaho.
Table 1: Wheat yields by scenario
Scenario Pessimistic scenario Average scenario Optimistic scenario Yield [lb/acre] ([ton/acre]) 1,830 (0.915) 5,130 (2.565) 7,452 (3.726)
Other parameters we considered are the percentage of land that is unusable and
percentage of the land that corresponds to usable crops. We considered that about 4% of the land is unusable since it will correspond to houses, roads, ponds, etc. and that the usable land that can