Publisher’s version / Version de l'éditeur:
Vous avez des questions? Nous pouvons vous aider. Pour communiquer directement avec un auteur, consultez la première page de la revue dans laquelle son article a été publié afin de trouver ses coordonnées. Si vous n’arrivez pas à les repérer, communiquez avec nous à PublicationsArchive-ArchivesPublications@nrc-cnrc.gc.ca.
Questions? Contact the NRC Publications Archive team at
PublicationsArchive-ArchivesPublications@nrc-cnrc.gc.ca. If you wish to email the authors directly, please see the first page of the publication for their contact information.
https://publications-cnrc.canada.ca/fra/droits
L’accès à ce site Web et l’utilisation de son contenu sont assujettis aux conditions présentées dans le site LISEZ CES CONDITIONS ATTENTIVEMENT AVANT D’UTILISER CE SITE WEB.
17th World Conference on Nondestructive Testing [Proceedings], pp. 1-8, 2008
READ THESE TERMS AND CONDITIONS CAREFULLY BEFORE USING THIS WEBSITE. https://nrc-publications.canada.ca/eng/copyright
NRC Publications Archive Record / Notice des Archives des publications du CNRC :
https://nrc-publications.canada.ca/eng/view/object/?id=d3512aba-8ceb-43fd-a7aa-d991e39898fa https://publications-cnrc.canada.ca/fra/voir/objet/?id=d3512aba-8ceb-43fd-a7aa-d991e39898fa
NRC Publications Archive
Archives des publications du CNRC
This publication could be one of several versions: author’s original, accepted manuscript or the publisher’s version. / La version de cette publication peut être l’une des suivantes : la version prépublication de l’auteur, la version acceptée du manuscrit ou la version de l’éditeur.
Access and use of this website and the material on it are subject to the Terms and Conditions set forth at
Applications of Laser-Ultrasonics to the Automotive Industry
17th World Conference on Nondestructive Testing, 25-28 Oct 2008, Shanghai, China
Applications of Laser-Ultrasonics to the Automotive Industry
A. BLOUIN, S. E. KRUGER, D. LÉÉÉÉVESQUE and J.-P. MONCHALIN
Industrial Materials Institute, National Research Council of Canada 75 de Mortagne blvd, Boucherville, Quebec, Canada, J4B 6Y4 Phone: (450) 641-5076, Fax: (450) 641-5106, e-mail: silvio.kruger@cnrc-nrc.gc.ca
Abstract
Laser-ultrasonics, which uses lasers for the generation and detection of ultrasound is now a mature nondestructive technique for evaluation of materials and structures. This technique works at a distance, without surface preparation, and is then specially adapted to inspect moving and hot parts of complex geometrical shapes. Applications of laser-ultrasonics to the automotive industry have been rarely reported, and this paper is aimed to present some applications developed at the Industrial Materials Institute of the National Research Council of Canada. A first application is the evaluation of weld integrity. Welds produced by different methods such as laser stitches, spot welding, friction stir welding as well as conventional MIG welding were tested by the technique, and some examples are presented. A second application that has been explored is the evaluation of the magnesium/aluminum interface of a novel engine crankcase casting, in which delaminated and well bonded zones were clearly separated in the laser-ultrasonic images. A third application is the measurement of paint thickness, not only when it is dried but also following application when it is still wet. For this application, thickness can be obtained following a spectroscopic analysis of the laser-ultrasonic data. Finally, adhesive bonding is a new trend in the automotive industry and results are presented on the assessment of bond strength.
Keywords: Laser-ultrasonics, Automobile NDT, Automobile process control, Weld inspection.
1. Introduction
NDT for automotive industry has not been a primary branch for the non-destructive business for multiple reasons. One of the reasons is that, as a high volume and very cost sensitive industry, the automotive manufacturers often see NDT as an obstacle to the high productivity level necessary in this very competitive industry. But this reality is likely to change as new NDT methods like laser-ultrasonics, which is truly non-contact, can be introduced in the production chain with little effect on production pace. Also, as new more complex materials and joining processes are being adopted on the automotive industry, NDT can be a very effective way of assuring their reliability and repeatability to accelerate their acceptance. Although the consequences of a failure on an automobile is less critical than that found in an airplane and a nuclear reactor, a quick observation of the automobile market shows that companies that are growing and increasing market share are those for which the consumers perception of quality and reliability are higher, and the role of NDT to enhance the reliability in the automotive industry has recently been discussed[1,2].
In this paper, applications of the laser-ultrasonic technique to the automotive industry are reviewed with results obtained at the Industrial Materials Institute of the National Research
Council of Canada. The principles and applications of the technique can be found in reference [3]. Applications to other industries, like aerospace and metallurgy, are further detailed in references [4,5].
2. Weld Inspection
While types of welds like conventional MIG and more advanced laser-stitches have been successfully characterized by laser-ultrasonics, we limit our discussions in this section to results for spot welding and friction stir welding.
2.1 Spot welds
Spot welding is widely used in the appliance, aeronautic and automobile industries. In particular, car bodies are largely assembled by spot welding. Although the process is reasonably well controlled, bad welds may occur and may result in some cases, at a very high cost, in the rejection of the whole welded assembly. In industry, spot welds are usually evaluated by destructive peel tests in which the sample is simply pulled apart; if the weld is good, one of the sheets will tear around the weld nugget whose width can then be measured. Development work has shown that ultrasonic-based non destructive methods may be useful for assessing weld integrity, but present some difficulties of implementation due essentially to the contact nature of piezoelectric transducers. Laser-ultrasonics makes ultrasonic coupling much easier and appears as a practical alternative to piezoelectric based ultrasonics.
a) b) 0.00 0.50 1.00 1.50 2.00 2.50 Time (µs) SU STICK LTM MIN NOM NO WELD 0.0000 0.2000 0.4000 0.6000 0.8000 1.0000
SU NOM MIN LTM Stick
Spot weld classification
R a ti o ( U 1 /U 2 ) B-scan Single shot
FIGURE 1. (a) Laser-ultrasonic signals obtained on 5 welds varying from good to bad: SetUp, NOMinal,
MINimum, Less Than Minimum and Stick. (b). Ratio of the interface echo over the backwall echo at a single location measurement and average over the welded area (B-scan).
Figure 1a shows the ultrasonic signals obtained for 5 weld qualities, varying from good to bad and named SetUp, NOMinal, MINimum, Less Than Minimum and Stick. The sample was made from 0.8 mm thick steel plates. The sample was installed on a translation stage and scanned over the welded region with a step size of 1 mm. The first signal on the top was obtained outside the weld region and is used as a reference. The echo at 0.25 µs corresponds to a round trip of the ultrasonic wave across the first plate, the echo at 0.75 µs corresponds to three round trips across this plate and so on. We named them odd echoes. On the other hand, the echoes at 0.5 µs (1 µs, 1.5 µs,…) come from two different sources. They correspond to two (four, six,…) round trips in the first plate and also to one (two, three,…) round trips through the weld and are
named even echoes. As expected, the amplitude of the odd echoes gets stronger as we move from the lower curve (good weld) to the top curve (bad weld). The quality of the weld can be estimated by using the ratio of the reflected signal at the interface (first odd echo) normalized with respect to the wave transmitted through the weld (first even echo). In Figure 1b, this ratio has been plotted using single shot results obtained when the laser spots are at the center of each weld (gray bars) and using B-scan data taken over the welded region (black bars). In the latter case, since the step size of the scans was 1 mm, several measurements were made inside each weld, so an average ratio across the weld was calculated. The quality of the welds can be clearly separated in two classes: a first class including the welds labeled "SU", "NOM" and "MIN" and a second class including the welds labeled "LTM" and "STICK.
2.2 Friction stir welds
Friction stir welding (FSW) is a solid-state joining process that has found extensive applications in recent years. It is an emerging manufacturing technology that allows creating lighter structures at lower cost than traditional methods. As shown in Figure 2, FSW uses a specially shaped rotating tool consisting of a pin and a shoulder to produce the weld. The motion of the welding tool on the metal plate, usually aluminum, generates frictional heat that creates a plasticized region around the immersed portion of the tool (pin) to produce lap or butt joints. However, with changes in material conditions or welding parameters, discontinuities such as wormholes, lack of penetration, hooking or voids can be formed. A more difficult situation is the presence of joint line remnants also called kissing bonds which are due to the presence of entrapped oxide layers and resulting in inferior mechanical properties in the weld nugget[6].
FIGURE 2. Schematic of the principle of FSW (butt joint).
A laser-ultrasonic technique combined with Synthetic Aperture Focusing Technique (SAFT) algorithm has recently been proposed for the nondestructive detection of such defects[7]. Data acquisition over a line across the weld at regular intervals is made followed by numerical focusing to get better resolved C-scan and B-scan images. Figure 3 shows an ultrasonic SAFT image of a cross-section and corresponding metallography of a lap joint of aluminum. Scanning was performed from the side opposite to tool with a picosecond laser producing ultrasonic frequencies up to 220 MHz. The presence of hooking in the advancing side as well as indications of a wormhole below the interface are clearly visible. A wormhole occurs when the ratio between the welding speed and the tool rotation speed is too high or too low. Also, SAFT reconstruction is found very useful for the identification of hooking defect by properly reducing
the size of indications having a parabolic shape. Moreover, a kissing bond present in the weld is detected by laser-ultrasonics as a slight reflection along the interface on the left side.
a) b)
FIGURE 3. Cross-section of a lap joint with some defects. a) SAFT image and b) corresponding metallography.
Figure 4 shows a SAFT image and the corresponding metallography of a cross-section of a butt joint with a lack of penetration (LOP). With a lower frequency content, these measurements were made on the tool side to detect the LOP on the opposite side. The LOP is well observed and appears as a lack of signal of the longitudinal wave near the bottom surface. From metallography, the LOP shown has a width of about 10 µm and a depth of 0.6 mm, but the detection of a 0.3 mm deep LOP in a similar specimen was also observed.
a) b)
FIGURE 4. Cross-section of a butt joint showing a lack of penetration. a) SAFT image and b) corresponding
metallography.
3. Dual Metal Casting Inspection
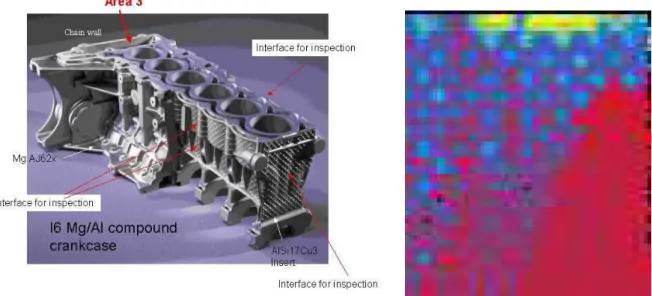
In the search for a lighter automotive engine, a Magnesium/Aluminum composite design has been proposed by BMW group for the single heaviest component, i.e. the cylinder crankcase. The manufacturing method consists to make the cylinder barrels, the main bearings and the water jacket from a hypereutectic aluminum alloy and to subsequently cast magnesium around it in a die-casting process. Laser-ultrasonics was used to assess the metallurgical bond between both materials in the part by finding voids at the Mg-Al interface[8].
Figure 5a shows an image of the crankcase, including the locations of the inspected areas. Figure 5b shows a C-scan laser-ultrasonic image taken in Area 3. The C-scan was obtained from a cross-correlation of the ultrasonic signal with a reference echo taken in the debonded region of Area 3. According to the impedances of the Mg, Al and air, an inversion of the polarity of the ultrasonic echo reflected at the Mg-Al interface is expected between well-bonded and debonded interfaces. This inversion feature makes the method much more robust than any amplitude
related criteria. The C-scan image clearly delimits the regions with and without voids at the Mg-Al interface. The void-free region appears in red at the bottom right section of the image.
FIGURE 5. a) Image of the engine and of the inspected areas and b) C-scan image in Area 3. The blue color is
positive and indicates a debonded region.
4. Paint Inspection
Another application that has been explored was the measurement of paint thickness, not only when it is dried but also following application when it is still wet. The process of paint application in the automotive industry involves many steps and 4 different paint layers namely, E-coat, primer, basecoat and clearcoat. An insufficient or excess application of one layer may imply that the vehicle be recoated, therefore making the material and labor costs quite significant. For this purpose, the on-line measurement of the thickness of wet paint layers is sought so the painting process could be efficiently controlled. A laser-ultrasonic system would be able to work in the hostile environment of a factory paint booth without performance degradation.
With measurements in a thin multilayer, the ultrasonic echoes usually cannot be separated out and identified in the time domain. The paint thickness is therefore obtained using an resonance spectroscopy approach in the frequency domain. The choice of an optimal laser source is also a concern with respect to the efficiency of sound generation for any wet basecoat. Laser-ultrasonic measurements were performed with different laser sources namely, CO2, KrF Excimer and Nd-YAG, on planar coupons having a wet layer of the basecoat on top of dry layers of E-coat and primer. With each laser source, data were collected at different times, with different thicknesses of the basecoat. Also different basecoats were tested, in particular the difficult water-based paints with high metal contents of colors green, red, gold, silver and white. In general, fumes were observed at generation, which can disturb detection but do not cause significant damage on the paint surface.
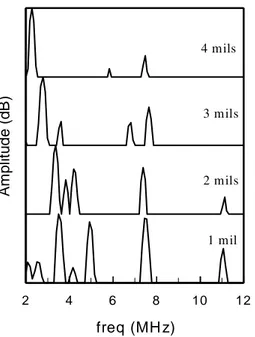
Figure 6 shows the amplitude spectra obtained using the KrF Excimer laser source for different thicknesses of the gold basecoat 1 minute after application. Spectra are presented with an amplitude window of 24 dB (logarithmic scale) between consecutive vertical divisions. Globally, resonance peaks progressively moves to lower frequencies with increasing basecoat thickness. This clearly indicates that resonance peak positions may serve to evaluate wet
basecoat thickness. However, one notices for the case 3 mils (about 76 µm) thick, an additional peak near 7 MHz that causes a shift of the one already present and which is attributed to the steel layer alone. This is the result of mode coupling as predicted using a model for propagation in multilayers[9]. Such a model is generally required to obtain accurate thickness estimates with this approach. 2 4 6 8 10 12 freq (MH z) A m p lit u d e ( d B ) 1 mil 2 mils 3 mils 4 mils
FIGURE 6. Amplitude spectra obtained with a KrF Excimer laser for different thicknesses of the basecoat after 1
min. The vertical scale is 24 dB/interval and 1 mil corresponds to 25.4 µm.
5. Adhesive bond strength
Adhesive bonding is a new trend in the automotive industry with the promise to keep high strength joints and reduce the vehicle weight. However, there remains the need to make the industry more confident in using adhesives and to understand how adhesives behave as a structural element in a car assembly. Nondestructive methods to evaluate adhesive strength include linear and non-linear ultrasound. Recently a method based in using much higher amplitude waves (shock waves) has been proposed [10,11]. In this paper we present the use of the resonance spectroscopy approach for the nondestructive evaluation of metal-polymer-metal structures. The signal is analyzed in the frequency domain with a model for propagation in a multilayer that includes the presence of interphases between layers[9]. The method allows detecting flaws, but most of all, it leads to a quantitative evaluation of the adhesion anywhere in the inspected zone. A parameter characteristic of the interphase, the specific stiffness, S, in units of N/m3, can be extracted from measurement data and used as a criterion for bond integrity, but also for designing processes and materials.
Figure 7 shows an example of measured amplitude spectrum compared with different spectra obtained from the model varying the S parameter. In this example, the S value that matches best the measured spectrum, more importantly resonance positions, was found to be S = 11.2 x 10¹⁴ N/m3. The multilayer structure studied was Aluminum (0.3 Polypropylene (0.1 mm)-Aluminum (0.3 mm), and several samples were prepared with different concentrations of grafting chains, c, in the polypropylene matrix and process temperatures, T. The total thickness of the structure was kept the same for all samples after applying pressure during the preparation.
Figure 8a shows the S parameter as a function of the concentration of grafting chains. Related to polymer interdiffusion, the occurrence of higher bond strength regime was found for concentrations larger than 5 %. Figure 8b shows a comparison of the energy (per unit area) for breaking of bonds in a destructive peel test for some samples and the adhesion parameter S, showing a good correlation between the nondestructive technique and the destructive peel test.
0 10 20 30 40 50 f (MHz) T p ( d B ) S (1014 N/m3) 100 11.2 5.0
FIGURE 7. Comparison of measured spectrum (in red) with different spectra obtained from the model varying the
S parameter. 10-2 10-1 100 101 102 c (% w ) 10 2 3 4 5 6 7 8 100 S ( 1 0 1 4 N /m 3 ) 0 10 20 30 40 50 S (1014 N/m3) 0.0 0.5 1.0 1.5 2.0 2.5 3.0 W ( kJ /m 2 )
FIGURE 8. a) Adhesion parameter S as a function of the concentration of grafting chains in Al-PP-Al structures.
b) Comparison of peel test energy and S parameter for some samples.
Applications of laser-ultrasonics for weld and adhesion evaluation, void detection in crankcase and paint thickness measurements have been reported. These results show that laser-ultrasonics can be at the basis of methods for quality control inspection as well as process control to improve reliability in the automotive industry.
References
[1] D. L. Hopkins and USAMP NDE Steering Committee, Reliability in High Volume Manufacturing: An Automotive Perspective, Materials Evaluation, 65 (12), pp. 1186-1190, 2007.
[2] W. Charron, C. Dasch, G. Harmon, D. Hopkins, G. Mozurkewich, J. Prindiville, J. Quinn and A. Wexler, Strategic Plan for Nondestructive Evaluation Development in the North American Automotive Industry, USAMP Report, Southfield, Michigan, 2006.
[3] J.-P. Monchalin, Laser-Ultrasonics: From the Laboratory to Industry, Review of Progress in Quantitative NDE, Vol. 23, eds. D. O. Thompson and D. E. Chimenti, AIP, New York, pp. 3-31, 2004.
[4] M. Dubois and T. E. Drake, Super High Quality Laser-ultrasound Signals for Aircraft Component Inspection, Journal de Physique, 125, pp. 312-320, 2005.
[5] S. E. Kruger et al., On-line Monitoring of Wall Thickness and Austenite Grain Size on a Seamless Tubing Production Line at The Timken Co, Iron and Steel Technology, 2 (10), pp. 25-31, 2005.
[6] Y.S. Sato, H. Takauchi, S.H.C. Park and H. Kokawa, “Characteristics of the kissing-bond in friction stir welded Al alloy 1050”, Mat. Sci. Eng., Vol. A 405, 333-338, 2005.
[7] D. Lévesque, L. Dubourg, C. Mandache, S.E. Kruger, M. Lord, A. Merati, M. Jahazi and J.-P. Monchalin, “Synthetic aperture focusing technique for the ultrasonic evaluation of friction stir welds”, Review of Progress in Quantitative NDE Vol. 27, ed. by D.O. Thompson and D.E. Chimenti, AIP Conf. Proc., New York, pp. 263-270, 2008.
[8] A. Blouin, D. Lévesque, J.-P. Monchalin, E. Baril and A. Fischersworring-Bunk, “Laser-ultrasonic inspection of Mg/Al castings”, Review of Progress in Quantitative NDE, Vol. 24, ed. by D.O. Thompson and D.E. Chimenti, AIP Conf. Proc., New York , pp. 1264-1271, 2005.
[9] D. Lévesque and L. Piché, “A robust transfer matrix formulation for the ultrasonic response of multilayered absorbing media”, J. Acoust. Soc. Am., 92, pp. 452-467, 1992. [10] M. Arrigoni et al. Adhesive Bond Testing by Laser Induced Shock Waves, This
proceeding.
[11] R. Bossi et Al, Laser Bond Inspection Device for Composites : Has the Holy Grail Been Found?, NTIAC Newsletter, Volume 30 (2), June 2005.