1
Multiple timescale constraints for
high-flux magma chamber assembly prior to the Late Bronze
Age eruption of Santorini (Greece)
T. Flaherty1, T.H. Druitt1, H. Tuffen2, M.D. Higgins3, F. Costa4, A. Cadoux5
1 Laboratoire Magmas et Volcans, Université Clermont Auvergne-CNRS-IRD, OPGC, F-63100, Clermont-Ferrand, France 2 Lancaster Environment Centre, Lancaster University, Lancaster, UK
3 Sciences de la Terre, Université du Québec à Chicoutimi, 555 Boulevard de l'Université, Chicoutimi, Québec, G7H 2B1, Canada
4 Earth Observatory of Singapore, Nanyang Technological University, Singapore 639798, Singapore 5GEOPS, Univ. Paris-Sud, CNRS, Université Paris-Saclay, 91405 Orsay, France
2
ABSTRACT
The rhyodacitic magma discharged during the 30-80 km3 DRE (dense rock equivalent) Late Bronze Age (LBA; also called ‘Minoan’) eruption of Santorini caldera is known from previous studies to have had a complex history of polybaric ascent and storage prior to eruption. We refine the timescales of these processes by modelling Mg-Fe diffusion profiles in orthopyroxene and clinopyroxene crystals. The data are integrated with previously published information on the LBA eruption (phase equilibria studies, melt inclusion volatile barometry, Mg-in-plagioclase diffusion chronometry), as well as new plagioclase crystal size distributions and the established pre-LBA history of the volcano, to reconstruct the events that led up to the assembly and discharge of the LBA magma chamber. Orthopyroxene, clinopyroxene and plagioclase crystals in the rhyodacite have compositionally distinct rims, overgrowing relict, probably source-derived, more
magnesian (or calcic) cores, and record one or more crystallization (plag>>opx>cpx) events during the few centuries to years prior to eruption. The crystallization event(s) can be explained by the rapid transfer of rhyodacitic melt from a dioritic/gabbroic region of the subcaldera pluton (mostly in the 8-12 km depth range), followed by injection, cooling and mixing in a large contiguous melt lens at 4-6 km depth (the pre-eruptive magma chamber). Since crystals from all pre-eruptive phases yield similar timescales, the melt transfer event(s), the last of which took place less than two years before the eruption, must have involved most of the magma subsequently erupted. The data are consistent with a model in which prolonged generation, storage and segregation of silicic melts was followed by gravitational instability in the subcaldera pluton, causing the rapid interconnection and amalgamation of melt-rich domains. The melts then drained to the top of the pluton, at fluxes of up to 0.1-1 km3.y-1, where steep vertical gradients of density and rheology probably caused them to inject laterally, forming a short-lived holding chamber prior to eruption. This interpretation is consistent with growing evidence that some large silicic magma chambers are transient features on geological timescales. A similar process preceded at least one earlier caldera-forming eruption on Santorini, suggesting that it may be a general feature of this rift-hosted magmatic system.
Keywords: diffusion chronometry, crystal size distribution, Santorini, Minoan eruption, magma chamber,
3
INTRODUCTION
Caldera-forming eruptions of silicic magma, such as the magnitude 7, Late Bronze Age (LBA; also called ‘Minoan’) eruption of Santorini, are low-frequency, high-impact events with effects at global scales (Mason et al. 2004; Self 2006; Oppenheimer 2013). The processes leading to reactivation of long-dormant caldera volcanoes are of societal interest, in particular for interpreting geophysical signals in times of unrest. Recent studies have shown that such systems can build up to eruption on geologically short timescales, raising the question of how this occurs (Morgan et al. 2006; Wark et al. 2007; Wilson and Charlier 2009; Gualda et al. 2012; Druitt et al. 2012; Matthews et al. 2012; Allan et al. 2013; 2017; Fabbro et al. 2013; 2017; Chamberlain et al. 2014; Pamukcu et al. 2015; Barker et al. 2016).
Silicic magmas are believed to be generated in bodies of crystal mush, where they can be stored in the crust for long periods of time (Bacon and Druitt 1988; Brophy 1991; Hildreth and Wilson 2007; Bachmann and Bergantz 2004; 2008; Deering et al. 2010; Bégué et al. 2014; Bergantz et al. 2015; Bachmann and Huber 2016; Cooper 2017; Rubin et al. 2017). Whereas large volumes of melt lose heat rapidly by convection, locked-in mushes cool slowly by conduction (Koyaguchi and Kaneko 1999), providing a long-lived source of melt that can be periodically tapped. Creation of large chambers of melt-dominated silicic magma requires (1) production and incubation of the melt within mush bodies, (2) extraction of that melt, and (3) its accumulation in magma chambers (Annen et al. 2006; Brown 2013, and references therein). Low rates of melt accumulation lead to pluton construction through freezing of successive batches, whereas the runaway addition of mass and heat associated with high accumulation rates generates magma chambers (Annen 2009). The critical accumulation rate for magma chamber formation probably lies between 10-3 and 10-1 km3.y-1 for a Santorini-sized system (Schopa and Annen 2013; Gelman et al. 2013; Karakas et al. 2017). The flow rate necessary to transport the melt through a dyke up to the magma chamber without freezing provides an additional constraint (~10-2 km3.y-1; Menand et al. 2015). Theoretical models of silicic melt extraction from crystal mushes by intergranular porous flow can explain magma chamber formation on timescales of 104-106 y (Bachmann and Bergantz 2004; Solano et al. 2012). However, silicic magma
chambers in some cases are assembled much faster than predicted theoretically, at rates as high as 0.05-1 km3.y-1 and on timescales as low as 10-103 y (Druitt et al. 2012; Allan et al. 2013; 2017; Barker et al. 2016; Cooper et al. 2017; Fabbro et al. 2017). A possible explanation is that melt-rich domains present in the mush body interconnect and amalgamate very rapidly to form a magma chamber (Christopher et al. 2015; Cashman et al. 2017; Sparks and Cashman 2017). Some questions arise from these concepts. How common is rapid magma chamber assembly in silicic systems? What is the mechanism driving high-flux melt
transfer? How does the timescale of magma chamber development scale with the size of the system? Following chamber assembly, what finally triggers the eruption?
The LBA eruption of Santorini has played a role in the development of these ideas. Cottrell et al. (1999) proposed, based on a combination of phase equilibria experiments and melt inclusion H2O barometry, that
4
the LBA silicic magma underwent polybaric ascent from a deep storage zone to a shallow magma chamber about 300 years prior to eruption. Their model was extended by Druitt et al. (2012), who used Mg-in plagioclase diffusion modelling to reduce the timescale from 300 years to a few decades. While Cottrell et al. (1999) proposed that the entire erupted magma volume was transferred in this time, Druitt et al. (2012) envisaged the late-stage replenishment of a pre-existing chamber by several km3 of silicic magma. In both interpretations, however, magma chamber assembly took place on timescales that were geologically very short. Other data have subsequently been published on the LBA magma: micro-Sr isotopic analyses of plagioclase (Martin et al. 2010), phase equilibria experiments on Santorini silicic magmas (Cadoux et al. 2014) and the basaltic/andesitic magmas parental to them (Andújar et al. 2015; 2016), H2O+CO2 melt inclusion barometry (Druitt et al. 2016), and the chemistry and petrology of minor juvenile and cognate components in the LBA eruption products (Druitt 2014).
In the present paper we present new data on the compositions and zoning patterns of orthopyroxene and clinopyroxene crystals and, in particular, on timescales of pre-eruptive crystal residence estimated by modelling of Mg-Fe diffusion gradients in these minerals (Morgan et al. 2004; Saunders et al. 2012; Allan et al. 2013; Costa et al. 2013; Chamberlain et al. 2014; Kilgour et al. 2014; Petrone et al. 2016; Singer et al. 2016; Krimer and Costa 2017; Fabbro et al. 2017). We also derive updated timescale information from plagioclase crystals. We then integrate the new, and previously published, information into a model for the architecture and dynamics of the Santorini plumbing system in the period leading up to the LBA eruption, and place constraints on the physical mechanisms at play.
THE LATE BRONZE AGE ERUPTION: CONTEXT AND PRODUCTS
Santorini is the southernmost volcanic centre of the South Aegean Volcanic Arc in Greece. It lies in a 100-km-long, 45-km-wide SW-NE rift zone (Nomikou et al. 2016; Hooft et al. 2017; Fig. 1a) on 25-km-thick continental crust with seismically distinct upper (0-15 km) and lower (15-25 km) layers (Konstaninou 2010).
The earliest preserved volcanic products on Santorini date from 650 ka. Since 350 ka the volcano has produced twelve Plinian eruptions (Druitt et al. 1999), at least four of which caused edifice collapse resulting in the present-day 10 x 7 km, multistage caldera. The Plinian eruptions were separated by inter-Plinian periods of 10-30 ky durations and characterised by intracaldera effusive volcanism and lower
intensity (sub-Plinian or less) explosive activity. Following over half a million years of activity, Santorini must be underlain by a large pluton, probably zoned from granodiorite through diorite to gabbro with increasing depth. Mantle-derived basalt fractionates to andesite beneath Santorini near the upper-lower crustal boundary (~400 MPa), and andesite fractionates to silicic magma in the upper crust (200-400 MPa)
(Andújar et al. 2015; 2016). Santorini magmas are calcalkaline to mildy tholeiitic in nature (Huijsmans 1985; Huijsmans and Barton 1989; Druitt et al. 1999).
5
The Plinian eruption prior to the LBA eruption (the >10 km3 DRE Cape Riva eruption) has been dated at 21.8 ± 0.4 ka and formed a caldera located in the northern basin of the present-day caldera (Athanassis et al. 2016, and references therein; Fig. 1c). A sequence of events then occurred within the crust during the subsequent 17.2 ky inter-Plinian period that culminated in the LBA eruption (Fig. 1b). There is evidence for three eruptive events during this period. (1) Immediately following the Cape Riva eruption, an andesitic edifice at least 2.5 km3 in volume was built within the Cape Riva caldera. Blocks of this former edifice occur as black glassy lithic blocks in the LBA ejecta (Druitt 2014); one block has been dated at 20.2 ± 1.0 ka (Karátson et al. 2018). The andesite was a distinctive high-Ba magma unrelated to either the Cape Riva or LBA silicic magmas (Druitt 2014). (2) At 12-13 ka, a small eruption of LBA-like silicic magma took place, forming a crypto-ash layer in marine and terrestrial sediments (St. Seymour et al. 2004; Satow et al. 2015). (3) A number of small basaltic eruptions of unknown age also took place (Vespa et al. 2006; Vaggelli et al. 2009).
The LBA eruption occurred in the late 17th century BCE, and discharged 30-80 km3 DRE of magmatic and accidental materials (Pyle 1990; Sigurdsson et al. 2006; Johnston et al. 2014). The eruption has been reconstructed in detail (Bond and Sparks 1976, Heiken and McCoy 1984; Sigurdsson et al. 1990; Pyle 1990; Sparks and Wilson 1990; Cioni et al. 2000; Druitt 2014). It comprised five phases, here numbered 0 to 4: (0) a precursory Vulcanian phase, (1) a Plinian phase, (2) a phase of syn-Plinian base surges, (3) a phase of phreatomagmatic activity with low-temperature pyroclastic flows, and (4) a phase of hot, fluidized pyroclastic flows, which accounted for most of the magma discharged (Fig. 1d). Phases 0 and 1 took place from a subaerial vent (star, Fig. 1c). The vent then migrated during phase 2 into the flooded Cape Riva caldera, such that phase 3 was strongly phreatomagmatic. Phase 4 appears to have been fed from multiple subaerial vents of poorly constrained locations. Caldera collapse probably took place during phase 4, deepening and enlarging the extant Cape Riva caldera.
Since the LBA eruption, repeated effusion of dacitic magma (4.85 ± 0.7 km3 in total) has built up the largely submerged Kameni intracaldera edifice on the floor of the present-day caldera, with its subaerial summits forming the islands of Palaea and Nea Kameni (Pyle and Elliot 2006; Nomikou et al. 2014). The first recorded eruption of Kameni took place in 197 BCE, and the most recent in 1950. The mean eruption rate over this time has been 1.3 x 10⁻³ km3.y-1 (Nomikou et al. 2014), similar to that estimated for a previous inter-Plinian period between 70 and 55 ka (~1 x 10⁻³ km3.y-1; Druitt et al. 1999). The Kameni vents lie along a NE-SW lineament called the Kameni Line, which lies parallel to the regional fault trend and which has played a central role in Santorini volcanism (Fig. 1c). Several Plinian eruptions, including the LBA, began at a vent on or near the Kameni Line. Seismicity was strongly concentrated along the Kameni Line during a period of bradyseismic unrest in 2011-2012 (Newman et al. 2012).
6
SUMMARY OF PREVIOUSLY PUBLISHED DATA ON THE LBA RHYODACITE
Petrology and geochemistry
Analyses of twenty-three visually homogeneous pumice clasts of the rhyodacite presented by Druitt (2014) reveal a restricted range of whole-rock compositions (70-71 wt% SiO2, recalculated volatile-free; FeO/MgO of 3 to 5), irrespective of eruptive phase. The crystalline phases are plagioclase, orthopyroxene, clinopyroxene (weight proportions plag : opx : cpx of 0.84 : 0.10 : 0.06; Cadoux et al. 2014), magnetite and ilmenite set in 73-74 wt% SiO2 rhyolitic glass. Apatite and pyrrhotite occur mostly as inclusions in pyroxenes and magnetite. Trace quantities of zircon are present (Schmitt et al. 2016). Crystal contents based on K mass balance in nine pumice-glass pairs range from <5 to 20 wt%, the lowest values occurring in phase 1 (<5-12 wt%), and the highest in phase 4 (12-20 wt%) (Online Resource 1). New measurements of
plagioclase contents in fifteen thin sections by image analysis (3-16 vol%; Online Resource 2) are consistent with this range.
Plagioclases (3 mm in length) were described by Druitt et al. (2012) based on BSE images of 300 crystals (Fig. 2a). Most have compositions of An40±3 (with rare thin zones as sodic as An30)and are weakly normally zoned to euhedral edges of An37-40. Superimposed on the overall normal zoning are multiple (typically 3-6), 50-100 µm wide, sawtooth-zoned packets, each consisting of normally zoned plagioclase terminated by a subtle resorption surface and a small (<few molar %) increase in An content. About half of the crystals have An30-88 composition cores that are variably euhedral to corroded (Fig. 2a), and exhibit complex combinations of normal, reverse, sawtooth, oscillatory or patchy zoning, with multiple resorption surfaces, indicative of long and complex histories prior to overgrowth by the An40±3 rims. The majority of the cores have compositions of An50±7, sometimes with inner cores of An58-88 (Fig. 2b). Very rarely (<<1%) the cores are more sodic (An30-36) than the rims. An additional group of plagioclase crystals occurs in small quantities, and uniquely in pumices from eruptive phase 4. Their distribution is very heterogeneous; they are present in some phase-4 pumices but not in others. They have the same compositions as the calcic cores (An50±7), but lack the An40±3 rims (Fig. 2a). Druitt et al. (2012) referred to them as ‘rimless An50±7
crystals’. These rimless crystals have thin selvages of a glass that is slightly less evolved than the normal interstitial glass (Online Resource 1).
Martin et al. (2010) measured the 87Sr/86Sr ratios of plagioclase crystals in phase-1 pumices to be 0.7049-0.7051, slightly less Sr-radiogenic than the interstitial glass (0.7051-7054). Seven of their eight isotopic analyses were from the An40±3 plagioclase, and one was from a An50±7 core; there was no difference in 87Sr/86Sr between the two compositions. Di Salvo et al. (2013) also isotopically analysed some rims, calcic cores and highly calcic inner cores, and found that they all had similar range of 87Sr/86Sr. Martin et al. (2010) interpreted the relatively high 87Sr/86Sr of the interstitial glass to post-crystallization contamination of the rhyodacitic magma by a more Sr-radiogenic melt.
7
Melt inclusions (MIs) in An40±3 plagioclase contain 69-75 wt% SiO2 (Online Resource 1). Secondary ion mass spectrometry (SIMS) analysis of >60 isolated, crack-free MIs hosted in plagioclase, opx and cpx revealed volatile concentrations of 4.0-6.9 wt% H2O, 20-200 ppm CO2, 40-100 ppm S, and 3000-4500 ppm Cl (Cadoux et al. 2014; Druitt et al. 2016). MIs within plagioclase An50±7 cores are more H2O-rich (4.2-6.9 wt%) than those within An40±3 rims (4.0-5.0 wt%) (Fig. 2c). Cottrell et al. (1999) also measured 6.5 wt% H2O in seven MIs within An50±7 cores. If corrected for ~10 wt% post-entrapment crystallization (in the cooler environment of rim overgrowth; Online Resource 1), then the highest H2O content of the core-hosted MIs
at the moment of entrapment fall to 6.1 wt%. CO2, S and Cl concentrations of MIs in the cores and rims are similar. Although An50±7 cores with H2O-rich MIs occur in pumices from eruptive phase 1, 2 and 4, they are particularly abundant in phase 1 (Fig. 2d).
Druitt et al. (2016) used MI H2O+CO2 contents and the solubility models of Newman and Lowenstern (2002) and Papale et al. (2006) to estimate entrapment pressures, which were converted to entrapment depths using a mean upper crust density of 2640 kg.m–3 (Konstantinou, 2010) assuming volatile saturation (Cadoux et al. 2014; Druitt et al. 2016). MI entrapment in the An40±3 plagioclase occurred at 100-160 MPa (4-6 km depth). However, MI entrapment within An50±7 plagioclase cores extended to higher inferred pressures (240 MPa for 6.1 wt% H2O and 100 ppm CO2, corresponding to a depth of 9 km). The proposed explanation is that the cores were derived from depth and transferred to shallower levels where rim overgrowth occurred, in accordance with the earlier model of Cottrell et al. (1999).
Pre-eruptive temperatures and oxygen fugacities (fO2) based on touching Fe-Ti oxide pairs in contact with the glass were estimated to be 885 ± 7 °C and 10-6.7 ± 0.2 Pa by Cottrell et al. (1999) using the algorithm of Andersen and Lindsley (1988). Cadoux et al. (2014) and Druitt (2014) estimated 853 ± 7 °C and 10-7.8 ± 0.2 Pa using the same algorithm, and 866 ± 9 °C and 10-7.86 ± 0.07 Pa using that of Ghiorso and Evans (2008). There is no systematic variation of temperature with eruptive phase.
Pre-eruptive magma chamber
The LBA rhyodacite was erupted from a single interconnected magma reservoir (henceforth termed the magma chamber), because similar whole rock and glass compositions, phenocryst edge compositions, phenocryst MI compositions, and Fe-Ti oxide temperatures are found for pumices from all eruptive phases (Cottrell et al. 1999; Cadoux et al. 2014; Druitt 2014). Cottrell et al. (1999) used phase equilibria, MI H2O contents, and the absence of stable amphibole to infer pre-eruptive storage of the magma at 50 MPa, 885 °C, and H2O-saturated conditions. These values were revised by Cadoux et al. (2014), who experimentally reproduced the phenocryst-glass assemblage at higher pressure (>200 MPa) and lower temperature (860°C), with melt saturated with respect to H2O + Cl + CO2, but slightly undersaturated with respect to pure H2O (XH2O=H2O/[H2O+CO2] of 0.8-0.9). Cadoux et al. (2014) also proposed that the melt co-existed with a H2O+Cl-rich hydrosaline liquid. The MI H2O + CO2 data of Druitt et al. (2016) yielded pre-eruptive storage pressures (100-160 MPa; 4-6 km) intermediate between the estimates of the previous authors. Combining
8
the different constraints, the best-fit pre-eruptive conditions for the LBA rhyodacite are 850-880 °C, fO2 ~ NNO, 100-160 MPa (4-6 km depth), melt saturated with 4.0-5.0 wt% H2O, <200 ppm CO2, <150 ppm S and 3000-5000 ppm Cl, a free H2O-rich vapour phase, and possibly a H2O+Cl-rich hydrosaline liquid. The magma chamber was less than 2 km thick (4-6 km depth).
Source region of the rhyodacite
Cottrell et al. (1999) proposed a rhyodacite source reservoir at 210-240 MPa and 825 ±25 °C. However, phase equilibrium experiments on a typical 59 wt% SiO2 Santorini andesite (Andújar et al. 2016) generated 68-70 wt% SiO2 melt, similar to LBA rhyodacite, at 900-950 °C and under relatively oxidising conditions (NNO+1.5). Andújar et al. noted that, while most LBA pumices are calcalkaline rhyodacite with Fe/Mg ratios of about 3, some are more tholeiitic with Fe/Mg ratios of up to 5. The main, calcalkaline rhyodacite was produced experimentally at 200 MPa and 6 wt% H2O in an assemblage containing plagioclase (An50±5), cpx (Mg# 70-75) and opx (Mg# 70-75). More tholeiitic rhyodacitic melts were produced at higher pressure (400 MPa). The LBA rhyodacite was thus generated at 900-950 °C over the pressure range 200-400 MPa, but mostly at ~200 MPa (Andújar et al 2016). The high H2O contents and entrapment pressures recorded by plagioclase core-hosted MIs (up to 240 MPa, or 9 km) agree with the experimental constraints. The best estimate is that the LBA rhyodacitic melts were extracted mostly from a 900-950 °C, dioritic/gabbroic region of the subcaldera pluton at 8-12 km depth (200-300 MPa), possibly with lesser quantities of more tholeiitic silicic melts extracted from deeper levels (~400 MPa).
Amphibole may have been present at 200 MPa in the source region, but only at temperatures of <940 °C (Fig. 3a, c of Andújar et al. 2016). Any source-derived amphiboles must have been resorbed prior to eruption because amphibole was not stable in the magma chamber (Cottrell et al. 1999; Cadoux et al. 2014). The presence of amphibole in the source region is consistent with the low Y and Dy/Yb of the LBA rhyodacite (Klaver et al. 2016)
Minor andesitic components
Two minor (<1 %) andesitic components were co-erupted with the rhyodacite (Sparks et al. 1977; Druitt et al. 1999; Cottrell et al. 1999; Druitt 2014) (Fig. 1d):
A suite of microphenocryst-rich andesitic pumices and dioritic plutonic nodules (55-100 vol% crystals) that were erupted at the start of phase 0, and throughout phase 1, but as only trace amounts in phases 2 to 4 (Fig. 1d). These have the same high-Ba composition as the post-Cape Riva intracaldera edifice, and are interpreted as samples of a variably crystalline residual pocket of the same magma that was pushed out by the ascending LBA rhyodacite (Druitt 2014).
9
Enclaves of andesitic magma that were mingled into the rhyodacite within a few months of the eruption, quenched, then released during eruptive fragmentation (Cottrell et al. 1999). They were erupted mainly during phase 1. These enclaves are also enriched in Ba (Druitt 2014).
METHODS AND ASSUMPTIONS
Orthopyroxene (opx) and clinopyroxene (cpx) crystals were extracted from the 250-400 and 400-700 μm size fractions of ten gently crushed pumice lumps (2-4 per eruptive phase) and mounted in epoxy resin. Crystals with adhering grey, microlite-rich groundmass derived from disaggregated andesitic enclaves were excluded. Pyroxene zoning textures were studied using greyscale back-scattered electron (BSE) images calibrated for Mg number (Mg# = 100xMg/[Mg+FeTotal] atomic). Only crystals judged by visual inspection to be symmetrically mounted and polished through their centres were imaged. A total of 65-120 opx crystals (eruptive phases 1-4) and 12 cpx crystals (eruptive phases 1, 2 and 4) were examined. All the opx and cpx crystals had their long (c) axes parallel to the surface of the grain mount. Compositional images were made of selected opx crystals. Full details of sample preparation and analysis are given in Online Resource 3.
Diffusive re-equilibration timescales were determined for opx and cpx using binary element diffusion modelling of Mg-Fe profiles across inter-zonal boundaries (Morgan et al. 2004; 2006; Allan et al. 2013; 2017; Chamberlain et al. 2014; Barker et al. 2016) (Online Resource 4). We implemented an analytical solution to the one-dimensional diffusion equation, assuming an initial step function in Mg#, then fitted the measured profiles by a least squares method, with maximum and minimum uncertainties and a correlation index, R2 (Online Resource 3). Diffusion modelling was carried out perpendicular to crystal length (c axis) in both pyroxene species. In opx it was carried out parallel to the a axis, sections through the c-a plane being recognized by the presence of {201} crystal terminations. Orientations of the cpx crystals were determined using the SHAPE software (Dowty 1987) by matching measured interfacial angles with those of modelled cpx sections. The diffusion coefficients of Ganguly and Tazzoli (1994) and Dohmen et al. (2016) were used for opx, and that of Müller et al. (2013) was used for cpx, with corrections for diffusion anisotropy of opx and cpx explained in Online Resource 3, respectively. Uncertainties on the diffusion timescales were calculated using standard error propagation (Online Resource 3).
The timescale derived by modelling of Mg-Fe diffusion across a particular zone boundary is the time elapsed between zone boundary formation and eruption quench, at the assumed temperature of
residence. The modelling was carried out at 855 ± 15 °C and fO2 = 10-7.8 ± 0.2 Pa (~NNO), representative of the pre-eruptive conditions (Cadoux et al. 2014; Druitt 2014).
Crystal residence timescales obtained by 1D diffusion modelling are maximum estimates (Costa et al. 2008; Shea et al. 2015; Krimer and Costa 2017). However, modelling along short profiles perpendicular to the long (c) axis in prismatic crystals of high aspect ratio (up to 4 in cpx, up to 8 in opx) is pseudo-1D, reducing any overestimation due to this effect. By assuming an initial step function, the approach also
10
ignores the presence of any growth zoning, also resulting in an overestimation of residence time (Costa et al. 2008; Costa and Morgan 2010; Chamberlain et al. 2014; Till et al. 2015). However, any growth-generated zoning is less important perpendicular to the c axis than parallel to it.
NEW INSIGHTS FROM PYROXENES
Pyroxene zoning patterns
In the following descriptions, compositionally distinct inner and outer zones of a crystal are referred to as the core and rim. The outer limit of the crystal in contact with glass is referred to as the crystal (or rim) edge.
Orthopyroxene crystals (3 mm in length) occur with length/width ratios of up to 8 (Fig. 3).
Compositions span the range Wo2-3En52-70Fs28-45 (Mg# 53-71), with Al2O3 contents of 0.4-0.7 wt% (rarely up to 1.4 wt%). Most crystals have restricted compositions (Mg# 57-61), and diffuse, short-wavelength (5-15 µm) oscillatory zoning, particularly evident parallel to the c axis. Some contain sharply defined, 2-30 µm-thick growth zones of slightly more Fe-rich compositions (Mg# 53-55; e.g., bright zone in Fig. 3c), although the euhedral edge composition is always in the range Mg# 57-61. Many crystals that appear homogeneous at low BSE resolutions contain complex, low-magnitude oscillatory zoning visible at high BSE resolutions. Of five opx crystals imaged compositionally, four exhibit sector zoning of Al. (Fig. 4a). Al, being trivalent, diffuses two orders of magnitude slower than Mg and Fe in opx (Nakagawa et al. 2005), and so may
preserve the original small-scale growth zoning that is partially re-equilibrated in more rapidly diffusing Mg and Fe. While Al and Mg# are correlated at large scales they are de-correlated at shorter scales, Al
exhibiting sharper fluctuations than Mg# (Fig. 4b). This suggests that growth-generated compositional gradients are narrow, justifying a step-function initial condition for Mg-Fe in the diffusion modelling.
One-fifth of the opx crystals have magnesian cores with Mg# 63-71 (Fig. 3e), commonly containing multiple resorption surfaces, melt inclusions, and patchy zoning. The melt inclusions are surrounded by streaky compositional zoning elongated parallel to the c axis, formed by diffusional Mg-Fe exchange between the melt inclusions and host opx (e.g., Tomiya and Takahashi 2005; Allan et al. 2013; Barker et al. 2016).
Clinopyroxene crystals (2 mm in length) have aspect ratios of up to 4 (Fig. 5). Compositions span the range Wo39-44En36-44Fs14-22 (Mg# 62-78), but most crystals have Mg# of 62-70, with edges of 66-70 (Fig. 5a). Both normal and reverse zoning are observed in these crystals, but 2-30 µm-scale oscillatory zoning is most common. Al2O3 contents are typically 0.7-1.0 wt%, but can reach 2.0-2.5 wt% in more Fe-rich zones. Four of the twelve crystals examined in detail contain magnesian cores with Mg# 72-78 and Al2O3 contents of 1.4-1.7 wt% (Figs. 5c and e). Some cores are riddled with melt inclusions, and have a wispy zoning due to partial diffusive Mg-Fe overprinting by the Mg# ~67 composition around melt inclusions and along fractures and cleavage planes (Fig. 5c).
11
Diffusion timescales of pyroxene residence
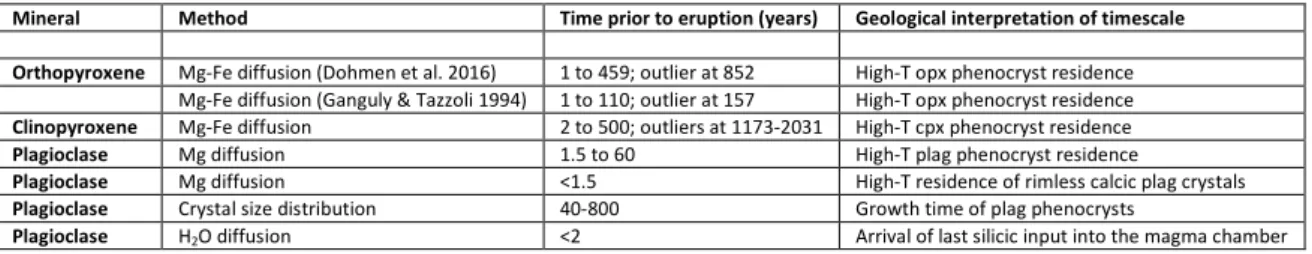
Diffusion timescales were measured across (1) the inner limit (core-rim boundary) of the crystal rim, and (2) zones boundaries within the rims. The aim was to estimate the residence time of the crystal rim of each pyroxene species since its formation. The results are given in full in Online Resource 4, and
summarized in Table 1.
A total of 85 zone boundaries in 16 opx crystals were modelled, but application of quality-control criteria (Online Resource 3) retained only 32 of the profiles for timescale calculation, all models fitting the actual profiles with R2>0.95. The Mg-Fe gradients ranged in width from 0.4 to 48 µm. Three examples are shown in Fig. 3. Diffusion profiles with R2>0.99 give visually good fits (Figs. 3b and d). Those with R2 of 0.98-0.99 give less good fits, commonly due to the presence of micron-scale fluctuations of Mg# in the crystal (e.g., Fig. 3f). These fluctuations may show that the entire profile was generated by growth, not diffusion. However such fluctuations are also observed in experimental studies of diffusion due to the presence of crystal microfractures not visible on BSE images (J. Ganguly, written communication). Profiles with R2<0.98, on the other hand, probably have significant components of growth zoning. We place emphasis on those profiles with R2>0.99.
Diffusion timescales across the core-rim boundaries in two opx crystals give 138-459 y using the Dohmen et al. (2016) diffusion coefficient (Fig. 6a). Timescales from zone boundaries within the crystal rims range from <1 to 420 y, largely consistent with the core-rim boundaries, with a single outlier at 852 y (Fig. 6a). However, all except one of the timescales with the highest quality fit (R2>0.99) are <55 y (Figs. 3b and d). The timescales from within the rims themselves suggests that rim growth continued until eruption-driven quench took place. The single longer timescale (852 y) comes from near the centre of a core-free crystal (Fig. 6), and may record an earlier phase of rim growth. There are no systematic differences in the timescale ranges in opx crystals from the different eruptive phases.
Orthopyroxene diffusion timescales calculated using the Ganguly and Tazzoli (1994) diffusion coefficient are five times shorter than those using Dohmen et al. (2016). The core-rim boundaries give timescales of 42-110 y, and zone boundaries within the rims give <1-36 y (with the best fits being <10 y), with the single outlier at 157 y.
We have no firm basis for favouring one opx diffusion coefficient over the other (as discussed in Online Resource 3); however, by placing emphasis on the Dohmen et al. (2016) results, we are inferring maximum timescales. Moreover the opx timescales derived using Dohmen et al. (2016) are similar to those obtained from cpx (see below). We therefore conclude that the main phase of opx crystallization began no more than 450 years prior to eruption (possibly with an earlier phase at ~850 y; Fig. 6a) and was still ongoing within the last few years prior to the eruption.
A total of 26 profiles in 7 cpx crystals were modelled perpendicular to the c axis assuming initial step functions in Mg# and distinguishing between profiles across the wispy diffusion fronts defining the core-rim boundary (Figs. 5c and e), and profiles across zone boundaries within the rims (Figs. 5a, c and e; Fig. 6b).
12
The wispy core-rim boundaries of three cpx crystals give 543-1700 y, but are probably significantly overestimated because the boundaries are not planar and hence not well represented by 1D modelling (Figs. 5c and e). This is unlike the core-rim boundaries in the opx crystals, which are approximately planar (Fig. 3e). Zone boundaries within the cpx rims, all of which are planar, give timescales of 2 to 500 y, with the best-quality fits (R2>0.99) giving 2 to 120 years (Fig. 6b). Fuzzier planar boundaries deeper in the rims give 1173-2031 y.
The diffusion timescales for cpx are longer than those of opx. However, if the wispy core-rim boundary timescales are excluded, then the timescales for cpx range from <1 to 500 years prior to eruption (possibly extending to 1000-2000 years; Fig. 6b), which is consistent with the opx timescales using the diffusion coefficient of Dohmen et al. (2016). We accept this interpretation, while recognising that some inner zones of the cpx rims may pre-date the rims on the opx crystals.
Two endmember situations can be envisaged for crystal rim growth. In one, growth occurred very rapidly and the crystal then resided at high temperature until eruption (case tgrowth << tresidence; Fig. 7a). Alternatively, the rims grew continuously from initiation until eruption (case tgrowth = tresidence; Fig. 7a). The diffusion timescales for both opx and cpx generally increase from small values near crystal edges to much larger values in the interior (Fig. 7b and c). Although this may in part be an artefact due to the higher probability of more oblique intersection of zone boundaries at depth than near the crystal surface, it suggests that the scenario tgrowth = tresidence is more realistic for LBA magma. Visual extrapolation of the timescales back to the core-rim boundary (or to the centre of the phenocryst, if core-free) suggests the onset of rim growth as early as >1000-2000 y to as late as <100 y, with most lying in the range 600-100 y. Converting this to growth rate gives 10-11-10-10 mm.s-1 for both pyroxene species.
ADDITIONAL TIMESCALE INFORMATION FROM PLAGIOCLASE
Three additional timescale constraints are provided by studies involving plagioclase. First, Druitt et al. (2012) placed constraints on the pre-eruptive residence timescale of An40±3 plagioclase by characterising Mg contents across core-rim boundaries using SIMS, reconstructing the initial growth profiles, and then
modelling subsequent Mg diffusion. The An40±3 rims were proposed to have overgrown the An50±7 cores 0.3-12 y prior to eruption, with the rimless An50±7 crystals residing in the rhyodacite for 0.3 y prior to eruption. However, application of a new, better-constrained plagioclase Mg diffusion coefficient (Van Orman et al. 2014) raises the timescale of An40±3 plagioclase residence from 0.3-12 y to 1.5-60 y, and that of the rimless An50±7 crystals from <0.3 y to <1.5 y (Online Resource 2).
Second, crystal size distributions (CSD) can provide time information if assumptions are made concerning crystal growth rate (see reviews by Higgins 2006 and Armienti 2008). New plagioclase CSDs (Online Resource 2), when combined with a crystal growth rate derived from the Mg diffusion data, give a characteristic plagioclase growth timescale of <40-800 y, which is similar to the residence timescales
13
derived from the pyroxenes. This approach is circular in that we require a growth rate based on diffusion modelling to obtain a timescale from the CSD data. However it shows that the CSDs and diffusion profiling return mutually consistent timescales.
Third, some MIs in plagioclase An50±7 cores contain higher H2O (6.9 wt%) than those in the An40±3 rims (4.0-5.0 wt%) (Druitt et al. 2016). We have used the H2O diffusion model of Qin et al. (1992) to estimate that a core-hosted MI with 6.9 wt% H2O requires <2 years to diffusively re-equilibrate through its host plagioclase with ambient melt containing 4.5 wt% H2O (Online Resource 2). This shows that cores
containing H2O-rich MIs must have arrived in the magma chamber <2 years preceding the eruption to have avoided diffusive re-equilibration.
DISCUSSION
We now bring together previously published data on the LBA rhyodacite with the new timescale constraints to interpret the processes that took place during build-up to the LBA eruption. The term ‘phenocryst’ is used for a crystal that grew from its co-erupted host melt (allowing for small compositional variations), ‘antecryst’ is used for a crystal grown from a melt different from the host, but related to the same magmatic system (e.g., Hildreth and Wilson 2007), and ‘xenocryst’ is used for a crystal derived from an earlier magmatic system.
Origins of the crystal populations
Phenocryst crystallization
The main plagioclase (An40±3), opx (Mg# 57-61) and cpx (Mg# 63-68) components (constituting the rims on core-bearing crystals, and core-free crystals of rim composition) are interpreted as phenocrystic, for the following reasons. (1) Values of KD (=[Fetot/Mg]mineral / [Fetot/Mg]melt; where Fetot is total iron) for opx and cpx derived from the phase equilibria data of Cadoux et al. (2014) on LBA pumice are 0.29 ± 0.07 and 0.22 ± 0.05, respectively. The opx therefore crystallized from melt with Mg# of 24-31, and the cpx from melt with Mg# of 26-32, which span the compositional range between bulk rhyodacite pumice (Mg# 26-32) and its interstitial glass (Mg# of 18-24). Assuming equilibrium between the rims of opx and cpx crystals, the two-pyroxene thermometer of Putirka (2008; eq. 36) yields a temperature of ~850 °C, which is consistent with the Fe-Ti oxide estimates. (2) Plagioclase An40±3 compositions are also consistent with crystallization from this range of melts, based on their Sr contents (Druitt et al. 2012) and on phase equilibria (Cadoux et al. 2014). (3) Melt inclusions in all three minerals have compositions ranging from bulk pumice to interstitial glass (Online Resource 1). Although the plagioclase crystals have slightly different Sr isotopic ratios than the host glass, this is attributed to post-crystallization contamination of the melt by a more radiogenic
14
The phenocrysts are interpreted as recording one or more events of crystallization of the rhyodacitic magma in the proportions plag>>opx>cpx. All three phenocryst phases exhibit oscillatory zoning indicative either of varying P-T-X conditions, or of kinetic effects, during growth (Streck 2008). Multiple sawtooth zoning in An40±3 plagioclase phenocrysts may record repeated cycles of dissolution-precipitation due to fluctuations of temperature, PH2O, and/or melt composition, probably during slow growth (Streck 2008). On the other hand, the presence of Al sector zoning in a small proportion of opx phenocrysts is indicative of fast growth, at least initially. Sector zoning of Al has been generated experimentally in opx by Schwandt and McKay (2006), who showed that it is characteristic of rapid crystal growth with differential entrapment of highly charged cations such as Al3+.
Antecrystic cores of plagioclase, opx and cpx
The compositional and textural diversity of the plagioclase, opx and cpx cores- patchy zoning, multiple dissolution-reaction-precipitation textures, and (in cpx) wispy diffusional overprinting (Fig. 5) - are suggestive of protracted open-system histories prior to incorporation into the rhyodacite. The corroded forms of many cores record a perturbation of P-T-X conditions prior to rim overgrowth.
Possible origins for the cores include (1) xenocrysts derived from older volcanic formations, (2) in-mingled antecrysts from the co-erupted andesitic components (which indeed contain crystals that overlap compositionally with the cores; see Table 4 in Druitt 2014), or (3) antecrysts derived from the source region of the rhyodacite. In some of the plagioclase crystals, the An50±7 cores and An58-88 inner cores have the same ranges of Sr isotopic compositions as the An40±3 rims (Martin et al. 2010; Di Salvo et al. 2013), which would tend to rule out origin 1. It would also rule out origin 2, since plagioclase in the co-erupted high-Ba
andesitic components is more radiogenic (87Sr/86Sr of 0.7051-0.7055) than that in the rhyodacite (0.7049-0.7051) (Martin et al. 2010). The plagioclase cores would thus have had to have resided long enough in the rhyodacite to come to isotopic equilibrium, which for a 100 µm-diameter An50 crystal would take 103 y at 860 °C (Davidson et al. 2001).
We tentatively interpret many of the plagioclase, opx and cpx cores as antecrysts derived from the source region of the rhyodacite. Several lines of evidence are consistent with this. (1) The compositions of the cores (plag An50±7; cpx Mg# 70-74; opx Mg# 65-71) are very similar to those of the crystal assemblage in equilibrium with LBA-like, 69 wt% SiO2 melt (plag An50±5; cpx Mg# 70-75; opx Mg# 70-75) at the postulated source conditions in the experiments of Andújar et al. (2016). (2) Compositions of MIs within the
plagioclase An50±7 cores are consistent with equilibrium with 69 wt% SiO2 melt (Online Resource 1). (3) Rimless An50±7 plagioclases have glass selvages of this same composition (Online Resource 1). (4) Sr contents of An50±7 plagioclase cores and rimless An50±7 plagioclase imply equilibrium with melts of 63-69 wt% SiO2 (see Fig. 3d of Druitt et al. 2012).
15
The rimless An
50±7plagioclase
The rimless An50±7 plagioclase crystals were introduced (immersed in 69 wt% SiO2 melt) into the magma within 1.5 years of the eruption, probably immediately prior to, or during, eruptive phase 4. Their
heterogeneous distribution implies that intermingling was still ongoing at the time of eruption. We do not have H2O analyses of MIs in these crystals, so their depth of origin is unconstrained. These crystals lack An40±3 rims, implying insufficient time for rim growth prior to eruption quench. They may have been entrained into the magma chamber from underlying crystal mushes during phase 4 caldera collapse.
Rapid magma transfer and chamber assembly
The collective dataset shows that: (1) the LBA rhyodacite was derived mostly from a source region of gabbroic/dioritic composition at 8-12 km depth in the subcaldera pluton, and was transferred to a well-mixed magma chamber at 4-6 km, from where it was erupted; (2) almost all discharged plagioclase, opx and cpx phenocrysts had crystallized within 1000-2000 y of the eruption, mostly within 600-100 y, and that they had grown continuously from initiation until eruption quench; (3) growth of phenocrysts with antecrystic cores containing H2O-rich melt inclusions must have occurred 2 years prior to eruption.
Why did most of the crystals form so late relative to the 17,000-year preceding inter-Plinian period? One possibility is that the LBA magma chamber grew incrementally in the upper crust over many thousands of years, and that crystals were progressively removed by sedimentation. In this case only the most
recently formed phenocrysts would have been retained by the magma and erupted. In order to test this, we have modelled in Online Resource 5 the sedimentation rate of plagioclase and pyroxene crystals in the rhyodacite, taking reasonable values for the magma properties (viscosity of 3 x 10⁴ Pa.s and density of 2300 kg.m-3) and chamber thickness (~1 km), and accounting for convection. The results show that the
characteristic timescale of crystal extraction by sedimentation, even for the largest crystals, is at least an order of magnitude longer than the residence timescales recorded by most of the crystals themselves. We therefore conclude that the data are not consistent with phenocryst growth in a slowly cooling and progressively crystallising magma chamber over many thousands of years, but instead imply the existence of a crystallization event (or several events) within a few centuries to years of the eruption.
We consider three processes that could have caused such a crystallization event: (1) CO2 flushing from underplated mafic magma (Caricchi et al. 2018), (2) polybaric ascent and cooling (Cottrell et al. 1999), and (3) injection of a hotter, antecryst-bearing melt into a cooler magma chamber (Druitt et al. 2012). A fourth possibility, overpressure release during eruption, is not viable because the timescales are much longer than those of the eruption (probably months to weeks for phase P0, days to hours for phases 1-4; Druitt 2014).
Inspection of Figure 3 of Cadoux et al. (2014) shows that (at 200 MPa) 13 % crystallization could be produced by a drop of H2O content from 6.3 to 5.2 wt%, which could be achieved by adding about 400 ppm CO2 (process 1; estimated using the algorithm VolatileCalc of Newman and Lowenstern 2002). However, MIs in the rhyodacite phenocrysts contain much lower CO2 (all <200 ppm and most <100 ppm; Druitt et al.
16
2016), so while we cannot firmly exclude some CO2 flushing from underplated basalt, it was probably not the main process driving crystallization. Some combination of processes 2 and 3 must have been mainly responsible.
In order to test this, we have plotted on a pressure-temperature diagram (Fig. 8) the conditions of the source region (green box) and pre-eruptive magma chamber (orange box). We have also superimposed the liquidus of the LBA rhyodacite and contours of crystallinity from the experiments of Cadoux et al. (2014) at the slightly H2O-undersaturated conditions appropriate for the LBA magma chamber. Ascent of the
rhyodacitic melt from the source region to the magma chamber would have involved 40-140 MPa of decompression and 40-100 °C of cooling, resulting in growth of 5-15 wt% of phenocrysts of An35-40 plag >> opx > cpx (Cadoux et al. 2014), in agreement with observations. Plagioclase-melt temperatures given by MIs in the An40±3 phenocrysts and phenocrystic rims span a range of 30-60 °C (Table 3 in Druitt et al. 2016), broadly consistent with this amount of cooling. Had melt ascent been slow (dashed green arrow, Fig. 8), much crystal growth may have occurred during decompression prior to injection into the magma chamber, whereas had it been rapid (solid green arrow, Fig. 8), most crystal growth would have occurred
subsequently by cooling in the chamber.
Our observations favour mainly rapid melt transfer. First, the antecrystic plagioclase An50±7 cores containing H2O-rich melt inclusions were transferred from depth into the magma chamber (and overgrown by the An40±3 rims) less than two years before the eruption onset. Hence at least that late magma batch must have ascended rapidly. Second, many pyroxene phenocrysts appear to have grown continuously from their initiation until the eruption (Fig. 7b and c). Had growth been driven partly by decompression (dashed green arrow), then ascent of the magma from depth to the magma chamber would have had to have taken many centuries to decades, which is inconsistent with the first line of evidence and also seems unlikely given current models of silicic magma transfer through the crust (Petford et al. 1993; Menand et al. 2015). Third, some opx crystals exhibit Al sector zoning, possibly consistent with rapid initial crystallization followed by prolonged residence in the magma chamber accompanied by further growth. The data
therefore favour an interpretation involving rapid magma ascent followed by prolonged phenocryst growth in the cooler environment of the upper crust. Sawtooth zoning in plagioclase phenocrysts may record repeated precipitation-dissolution cycles in the magma chamber due to convective turnover and heating by the arrival of successive batches of hotter silicic melt.
We note that if phenocryst growth took place mainly by cooling over a 30-60 °C window, then the residence timescales calculated at the final, pre-eruptive temperature of 855 °C may be overestimated. For example, a 30 °C higher mean residence temperature (i.e. 885 °C), would half the modelled diffusion timescales.
The magma chamber was assembled over ~103 years, and mostly over a few centuries to decades prior to the eruption. While Cottrell et al (1999) assumed that this involved most of the erupted magma, Druitt et al. (2012) suggested more conservatively that it involved just the last silicic melt batch to enter the
17
chamber. However, our pyroxene timescale data now lead us to prefer the interpretation of Cottrell et al. (1999), since most of the opx and cpx phenocrysts form a single timescale population (Fig. 6).
Reconstruction of the events
Figure 9 summarises the different events inferred to have occurred over the 17 ky-long inter-Plinian period prior to the LBA eruption. Following the 22 ka Cape Riva eruption, repeated crustal intrusion of hydrous basaltic to andesitic melts generated LBA-like silicic melts through a combination of fractional
crystallization, crustal melting and pluton defrosting. Explosive eruption of small volumes of this silicic magma at 12-13 ka shows that these LBA-like melts were already present at depth by this time (Satow et al. 2015). By several hundred years prior to the LBA eruption a region of variably mushy gabbro/diorite
extended from an unknown upper limit to at least 12 km beneath the volcano. The region consisted of plagioclase, cpx, opx and calcalkaline silicic melts with 6-7 wt% H2O. Amphibole was probably present in cooler (<940 °C) parts of the body. Smaller quantities of more tholeiitic silicic melts may have been present at greater depths. Thermal waxing and waning during prolonged incubation of crystals and melt may have imparted disequilibrium textures on the crystals that were subsequently erupted as phenocryst cores.
Following possible initial upwellings of LBA-like silicic melt, runaway magma chamber assembly began a few centuries prior to the eruption. Rupturing of the mush structure by ascending melts caused
entrainment of plagioclase (An50±7), cpx (Mg# 70-74) and opx (Mg# 65-71) crystals (antecrystic cores). Decompression of volatile-saturated melts with 6-7 wt% dissolved H2O from 240 MPa to 100-160 MPa caused exsolution of 10-15 vol% of vapour during ascent (Druitt et al. 2016). Upon reaching 4-6 km depth, bubbly melts spread out and accumulated in a single large lens (the magma chamber).
Growth of plagioclase, opx and cpx in the ascending melts was driven partly by volatile-saturated decompression during ascent, but mostly by several tens of °C cooling in the new upper crustal
environment. Any amphibole inherited from the source was resorbed. Silicic melts arriving in the magma chamber were progressively homogenized by convection (Druitt et al. 2012, supplementary discussion). Arrival of silicic melts (carrying source-derived plagioclase antecrysts with H2O-rich MIs) were still ongoing within two years of the eruption, and a small volume of andesite was introduced in the final months to days before eruption (Cottrell et al. 1999). At some late stage, after the growth of most crystals, the rhyodacite mixed with a radiogenic, aphyric melt (Martin et al. 2010).
Finally, conditions were attained within the magma chamber for the propagation of a dyke to the surface, and the eruption began. During ascent, the dyke intersected a variably crystallized shallow intrusion of high-Ba, amphibole-bearing diorite, pushing out some of its contents (see Fig. 12 in Druitt 2014). It is possible that the radiogenic, aphyric melt recognized by Martin et al. (2010) resided within this intrusion, which was indeed more radiogenic than the rhyodacite. Entrainment of rimless An50±7 plagioclase and 69 wt % SiO2 melt may have taken place from crystal mushes of the magma chamber floor as the caldera collapsed during phase 4. Assuming a 45 km2 area comparable to that of the caldera, a large
18
proportion of the <2-km-thick magma chamber must have been emptied during the eruption to account for the 30-80 km3 DRE volume discharged.
Dynamics of melt extraction and ponding
Our evidence for the LBA eruption agrees with an emerging consensus that large silicic magma chambers can be assembled on geologically short timescales through high-flux melt transfer events (Allan et al. 2013; 2017; Wotzlaw et al. 2014; Barker et al. 2016; Cooper et al. 2017; Fabbro et al. 2017). It is also consistent with the mush instability model, in which dispersed melt-rich domains rapidly amalgamate to form one or more large lenses of eruptible magma (Christopher et al. 2015; Cashman et al. 2017; Sparks and Cashman 2017). The time-averaged flux of melts into the LBA magma chamber during assembly is estimated at 0.1-1 km3.y-1 (50 km3 in 500-50 y). These estimates are higher than that of Druitt et al. (2012) (>0.05 km3.y-1), who envisaged that only a few km3 of the magma ascended on these timescales, not all of it. Rapid transfer of such large volumes of viscous, silicic magma would require three conditions.
1. The melt was already segregated into macroscopic melt-rich pockets and lenses in the source region, perhaps due to porous flow instabilities (Solano et al. 2012) or tectonic stresses (Katz et al. 2006; Weinberg et al. 2015), as observed in some fossilized intrusions (Brown 2013; Holness 2018 and references therein); another possibility is that the melt was stored as a sill complex deep within the subcaldera pluton (Jaxybulatov et al. 2014).
2. Compaction-driven melt flow took place through a network of high-permeability conduits or dykes (Petford et al. 1993; Menand et al. 2015), since intergranular flow of silicic melt would be far too slow (e.g., Solano et al. 2012).
3. Unless compensated by basaltic intrusion at depth, rapid extraction of large volumes of silicic melt from the source region was accompanied by (or driven by) subsidence, creating space for the inflating magma chamber higher up (Weibe and Collins 1998; Cruden 1998; Grocott et al. 2009).
Instability of the source region would have initiated a complex chain of magmatic processes consistent with our observations: mixing of compositionally and thermally diverse melt batches, thermal cycling of entrained crystals, polybaric melt ascent, and decompression- and/or cooling-driven crystal growth as the heterogeneous melt mixture drained upwards. The appeal of this mechanism is that it might have occurred on timescales governed by the rheology of the crystal mush, possibly as short as a few years (Sparks and Cashman 2017). More research is required to understand what caused the LBA source region to unlock and compact. It may have occurred spontaneously once (following melt production over many thousands of years) the melt fraction exceeded some threshold. Alternatively, some combination of basaltic intrusion (Cottrell et al. 1999), seismic shaking (Davis et al. 2007; Gottsman et al. 2009) and faulting (Allan et al. 2017) due to a regional rifting event may have been responsible.
It is also unclear why the ascending melts injected to form a short-lived holding chamber at 4-6 km depth, rather than vent directly at the surface. One possibility is that the top of the subcaldera pluton was a
19
level of steep vertical gradients in density and rheology between underlying ductile mushes and overlying brittle subsolidus rock. Sill formation occurs where dykes encounter layers of low density or high rigidity, causing magma to inject laterally (Menand 2011). Epicentres of earthquakes beneath the caldera during unrest in 2011-12 were limited to the upper few km of the crust (Newman et al. 2012), suggesting that the brittle-ductile transition indeed lies a few km beneath the caldera. The LBA magma chamber might be visualized as a ‘tear’ near the top of the foundering subcaldera pluton, into which the ascending melts injected. Other possibilities are that the ascending melts intruded by hydrofracturing along a level of crustal weakness (Castro et al. 2016), or that they injected along a low-angle shear zone, as observed in some exhumed intrusive complexes in the Aegean region (Rabillard et al. 2015). We envisage that the bubbly magma remained in this transient holding chamber until sufficient overpressure had developed to drive a dyke to the surface through the cool, brittle uppermost crust and initiate eruption (Degruyter et al. 2015). Uplift and rifting of the surface above the magma chamber may have caused reactivation of caldera faults like the Kameni line, along which the eruption began (Fig. 1c).
The eruption ‘trigger’
The evidence for high-flux transfer of large volumes of bubbly silicic melt into the upper crust over the centuries and decades prior to the LBA eruption implies that the eruption itself was almost certainly a consequence of that process. The final input of silicic magma occurred less than two years before the eruption onset; the bubbly magma may have risen to the top of the chamber and been discharged first, explaining the presence of H2O-rich plagioclase-hosted MIs early in the eruption. It was conceivably this final melt batch that tipped the magma overpressure over the threshold for dyke propagation, triggering the eruption. However, in another sense the eruption had been ‘triggered’ as much as several centuries previously by the onset of instability deep within the subcaldera pluton. The LBA eruption was probably not the result of a single trigger process, but a complex chain of events.
The presence of quenched andesitic enclaves in the LBA magma led Sparks et al. (1977) to propose that replenishment by andesitic magma played a fundamental role in causing the eruption by pressurizing the chamber. Indeed, the concept of ‘mafic’ triggering of silicic eruptions is widespread (Pallister et al. 1992; Murphy et al. 1998; Snyder 2000; Leonard et al. 2002; Ruprecht and Bachmann 2010). Cottrell et al. (1999) argued that the andesite was introduced into the magma chamber within a few months to days of the eruption. However our evidence suggests that the volume of silicic melt flooding into the magma chamber was probably much larger than that of the associated andesitic magma. While deep injection of andesite (along with other factors) may have initially played a role in driving the pluton into a state of instability, once silicic melt transfer was underway the andesite may have simply been carried passively from depth by its silicic host, or entrained from nearby intrusions, and have contributed little to
20
High-flux melt transfer events at Santorini
Study of the dacitic products of the Cape Riva eruption has revealed a similar story to that proposed for the LBA eruption (Fabbro et al. 2013; 2017). The Cape Riva eruption was preceded by prolonged leakage of a chemically different dacite, showing that the Cape Riva magma chamber did not exist for more than 2800 ± 1400 y, making it a short-lived feature on geological timescales. Furthermore, phenocryst rim timescales for Cape Riva dacite (1 to 25 y for plagioclase using the Van Ormen et al. 2014 diffusion coefficient; 4 to ~1000 y for opx using the Dohmen et al. 2016 diffusion coefficient) are broadly similar to those for the LBA magma, and record phenocryst residence over the centuries to years prior to eruption. Drawing on MI H2O+CO2 barometry and phase equilibria data, Fabbro et al. (2017) postulated that the Cape Riva dacitic magma ascended in a runaway process from a deep source reservoir to a short-lived, shallow holding chamber, from which it subsequently erupted.
It therefore seems likely that rapid magma chamber assembly prior to Plinian eruptions is a general process at Santorini volcano. This behaviour resembles that of Taupo caldera, where studies also imply rapid magma chamber assembly prior to large eruptions (Allan et al. 2013; 2017; Barker et al. 2016; Cooper et al. 2017). Both Santorini and Taupo lie in active continental rift environments (Nomikou et al. 2016; Beaven et al. 2016), suggesting possible roles of seismicity and crustal extension in triggering high-flux melt transfer events at the two systems.
While the normal ascent rate of silicic magma into the upper crust below Santorini through slow compaction of crystal mushes may be sufficient to form small, shallow magma pockets, major
destabilization events may be required to build the large magma chambers that feed Plinian eruptions and form calderas. Indeed, if magma chamber formation is driven and accommodated by deep instabilities, then Santorini caldera might be the surface expression of foundering extending down to the middle crust, both above and below the upper crustal chamber (Fig. 10). The estimated flux of melt to the inflating magma chamber prior to the LBA eruption (0.1-1 km3.y-1) is two to three orders of magnitude higher than eruption rates during inter-Plinian periods (0.001 km3.y-1). Repeated destabilisation events in the pluton beneath Santorini may provide a way of reconciling a continuous supply of basaltic magma and heat to the base of the crust with the intermittency of large silicic eruptions.
CONCLUSIONS
Integration of mineral zoning patterns, modelling of multi-mineral diffusion profiles, analysis of crystal size distributions, mineral thermometry, laboratory phase equilibria experiments, and mixed-volatile melt inclusion barometry have enabled us to unravel the history of the rhyodacitic magma of the 30-80 km3 DRE Late Bronze Age (LBA) caldera-forming eruption, and to refine and reconcile the different models that have been proposed previously for this system (Cottrell et al. 1999; Martin et al. 2010; Druitt et al. 2012). Diffusion profile modelling provides timescales for high-temperature residence of three main phenocryst
21
phases (plagioclase, opx, and cpx) that are consistent to within an order of magnitude, and records one or more events of phenocryst crystallization that took place over the several centuries to years prior to the eruption.
The LBA magma had a two-step history, in accordance with recent conceptual models (Fig. 10; Annen et al. 2006; Brown 2013, and references therein). (1) Prolonged production over at least 8-9 ky (from 12-13 ka to eruption) of silicic melt, mostly in a dioritic/gabbroic region at 8-12 km depth in the subcaldera pluton. (2) Rapid transfer of large volumes of silicic melt to the top of the pluton, where it accumulated to form a magma chamber (4-6 km depth). The crystallization event records the ascent of the vapour-saturated silicic melt and its subsequent cooling in the magma chamber. Magma chamber assembly may have been driven by sudden instability and compaction of the source region (Christopher et al. 2015; Sparks and Cashman 2017), with extraction of melt and associated fluids over a geologically short period of time. The magma chamber may have been a transient holding level near the top of the subcaldera pluton, at the boundary between underlying ductile mushes and overlying brittle, subsolidus crust.
The location of Santorini in a seismically active continental rift zone raises the possibility that magma chamber assembly was triggered by an episode of tectonic rifting and seismicity, possibly accompanied by basaltic injection into the deep crust. The high rates of upper crustal melt accumulation inferred prior to the LBA eruption (0.1-1 km3.y-1) are two to three orders of magnitude higher than the time-averaged eruptive rates during inter-Plinian periods (0.001 km3.y-1), and are consistent with accumulation rates necessary to build shallow magma chambers in thermal models (Annen 2009; Gelman et al. 2013; Menand et al. 2015).
Rapid magma chamber assembly also took place prior to the 22 ka Cape Riva eruption (Fabbro et al. 2013; 2017), and may be a general process for caldera-forming eruptions at Santorini. Repeated deep destabilisation events provide a way of reconciling a continuous supply of basaltic magma and heat to the base of the crust with the intermittency of caldera-forming eruptions. It is consistent with the emerging view that large melt-dominated magma chambers are transient features on geologic timescales (Glazner et al. 2004; Druitt et al. 2012; Cooper and Kent 2014; Barboni and Schoene 2014). Had modern geophysical techniques been available a few centuries or decades prior to the LBA eruption, they might have detected a thick column of crystal mush (e.g., Chu et al. 2010; Huang et al. 2015) or stacked sills (Jaxybulatov et al. 2014) beneath Santorini, but probably not a large shallow chamber of melt.
ACKNOWLEDGEMENTS
We thank Jean-Luc Devidal and Jean-Marc Hénot for their expertise in electron microprobe analysis and electron microscopy, respectively, Gareth Fabbro for allowing us to modify his pyroxene diffusion program, Julia Hammer for her introduction to the SHAPE software, Chad Deering for discussions, and Madison Myers for comments on the manuscript. Reviews by J. Ganguly and C.J.N. Wilson were very helpful. TF
22
acknowledges support from the Atlantis-INVOGE program and a National Science Foundation (NSF) EAPSI fellowship grant. HT is supported by a Royal Society University Research Fellowship. MDH acknowledges support from NSERC (Canada) Discovery grants. This is Laboratory of Excellence ClerVolc contribution number 305.
FIGURE CAPTIONS
Fig. 1. Summary of geological features of Santorini and the Late Bronze Age (LBA) eruption. (a) Map of the
Santorini-Amorgos rift zone showing major normal faults (circle on the hanging wall), and the three main subsidence basins. The extent of submarine ignimbrite from the LBA eruption mapped from seismic profiles is shown in yellow (after Sigurdsson et al. 2006). (b) Summary of the activity of Santorini since the 22 ka Cape Riva caldera-forming eruption. (c) Map of Santorini caldera, showing the products of the LBA eruption (including the three main ignimbrite fans from eruptive phase 4), the outline of the shallow Cape Riva caldera that existed prior to the LBA eruption (after Athanassis et al. 2016), the Kameni Line, and the site of the phase 1 vent (after Bond and Sparks 1976). (d) Schematic log of the products of the LBA eruption, with the distributions of the juvenile components and some key cognate components (after Druitt 2014).
Fig. 2. Summary of some previously published petrological features of the Late Bronze Age rhyodacite. (a)
Schematic of the different plagioclase types (after Druitt et al. 2012). (b) Histogram of anorthite (An) contents of microprobe analyses, showing that the An40±3 rims and An50±7 calcic cores of the crystals form two distinct populations (after Druitt et al. 2012). (c) Water contents of plagioclase-hosted melt inclusions as functions of An content, with relationship to the core/rim stratigraphy of a typical core-bearing plagioclase crystal (from Druitt et al. 2016). (d) Water contents of plagioclase-hosted melt inclusions in the rhyodacite as functions of eruptive phase, showing that most H2O-rich melt inclusions occur in the cores of phenocrysts of phase 1.
Fig. 3. (a,c,e) Back-scattered electron (BSE) images of three representative opx crystals. Crystal S82-30 02
has a magnesian core, whereas crystals S82-34 34 and S82-30 30 each lack one. Numbers in yellow are spot analyses of Mg# (mol %). Numbers in white are diffusion timescales (in years) across the boundaries shown by white lines. (b,d,f) Diffusion profiles for representative zone boundaries (profiles shown by red lines on the BSE images). For reasons of clarity, only the central parts of the profiles appear on the figure. The grey zone around the profile data points shows the analytical uncertainty on the measurements.
Fig. 4. (a) Compositional maps for Mg and Al for a typical weakly zoned opx crystal. The Al map shows clear
23
two and higher frequency variations in Al than in Mg#, suggesting that most of the gradients in Mg# are due to diffusion, not growth. The location of the profile is shown by a yellow line on the Mg map.
Fig. 5. (a,c,e) Back-scattered electron (BSE) images of three representative cpx crystals. Crystals S80-119 04
and S82-34 33 have magnesian cores eaten into by wispy diffusion fronts of more Fe-rich compositions (see insets), whereas crystal S79-101 14 has no core. Numbers in yellow are spot analyses of Mg# (mol %). Numbers in white are diffusion timescales (in years) across the boundaries shown. (b,d,f) Diffusion profiles for representative zone boundaries (profiles shown by red lines on the BSE images). The grey zone around the data points show the analytical uncertainty on the measurements. Orientations of the cpx crystals were determined using the SHAPE software (Dowty 1987), using cpx unit cell parameters a:b:c: = 1.097:1:0.596 and = 106.97°, by matching measured interfacial angles with those of modelled cpx sections.
Fig. 6. Mg-Fe diffusion timescale spectra for (a) opx and (b) cpx, determined in both cases perpendicular to
the c axes of the crystals, as described in the text. Timescales determined on zone boundaries within the crystal rims are colour coded according to fit quality of the diffusion model to the measured Mg# profile. The error bars are calculated from the uncertainty on the √4𝐷𝑡 fit parameter, which takes into account the small analytical error (the error propagation calculation is explained in Online Resource 3). The insets on both figures show diffusion timescale as a function of distance from the crystal edge to the core-rim boundary (or centre of crystal in crystals lacking cores), normalized to one. The opx timescales are calculated using the diffusion coefficient of Dohmen et al. (2016); the small dots show the timescales obtained using Ganguly and Tazzoli (1994) for comparison. The cpx timescales are calculated using the diffusion coefficient of Müller et al. (2013) corrected for diffusion anisotropy, as explained in Online Resource 3.
Fig. 7. (a) Sketches of two endmember scenarios for the growth of pyroxene phenocrysts in the Late Bronze
Age magma. In the upper scenario, the crystal grows to its final size, then sits at high temperature until eruption; in the lower scenario the crystal grows progressively. (b,c) Variation of diffusion–derived residence timescales for intra-rim zone boundaries as a function of depth in the crystal. The grey lines depict linear growth from different onset times. Blue dots are timescales from within the crystal rim, and red dots are timescales from the core-rim boundary. Data for the wispy core-rim boundaries in cpc crystals have been omitted, for reasons discussed in the text. Most crystals appear to have grown progressively until the moment of eruption quench, corresponding to the lower case in (a).
Fig. 8. Pressure-temperature diagram showing the pre-eruptive magma chamber (orange) and the main
source region for the rhyodacite (green). Crystallinity contours (in wt%, grey lines) and plagioclase anorthite content (An%, black lines) for the LBA rhyodacite are extrapolated from the phase equilibria experiments of