CAMBRIDGE, MASSACHUSETTS 02139
AN ANALYSIS OF PLUTONIUM RECYCLE FUEL ELEMENTS IN SAN ONOFRE-I
by Bruce F. Momsen David D. Lanning Edward E. Pilat May 1974 MITNE-161
by
Bruce F. Momsen David D. Lanning Edward E. Pilat
ABSTRACT
A method has been developed to allow independent assessment of the use of plutonium recycle assemblies in operating reactors. This method utilizes Generalized Mixed Number Density (GMND) cross sections (based on Breen's Mixed Number Density cross sections) and the spectrum code LASER.
LASER is modified to form LASER-M by adding ENDF/B-II thermal cross
sections for the plutonium isotopes; adding edits to output G-aND cross sections, approximate microscopic removal and transport cross sections; and increasing LASERs compatibility with commonly used diffusion theory codes such as PDQ.
Plutonium critical experiments for a number of lattices of 1.5 w/o and 6.6 w/o plutonium are analysed with LASER-M which is found to give better criticality agreement than LASER (without the ENDF/B-II plutonium cross
sections) and other published data.
Unit assembly power distributions are calculated for a uranium assembly and a constant and graded enrichment plutonium assembly both
surrounded by uranium assemblies. The use of LASER-M with GMND cross sections is found to give excellent agreement with the published calculations of power distributions for the uranium assembly and good agreement for the plutonium assemblies.
A quarter core depletion calculation of the San Onofre reactor containing four plutonium recycle demonstration assemblies is performed using the diffusion theory computer code PDQ-7. Use of PDQ-7 with GMND cross sections from LASER-M is shown to give excellent agreement with quasi experimental power distribu-tions at cycle burnups of 0 MWD/MTM, 3342 MWD/MTM, and 6045 MWD/'MTM. Also, the calculated value of k-eff versus cycle burnup is determined to be in excellent agreement with the actual operating condition of k-eff = 1 .000.
The work described in this report has been performed primarily by the principal author, B. F. Momsen, who has submitted substantially the same report in partial fulfillment of the requirements for the Nuclear Engineer and Master of Science degrees at M.I.T.
The principal author gratefully acknowledges the financial support received for this study. The majority of the computer and related costs of this study, as well as a summer Research Assistantship for the principal author, were shared equally by the NUS Corporation and Southern California Edison. Additionally, the principal author gratefully acknowledges the timely and generous financial support of the Yankee Atomic Electric Company
0f
which provided funds for the costly quarter core depletion.The principal author would like to thank Bill Flournoy of SCE for his work in the processing of the ENDF/B-II cross sections, and his constant willingness to supply the principal author with information required to
complete this study. The principal author would also like to thank Alex Deng and Steve Bauer of SCE and Ray Sullivan of NUS for their assistance in this study.
Additionally, special thanks go to Brian Kirschner of Yankee Atomic whose valuable assistance in the final quarter core depletion was greatly appreciated.
The principal author wishes to express his appreciation to the many typists who have assisted in the completion of the final manuscript and a special word of thanks to Joan Johnson whose help was greatly appreciated.
the principal author can now share in much more than while completing this study.
Page No. ABSTRACT ... ... 0 * 00.00.0 .. .000 * 0 . ACKNOWLEDGEMENTS ... TABLE OF CONTENTS ... ... LIST OF FIGURES... ... LIST OF TABLES ... . ... 00 1. INTRODUCTION 1.1 Project Description ... 1.2 Research Objectives . ... 1.3 Benchmarks ... 1.3.1 Introduction... .. ... ... 1.3.2 Critical Experiments . ... 0... ... ... .. 1.3.3 Calculated Power Distributions
1. 3.4 "Experimental' Power Distributions ... 1.4 Basic Methods and Assumptions ... ...
1.4.1 General Comments on Neutronic Analysis of Plutonium Fuel . . . . ... . . . . 1.4.2 Neutron Spectrum Calculation .. .. .. . .. . .
1.4.3 Generalized Mixed Number Density (GMND) Cross Sections . . . ... ... ... 1.4.3.1 Basis of Theory ... 1.4.3.2 General Application ... .... .000... 2. DESCRIPTION OF COMPUTER CODES
2.1 LASER ... 2.2 LIBP ... 2.3 LEOPARD ... . 2.4 PDQ-7/HARMONY...,... 2 3 5 9 11 13 14 18 18 18 18 20 21 21 26 30 30 38 42 43 44 47
3.1 Introduction...
3.2 Cross Section Changes ... *...
3.2.1 Thermal Cross Section Library -3.2.2 Thermal Resonance Parameters . . .
3.2.3 Fast Cross Section Library ... ...
3.4.2 Validation of Modifications .. . . . ... .. .. 3.3 Output Edit Additions ... ... .. .
3.3.1 Introduction...
3.3.2 Approximate Microscopic Transport Cross
Section .. .-.. - .-.-. -
-3.3.3 Approximate Microscopic Removal Cross Section ... . ... ...
3.3.4 Diffusion Coefficient Averaged Over Moderator Only ... ... ... ...
3.3.5 Spectrum Averaged Nu (V) and Kappa Fission (K;).
3.3.6 Neutron Velocity Averaged Over Gradient Spectrum . .* .. 0 0 0 .... ... 09 00 . .. 0 .. .. .. 3.3.7 Generalized Mixed Number Density (GMND)
Cross Sections - - - - ..- -
-3.3.8 Other Miscellaneous Additions ... ... 3.4 Elimination of Errors, Output Reduction, Changes
to Input .... ... ... .... ... ... .... ... ... 3.4.1 Elimination of Errors ...
3.4.2 Output Reduction ... . 3.4.3 Changes to Input ...
4. COMPARISON OF LASER-M CALCULATIONS WITH PLUTONIUM CRITICAL EXPERIMENTS
4.1 Introduction . . . .. . . ... . . . . . . 4.2 Experiments Using 1.5 w/o PuO2- U02 Lattices ...
4.3 Experiments Using 6.6 w/o Pu02-UO2 Lattices 4.4 Results of Calculations and Comparison to Other
Calculations . ... . . ... . 4.5 Conclusions ... ... ....
49
50 50 5156
56
57
57
59
62 6364
65
66 67 67 67 68 6969
71 71 765.1 Introduction ... ... 5.2 Few Group Spectrum Averaged Cross
Sections (LASER) ... ... ... * ... 5.2.1 Definitions of Various Unit Cells ...
5.2.1.1 Normal Cell... . ... . . . . 00
5.2.1.2 Assembly Average Cell ... 5.2.1.3 Cell Around Water Holes ... 5.2.1.4 Unfueled Cell ... ...
5.2.2 Input Quantities ... . .. .... . . ... . .. . . . .. . . 5.2.2.1 Cell Geometry .... a . . . .. .. 5.2.2.2 Cell Expansion . . . . . .. . . . . . ..
5.2.2.3 Atom Number Densities ... .. . .. ... . ..
5.2.2.4 Effective Fuel Temperature (EFTEMP) and Temperature to Doppler Broaden the 1.056 eV Pu-240 Resonance (TEMP). 5.2.2.5 Buckling . . . .. . . 5.2.3 Options Selected . . . . . 5.2.4 Unfueled Cell. . . . . 5.2.5 Output Quantities . ... ..00.. . . . .. . 5.3 Two Group Diffusion Equation Theory Calculations
(PDQ-7) . .0... . ... . .0.. ... .. 0.. .. 0.0.0. . ... .... 5.3.1 Input Quantities .**000000... .0* 5.3.2 Output Quantities. ... . .. . . ...
6. COMPARISON OF CALCULATIONS WITH REFERENCE CALCULATIONS - TWO DIMENSIONAL BEGINNING OF LIFE (BOL) POWER DISTRIBUTIONS
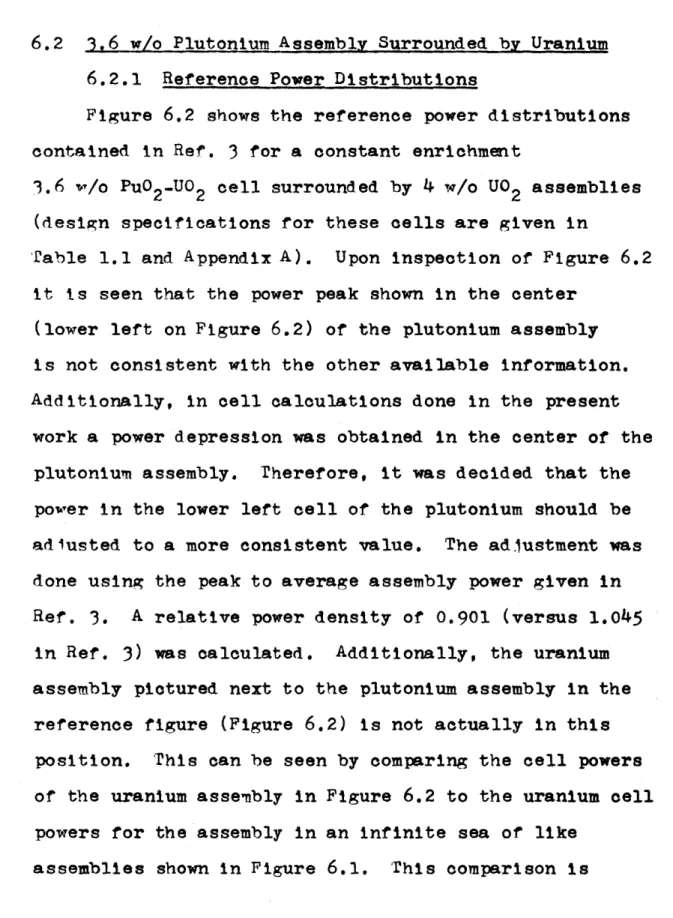
6.1 UraniumnAssembly ... 6.2 3.6 w/o Plutonium Assembly Surrounded by
Uranium .. ... ... 0000000.. 6.2.1 Reference Power Distributions ...
6.2.2 Results of Basic Calculations . . . . 6.2.3 Supplemental Calculations ... ... 6.3 Graded Enrichment Plutonium Assembly
Surrounded by Uranium ...0 00000 6.4 Conclusions ...
79
80
80
80
80
80
81
81
81
8182
83
84
89
90 9194
94
96
97
102 102104
110 112116
CALCULATION (LASER)
7.1 Introduction ... ... 7.2 Depletion Procedure ... ... ... .
7.2.1 General Description
7.2.2 Resonance Capture of U-238 ... 7.2.3 Pseudo Fission Product Cross
Section Representation ... ...
7.2.4 Boron Concentration ... .. . .. . 7.3 Depletion Results .. . . .. . .. . . . .
7.3.1 Changes in Cross Sections During
Depletion .. . . . . . o .. . . . . ... . ... .. .. .. 7.3.2 Comparison of LASER-M and
LEOPARD-R Depletion .. . . . ... 7.3.3 Comparison of Uranium and Plutonium
Cell Depletion . .. . . .* 0 0 .0 .0 . ....0 00 ... 0 8. TWO DIMENSIONAL DEPLETION CALCULATIONS
(PDQ- 7)
8.1 Introduction .. . .. .. 0 .0 ..00 .. ... 0 0 ... 0 00 ... 0. 0. 8.2 Unit Cell Depletions ... 0..0... 8.3 Quarter Core Depletions .. ... 0.. .
8.3.1 Reference Power Distribution . * ... 8.3.2 Calculated Power Distribution ... 9. CONCLUSIONS and RECOMMENDATIONS ...
References ... Appendices
A - Reference Data List (Supplement to TABLE 1.1) ....
B - Comparison of Spectrum Averaged Cross
Sections,y ,
K
from LEOPARD -R and LASER-M. C - Processed ENDF/B - II Plutonium Cross SectionsInput to the LASER-M Thermal Library...0... ... D - Input Instructions for LIBP and List of Cards
Used to Change LASER Thermal Library .
E - Listing of Changed Subroutines in LASER-M ...
F - LASER-M Input Data for 1.5 w/o Pu02-U0 2 and 6.6 w/o PuO2-U02 criticals ...
G - Supplemental Description of Computer Code LASER ... 127 129 129 131 131 136 139 139 143 147 147 149 149 151 164 167 172 173 177 182 186 215 220
9
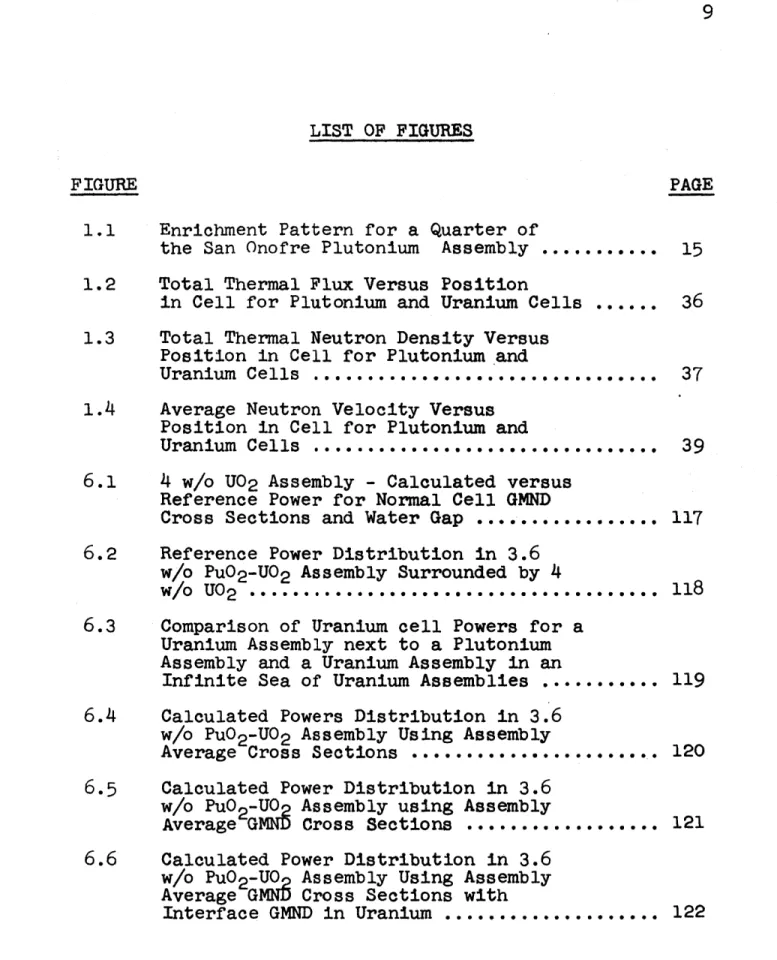
LIST OF FIGURES
FIGURE PAGE
1.1 Enrichment Pattern for a Quarter of
the San Onofre Plutonium Assembly ...
15
1.2 Total Thermal Flux Versus Positionin Cell for Plutonium and Uranium Cells ... 36 1.3 Total Thermal Neutron Density Versus
Position in Cell for Plutonium and
Uranium Cells ...
37
1.4 Average Neutron Velocity Versus Position in Cell for Plutonium and
Uranium Cells ... .. *... **.... ... ...
39
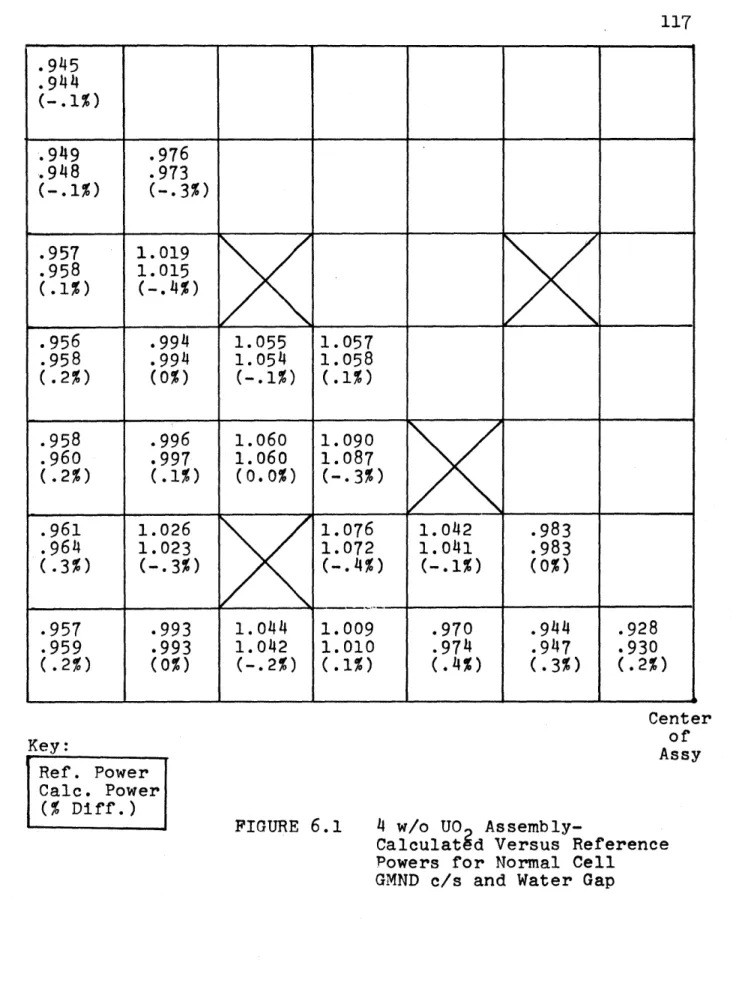
6.1 4 w/o U02 Assembly - Calculated versusReference Power for Normal Cell GMND
Cross Sections and Water Gap ...
117
6.2 Reference Power Distribution in 3.6w/o Pu02-UO2 Assembly Surrounded by 4
w/o U02 --- 0 0 0 0 0 0 118
6.3 Comparison of Uranium cell Powers for a Uranium Assembly next to a Plutonium Assembly and a Uranium Assembly in an
Infinite Sea of Uranium Assemblies ...
119
6.4 Calculated Powers Distribution in 3.6w/o Pu02-UO2 Assembly Using Assembly
Average Cross Sections ... 120
6.5 Calculated Power Distribution in 3.6
w/o Pu02-UO Assembly using Assembly
Average GMND Cross Sections ... 121 6.6 Calculated Power Distribution in 3.6
w/o Pu02-U0 Assembly Using Assembly
Average G;0 Cross Sections with
8.4 Calculated Versus Reference Powers
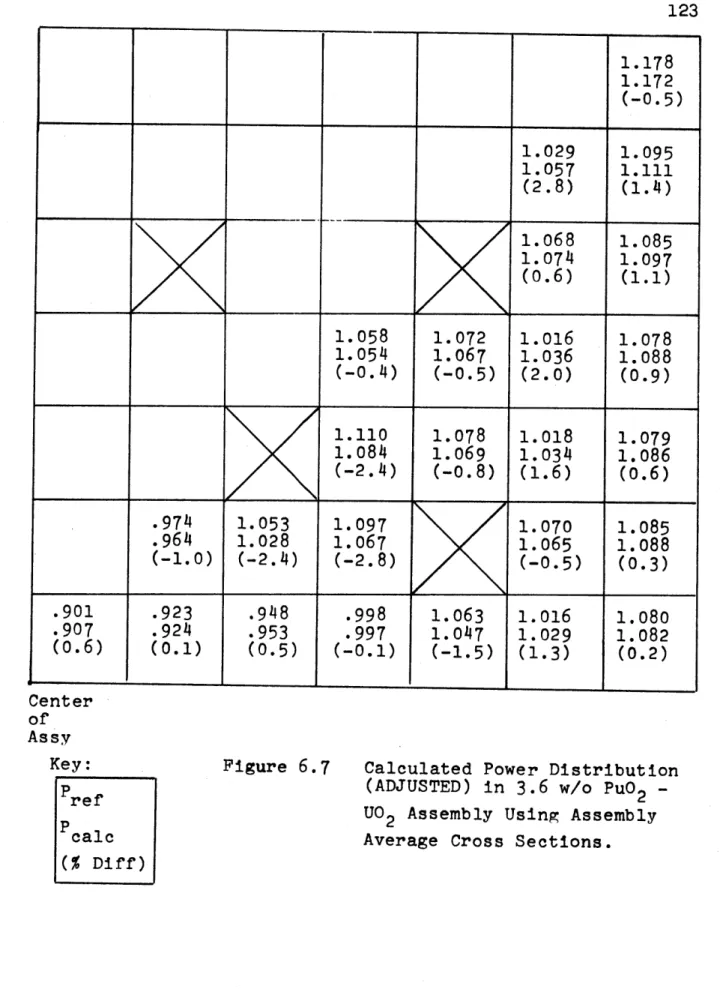
6045 MWD/MTM... at -. 0. -0 * 6.7 Calculated Power Distribution
(ADJUSTED) in 3.6 w/o PuO2-UO2
Assembly Using Assembly Average Cross Sections ...
6.8 Calculated Power Distribution
(ADJUSTED) in 3.6 w/o PuO2-UO2
Assembly Using Assembly Average GMND Cross Section
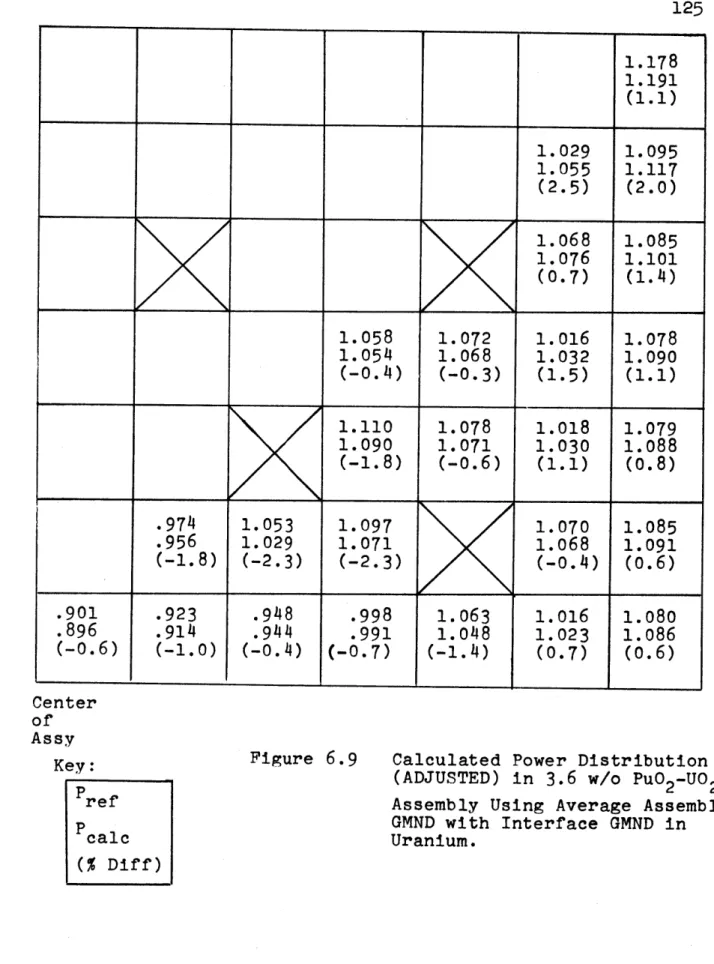
6.9 Calculated Power Distribution
(ADJUSTED) in 3.6 w/o PuO 2-UO2
Assembly Using Assembly Averaged GMND Cross Sections with Interface GMND in Uranium ...
6.10 Graded Enrichment PuO2-UO2 Assembly
Reference Powers ... ... 7.1 Comparison of Kinf versus Burnup for a
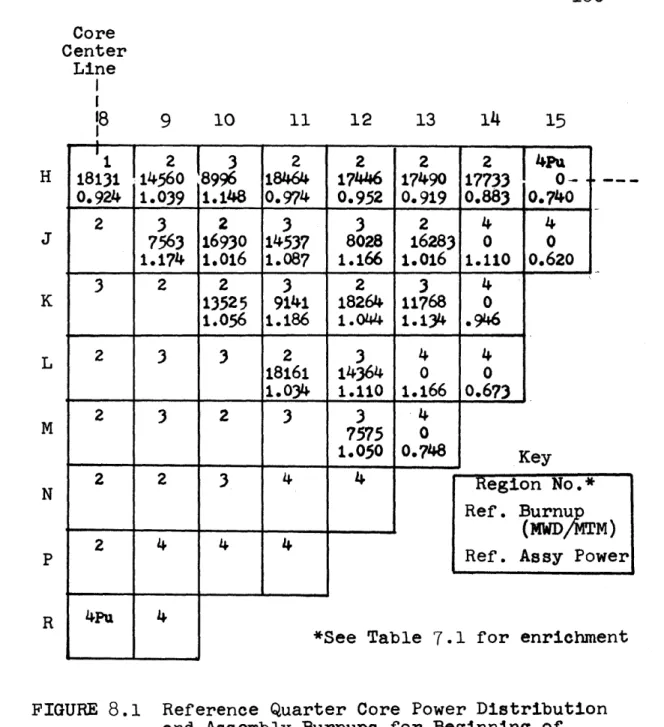
4.0 w/o Uranium cell and a 3.6 w/o Plutonium cell ... . ... 8.1 Reference Quarter Core Power Distribution
and Assembly Burnups for Beginning of Cycle 2.
8.2 Calculated Versus Reference Powers for Beginning of Cycle 2...
8.3 Calculated Versus Reference Powers at 3342 MWD/MTM 123 124 125 126 146 160 161 162 163
LIST OF TABLES
TABLES PAGE
1.1 Specifications for Plutonium and Uranium rods . 16 1.2 Areas of Calculational Uncertainity and
Estimates of Resulting Bias in the Calculated
Kefg .. 24
1.3 Capsule Comparison of Uranium and Plutonium
Nuclear Desigh Characteristics ... 27 3.1 Resonance Parameter Used to Evaluate the Line
Shape Functions for the Pu-239 Resonances ... 50 3.2 Cross Section Parameters at 2200 m/sec for
Various Cross Section Sets .----....-..--... 52
3.3 ENDF/B-II Resonance Parameter Data for the
Pu-240 1.056 eV Resonance ---..---.-.. 54 3.4 Resonance Parameter for Pu-240 Resonance
Input to LASER-M .. **... 56 4.1 Basic Data for 1.5 w/o PuO2 Experiments ... 70 4.2 Basic Data for 6.6 w/o PuO2 Experiments ... 72 4.3 Results of Calculations on the Hanford
(1.5 w/o PuO2) Experiments ... 73 4.4 Results of Calculations on the WREC
(6.6 w/o PuO2) Criticals ... 74 5.1 Basic Results for Beginning of Life LASER-M
Calculations ... 92 6.1 Uranium Assembly - Comparison of Calculated
and Reference Powers ... 99
6.2 Uranium Assembly(4 w/o U-235) - Comparison of Supplemental Calculated Powers with
Reference Powers ... ... 101 6.3 3.6 w/o Pu02-U02 Assembly - Comparison of
12
TABLES PAGE
6.4 3.6 w/o Pu02-U02 Assembly - Comparison of Adjusted Calculated Posers with Reference
Powers ... a * 0 0 0 0. 108
6.5 3.6 w/o Pu02-U02 Assembly - Comparison of Supplemental Calculations with Reference
Powers (Plutonium Assembly only) i.l..l... 111 6.6 Graded Enrichment Pu02-U02 Assembly
-Comparison of Calculated Powers with
Reference Powers ...
114
6.7 Graded Enrichment Pu02-U02 Assembly-Comparison of Supplemental Calculated
Powers with Reference Powers ...
115
7.1 The Various Enrichments (with Loadings)Present During Cycle 2 of San Onofre 1 ... 128 7.2 Percent Variation in Cross Sections
Between 3.3 w/o Pu02-UO2 and 3.85 w/o
Pu02-U02 fuel ... ,... 130 7.3 Effect of Adding Boron on Spectrum Averaged
Cross Sections for Uranium and Plutonium
Cells . . . .. 137
7.4 Percentage Change in Microscopic Cross Sections During Depletion(3.4 w/o
Uranium cell) .. . ...
141
7.5 Comparison of Isotopics.versus Burnupfor a LEOPARD and LASER depletion of a
3.4 w/o Uranium cell .... ... 144 7.6 Comparison of Kinf versus time for a 4.0
w/o Uranium cell and a 3.6 w/o Plutonium
cell Bu....ng....su....rn...for... 145 8.1 Axial Buckling Versus Burnup for a Cycle 2
Depletions ... . . . .. .. . . .. . . . 156 Calculated Keff Versus Cycle Burnup . . . .
CHAPTER 1 INTRODUCTION
1.1 Project Description
With the rapid growth of the nuclear power industry, increasing quantities of plutonium are quickly becoming available in the U. S. The importance of plutonium as an energy source for thermal reactors has been recognized by various groups who have included plutonium utilization in their power planning. In addition to the economic incentive, the available plutonium can constitute a significant fraction of the light water reactor
(LWR) fuel required to meet future energy demands.(1) Additionally, the timely utilization of plutonium
can delay the need for additional uranium enrichment capacity in the U. S.
Neutronic design methods which have been developed for use in uranium fueled LWRs cannot
be applied, a priori, to reactors utilizing recycled plutonium. Government laboratories in several
nations, as well as private industry, have carried out extensive programs to study and demonstrate the feasibility of plutonium recycle. To date, the most current review and analysis of the available
neutronics studies good progress has been made in assessing expected design method uncertainties.
In the present study an analysis of the four plutonium recycle fuel elements which were in the San Onofre pressurized water reactor (PWR) during cycles 2 and 3 was carried out. These assemblies were 14 by 14, graded enrichment mixed oxide (MOX) assemblies with an average of 3.53 w/o plutonium mixed with natural uranium in the form of dished pellets as described in Ref. 3. Figure 1.1 shows a quarter of the MOX assembly and the specifications of the plutonium and uranium fuel rods are given in Table 1.1 with supplementary data in Appendix A. 1.2 Research Objectives
The Edison Electric Institute (EEI) and Westinghouse Electric Corporation have published results of their
analysis of the four plutonium assemblies which can be compared to the published results as well as to
experimental power distributions in the plutonium assemblies for cycle 2.
In the Westinghouse analysis, an improved version of the spectrum code LEOPARD was used. However, it
has been shown by a number of independent workers
Center
of Numbers are total Pu enrichment
Assembly in fuel rods (X denotes water holes).
Figure 1.1
Enrichment Pattern for a Quarter of the San Onofre Plutonium Assembly (Ref. 3)
AND URANIUM ASSEMBLES (Ref. 3)
Fuel Assemblies Region 4-Pu Region 4-U
Assemblies Assemblies
Number 4 48
Rod Array 14 X 14 14 X 14
Rods per Assembly (fueled) 180 180
Rod Pitch (in.) 0.556 0.556
Number of Grids per Assembly 7 7
Fuel Rods Clad Material
Outside Diameter, in. Diametral Gap, in.
Clad Thickness, in. Fuel Length, in.
Fuel Pellets Diameter, in. Material Density (% of Theoretical) Zircaloy-4 0.422 0.0075 0.0243 119.4 0.3659 PuO2- UO2 91 Enrichment - rods/assembly (total)
Nominal Isotopics (fresh fuel), a/o Pu-239 Pu-240 Pu-241 Pu- 2 42 3.3 w/o - 64 3.6 w/o - 2 3.85 w/o - 24 4.0 w/o - 180 80,6 13.4 5.2 0.8 304 SS 0.422 0.0055 0.0165 120.0 0.3835 U0 2 93
17
spectrum code LASER(8) shows better agreement than LEOPARD or similar codes when analysing plutonium cells. Therefore, the basic objective of this research is to develop an analysis procedure using LASER which will be as good or better than the Westinghouse analysis.
Since the published results are almost totally limited to power distribution calculations in the
plutonium assemblies and surrounding uranium assemblies described in Section 1.1, the analysis carried out
in the present work will deal almost exclusively with the power distributions given in Ref. 3.
Although power distribution predictions are certainly considered to be of major concern in reactors utilizing
(9)
plutonium recycle assemblies, other considerations (not analysed here) such as reactivity lifetimes,
control requirements, and numerous safety considerations are also of importance.
The specific benchmarks used for comparative purposes in the present work are briefly discussed
in the following subsections. A good compact discussion of almost all presently available neutronics benchmarks
for plutonium fuel is contained in Ref. 2 which should be consulted for more detailed benchmark information.
1.3.2 Critical experiments
As discussed in Chapter 3, cross section modifications were carried out in LASER. Because of these modifications
and the desire to further ensure that LASER yielded acceptable results when analysing plutonium, a number of critical experiments were analysed. A detailed description of the experimental design and calculated results is discussed in Chapter 4.
1.3.3 Calculated Power Distributions
A major effort of this work was to match the assembly power distributions which were published in
the "reference WCAP" report (WCAP-4167-2) (3) for the plutonium recycle fuel elements used in the San Onofre PWR.
19
The reference WCAP report contains cell powers in
1. a U02 quarter assembly containing 4 w/o
U-235 in an infinite sea of like assemblies, 2. a quarter of a PuO2 - UO2 assembly with a
constant enrichment of 3.6 w/o PuO2 surrounded by UO2 assemblies with 4 w/o U-235,
3. a quarter of a PuO2 - UO2 assembly with
enrichment variations (as shown in Fig. 1.1) surrounded by UO2 assemblies containing
4 w/o U0235.
Additionally, the reference WCAP report contains quarter core power and burnup distributions during cycle 2 (which was the first cycle the plutonium assemblies were present) for the San Onofre PWR.
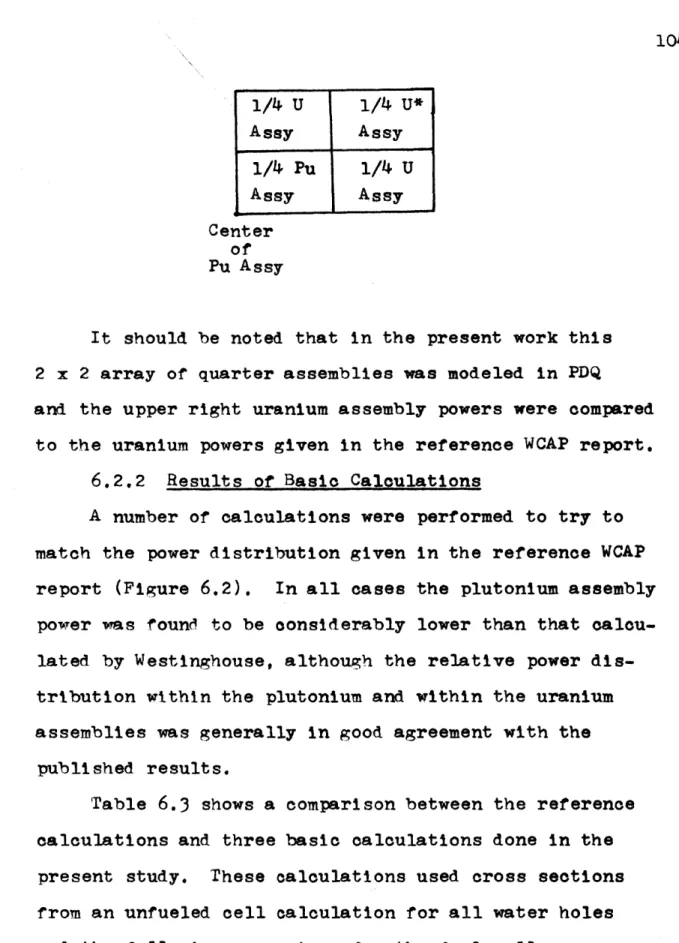
It should be noted that the power distributions in the reference WCAP report are sometimes misleading and contain information which could not be explained by the calculations done in the present work. A
discussion of adjustments to the cell power distributions is presented in Chapter 6 and difficulties in using
the quarter core power distributions is discussed in Chapter 8. It is also important to point out that since these power distributions are calculated instead of experimental, the fact that these results are
reproduced by independent calculations does not necessarily mean that the independent calculations are correct. However, since the basic objective of
this research was to demonstrate that the results given in the reference WCAP report could be
reproduced, these results were used as benchmarks. 1.3.4 "Experimental" Power Distributions
Southern California Edison (SCE) has provided experimental assembly power data for various times during cycle 2 of the San Onofre PWR. This data was used with the quarter core power distributions
during cycle 2 calculated by Westinghouse to produce quasi-experimental assembly powers for each assembly in the quarter core. These quasi-experimental power distributions were then used as benchmarks and compared to the calculated assembly power distributions in
the quarter core. This procedure is similar to the
one normally used to determine the accuracy of calculated assembly power distributions in an operating PWR. A
detailed discussion of the procedure is contained in Chapter 8.
1.4.1 General Comments on Neutronic Analysis of Plutonium Fuel
In general, neutronic analysis of LWRs fueled with plutonium-enriched rods is expected to be less
accurate than an analysis of LWRs fueled with uranium-enriched rods. Basically, this is because more
isotopes are present in plutonium-enriched than in uranium-enriched fuel. In addition, the neutron cross sections of the plutonium isotopes have
significant resonances at thermal and near thermal energies. This resonance structure complicates
the important calculation of the neutron spectra in the plutonium-fueled reactors. Also, in mixed-oxide fuels the interaction of the resonances of uranium and plutonium isotopes in the resonance energy region
further complicates the spectrum calculation.
Finally, since plutonium dioxide exists in the form of particles in mixed oxide fuel, neutron self-shielding effects due to this particulate form also add to the calculational problems.
In practice, various assumptions and approximations are made which simplify the calculational problems.
Some of these assumptions and approximations are inherent in the computer code being used and others
22
result from uncertainties in input parameters. It has been found that, on the average, the errors due to various approximations act in opposite
directions resulting in cancellation of errors. It is obvious that one would like to know the
error to be expected when using a certain calculational procedure, but it is usually very difficult to
accurately assess. Some information, however,
can be obtained from a review of a report by Liikala, et al., (10) who give a fairly detailed assessment of errors which they expected in their analysis of the numerous critical experiments reported in Ref. 11. These include three enrichments (1.8 w/o,
2.0 w/o, and 5.0 w/o) of plutonium in aluminum -plutonium alloy fuels and five enrichments (2.0 w/o
Pu with 8%, 16% and 24% Pu-240; 4 w/o Pu; and 1.5 w/o Pu) of plutonium in uranium dioxide-plutonium dioxide fuels. To this base they added a series of lattice experiments containing U02 - 6. 6 w/o PuO 2 fuel rods which were done at Westinghouse. Additionally, a number of slightly enriched UO2 lattice criticals and some aqueous
solution critical experiments were analysed to gain further insight into possible systematic errors.
Table 1.2 presents a summary of the approximations analyzed by Liikala as well as the effect they are
expected to have on the calculation of keff for the
23
various criticals analysed. Whenever possible, the numbers presented in Table 1.2 are those quoted by Liikala for mixed oxide criticals only. The sign of the bias and the method used to arrive at its magnitude are explained in the report by Liikala, but the signed numbers contained in Table 1.2 are
given simply to show the relative magnitudes of the errors and the possible cancellation of those errors.
Although the bias values listed in Table 1.2 are intended mainly to illustrate the relative magnitudes of potential errors, it is interesting to note that if midrange values are used for the bias values a total bias o; only -0.25% in keff is
obtained (without considering uncertainties in cross section, definition of diffusion coefficient, and use of diffusion theory) illustrating how the errors will
often tend to cancel. Translating the information given in Table 1.2 to the San Onofre plutonium
assemblies or the criticals calculated in Chapter 4 is, at best, a very uncertain process. However, a rough estimate of the bias in keff can be obtained by making use of any trends in error and translating the approximations in the codes used in this work
(Ziikala's codes were fairly similar to those used in
AREAS OF CALCULATIONAL UNCERTAINTY AND ESTIMATES OF RESULTING BIAS IN THE CALCULATED K . (Ref. 10)
AREAS OF CALCULATIONAL UNCERTAINTY 1. Slowing Down Calculation
Spatial fast effect neglected Resonance overlap neglected. 2. Thermalization calculation
Reflecting cell boundary condition assumed
Energy detail
Upper energy limit of thermalization
calculation (Effect of Upscattering Model) Approximation of anisotropy.
3. Leakage Calculation
Axial leakage representation Spatial detail
Energy detail
Diffusion theory assumed accurate.
4. Assumptions Regarding the Geometric Detail of Assemblies
Fuel assumed homogeneous Lattice hardware ignored.
5. Uncertainties in Physical Parameters Nuetron cross sections of the isotopes
Definition of diffusion coefficient Axial buckling used to describe the
axial leakage
Manufacturing tolerances (dimensions, contents, etc) of fuel rods and lattice components. BIAS IN K ff(% -0.2 to - 0.5 0.0 to - 0.5 -0.5 to - 0.1 + 0.1 - 0.7 Negligible 0.25 1.0 -0.5 Suspect 0.1 to 0.7 Less than 0.2. ±1.0 to ± 2.0 ±0.5 Negligible Assumed to Cancel (randomly dis-tributed)
NOTE: Since the criticals analysed were all small, high leakage systems, diffusion theory may itself be introducing
errors. Liikala concludes that diffusion theory tends to overestimate the leakage for the critical experiments
(thus yielding values of Keff which are smaller than transport theory values) but no firm estimate of bias
in keff for mixed oxide criticals was given.
24
this work). By proceeding along these lines a rough estimate of the bias in keff of -0.45% for the
San Onofre fuel and -0.65% for the 1.5 w/o Pu criticals analysed in Chapter 4 is obtained.
By using these already rough estimates an even more approximate value of error can be obtained by comparing the bias of -0.65% for the 1.5 w/o Pu
criticals to the value of 0.541% actually calculated in Chapter 4. If one assumes that the difference in the estimated and calculated values of bias is due to the uncertainties in cross sections and
defi-nition of diffusion coefficient (not considered to
this point) an estimate of the bias in keff of 0.75% is obtained for the San Onofre fuel. That is, the analysis of the plutonium cells done in the present study are estimated to yield values of keff which are 0.75% too high. It should again be emphasized that this is a very rough estimate. Additionally, since lifetime calculations were not an integral part of this work the accuracy of the calculation of keff is not of paramount importance and enters only through its
effect on the relative powers in the various cells and assemblies.
It is instructive to further consider the major differences between uranium and plutonium fueled LWRs. Basically, the much larger thermal
yields a harder (i.e. higher average neutron energy) thermal spectrum and a lower total thermal flux in a plutonium fueled reactor than in a uranium fueled reactor. Additionally, the increased resonance
structure of the plutonium isotopes results in a more negative Doppler coefficient and the depletion
characteristics of a plutonium core differ from those of a uranium core. The effect of these differences on important design parameters is listed in Table 1.3 which also gives a capsule comparison of the
differences between uranium and plutonium fueled LWRs. For a more detailed discussion of the problems involved in analysing plutonium-enriched fuel and the general differences in plutonium and uranium fuel the reader should consult Refs. 2, 6, 9, and 10.
1.4.3 Neutron Spectrum Calculation
By far the most commonly used method to solve the neutronics problem in nuclear reactors today is to use diffusion theory with two to four energy
groups to calculate the neutron behavior in the various region of the reactor. In order to do the diffusion calculation, varying degrees of cell homogenization and spectrum averaging must be carried out to obtain the group averaged cross sections, a or Z, and volume
-CAPSULE COMPARISON OF URANIUM AND PLUTONIUM NUCLEAR DESIGN CHARACTERISTICS (Ref. 3)
PARAMETER Moderator Temperature Coefficient Doppler Coefficient Cold-to-hot Reactivity Swing Installed Reactivity Control Rod Requirement
Control Rod Worth Boron Worth
Xenon Worth Fission Product Poisons
Local Power Peaking
PLUTONIUM CORE More Negative More Negative Increased Reduced Increased Reduced Reduced Reduced Increased Increased
REASON FOR DIFFERENCE Increased resonance absorption and spectrum shift Pu-240 resonances Larger moderator temperature coefficient Reduced depletion rate
-Reactivity saturates Larger moderator and Doppler coefficients Thermal flux reduced Thermal flux reduced Thermal flux reduced Increased yields-Increased resonance absorptions
Increased water worth
purpose of the neutron spectrum calculation is to determine
the energy dependence of the neutron flux, (E), such that group averaged cross sections may be obtained by flux weighting the various cross sections. In general, the group averaged cross sections, a , which are input to various diffusion codes are calculated in spectrum codes using
S E o (E) (E) dE
a
= 9(1.1)
$(E)dE E
g
where E is the energy range of group g.
From the above it is obvious that the most basic assumption in this method is that the space and energy dependence of the flux are separable since the spectrum (energy) calculation and the diffusion (spatial) calculation are carried out separately.
The neutron spectrum calculation can be done with a wide variety of computer codes which are described in Refs. 12 and 13. Perhaps the most widely used codes in the commercial nuclear
power industry are LEOPARD (4) and LASER (8), which are described in Sections 2.3 and 2.1, respectively. These codes have cross
section libraries which, in general, contain absorption, fission, and scattering cross sections as well as resonance parameters for the various nuclides at many different energy points. It is
im-with an assumed neutron spectrum. Then, in the spectrum codes, the neutron spectrum is calculated with varying degrees of rigor and the group averaged cross sections are obtained.
In both LEOPARD and LASER the unit cell which is modeled is assumed to be in an infinite sea of like cells (since zero net current boundary conditions are used) and the fast flux is assumed spatially flat across the cell.
As mentioned in Section 1.2, LASER has been found to cal-culate plutonium cells more accurately than LEOPARD. Basically, this is because of the difference in the thermal calculation since both codes employ MUFT 1 4)in the fast region. In the thermal energy range LASER actually calculates, using integral transport theory, the neutron spectrum at up to 14 space points in the
cylindrically modeled unit cell, whereas LEOPARD is essentially a zero-dimensional calculation.
In plutonium cells, this spatial calculation is very importnat due to the strong spatial dependence of the plutonium isotopes with
(6)
burnup. Celnik, et al., show results for the 6.6 w/o PuO 2 2 Saxton fuel burned to 25, 000 MWD/MTM which illustrates this effect. In Celnik' s figures, variations in plutonium number den-sities from the center to the edge of the fuel are shown to be about 20% for Pu-239, 14% for Pu-240, and 110% for Pu-241. Celnik also
tend to be canceled by the softer spectrum of the zero-dimensional calculation, with both LEOPARD and LASER giving essentially identical reactivity data as a function of burnup for the Saxton fuel. It should be pointed out that this by no means implies that isotopics
(nuclide concentrations of the various isotopes) versus burnup in the two codes also show good agreement (see Sections 4.5 and 7.2
for further discussion).
Another advantage in using LASER lies in the fact that it has an upper thermal energy cutoff of 1.855 eV versus LEOPARDs cutoff of 0.625 eV, allowing the huge Pu-240 resonance at 1.056 eV to be more precisely treated in the thermal region.
In conclusion, it is a generally accepted fact that LASER will more accurately calculate plutonium systems and for that reason LASER was used as the basic spectrum code in this work.
1.4.3 Generalized Mixed Number Density (GMND) Cross Sections 1.4.3.1 Basis of Theory
The Generalized Mixed Number Density (GMND) cross sections were developed by Mertens(5) at M. I. T. and are an extension of the Mixed Number Density (MND) cross section theory developed by Breen. (15) Breen points out that the standard
procedure of using regionwise thermal constants with flux and current continuity in diffusion calculations results in a calculated discontinuity of activation at boundaries between dissimilar media.
result of doing separate asymptotic spectrum calculations (as discussed in Section 1.4.2) for the various regions. In additional, since the regionwise constants do not account for a softening of spectrum approaching a water gap, the peaking with the normal model may be under estimated by as much as 20%. (15)
Breen shows that the one-group diffusion equation,
-DV 2 + t S, (1.2)
where D and I are spectrum averaged values of the diffusion t
coefficient and macroscopic total cross section, respectively, and S is the thermal source term, may be written as
(1.3)
- ( )V n + n S,
where v = neutron velocity
n = spectrum averaged neutron density.
Writing the one-group diffusion equation as in Eq. 1.3
imposes continuity of neutron density and current and thus, for a 1/v absorber, implies that activation continuity ( a* ) is obtained.
Breen observed that while the discontinuity of the thermal activation is eliminated by using Eq. 1. 3, the calculated activation
shapes within a region are essentially those obtained using the normal method (Eq. 1.2) since the characteristic diffusion length
This problem is centered around the fact that the spectrum averaged diffusion coefficient, D, is more properly defined when averaged over the gradient spectrum (V* (E) ) than the normal flux spectrum ( *(E) ). Additionally, comparison to a more rigorous calculation showed that the gradient spectrum seemed to be very near a maxwellian distribution. By using these observations Breen proposed modifying Eq. 1.3 to obtain the diffusion equation of the form
(1.4)
DMax 2- t
-- n+ -(=
V) Max
where the coefficients for the leakage term are averaged over a maxwellian spectrum and the coefficients for the absorption term are averaged over a flux spectrum. Breen states that using Eq. 1.4 results in "quite successful" duplication of activation shapes calculated by more rigorous means.
Equation 1.4, then, is the basis of the MND method. It should be noted that the LEOPARD code includes a calculation of MND cross sections using Breen's method. That is, in LEOPARD,
-MND -MND (1.5)
where = flux spectrum averaged macroscopic cross section
(l/v) = flux spectrum averaged 1/v for the cell -Max
D= maxwellian spectrum averaged diffusion coefficient (1/v)Max = maxwellian spectrum averaged 1/v for the cell. Basically, Mertens' GMND method does not automatically assume that the gradient spectrum is close to a maxwellian since
in using the method an approximate gradient averaged velocity is calculated. The GMND method is based on the diffusion equation written as
(1.7)
DVn + S
(rFv)g (1/v)
where the diffusion coefficient, D, is again averaged over the flux spectrum and (iv) is the inverse of the neutron velocity
g
averaged over an approximate gradient spectrum. It should be pointed out that although it would be more proper to average D over
a gradient spectrum, this would involve detailed reprogramming of most commonly used codes since they do not calculate the gradient
since it can be approximated as shown below. By definition, 1 /) V$(E)dE g f V $(E)dE and since $(r ,E) - *(r 2 ,E) V$(vE)r, 2 rn - r2
one can write
f(r ,E)dE f t(r,E) dE (1.10) f$(rE)dE v(r ,E)2 $(.r2,E)dE Also, by definition, $.(r) f$(r,E)dE and n () Ef *(rjE) dE n(r)(r,E
Substitution of Eqs. 1.11 and 1.12 into Eq. 1.10 yields
(17V)
n(r,) - n(r 2 ) 9$r )- (z (1.8) (1.9) (1/v) g (1. 11) (1.12) (1.13)point r and
J(r)
is the total, spectrum averaged neutron flux at point r.Although it is not generally true that the average of an inverse of a function is equal to the inverse of the average it is a simple matter (by using the definition of the total flux as the neutron density times the neutron velocity) to show that
( ') = 1/-, (1.14)
so that Eq. 1.13 can be written as
~ (r) - $(r 2 ) (1.15)
9i 5(r,)-n(r2
where points r and r2 should be chosen to reflect the change in (r) and n(r) in the moderator of the cell.
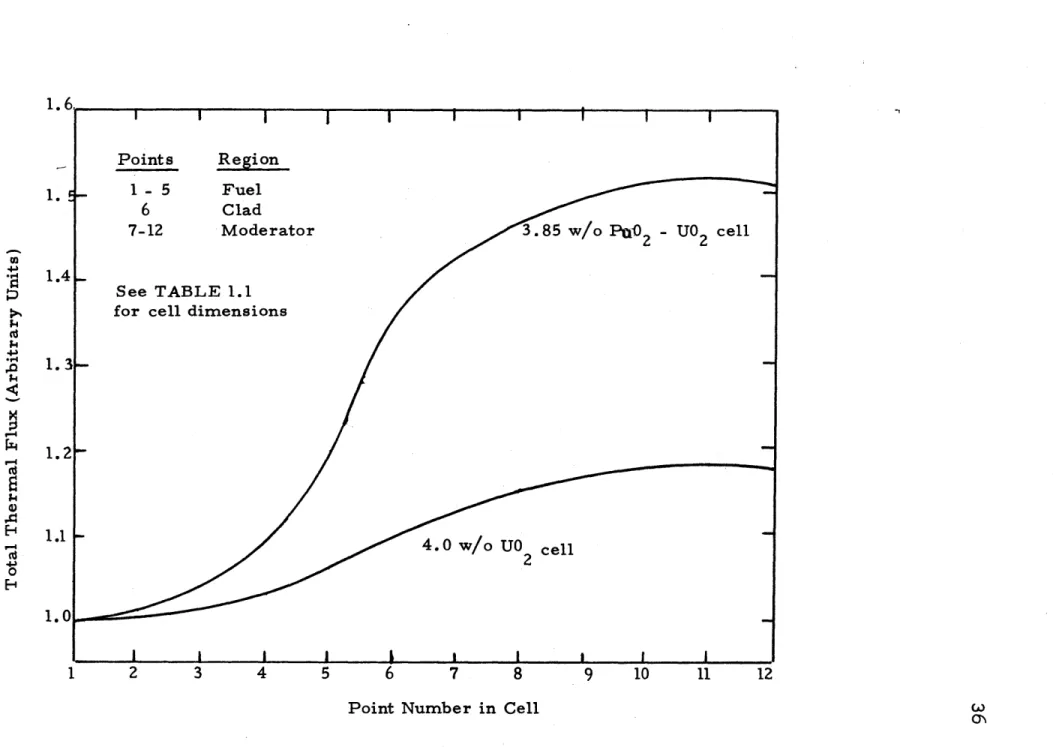
It should be pointed out that the GMND method can be applied using information calculated by LASER since it edits the pointwise total thermal flux and neutron density required to calculate the gradient spectrum average velocity by Eq. 1.15. Additionally, LASER edits pointwise averaged neutron velocity (averaged over the flux spectrum) as well as the cell average of the neutron velocity required for the GMND cross sections. FIGURES 1.2 and 1.3 show the total thermal flux and total neutron density (normalized to
Point Number in Cell
FIGURE 1.2 Total Thermal Flux versus Position
in cell for Puand U cells. 1. 1. 1.4 1. 1. 1.1 M E-1 -41 1. (A>
1 2 3
4
5
6
7
8
9
10 11 12 Point Number in CellFIGURE 1.3 Total Neutron Density versus
Cell for Pu and U Cells
wA Position in 43 43 ,0 4 4-) H 4) 0 1.5 1.4 1.3 1.2 1.1 1.0
It is readily seen from these figures that the plutonium cell shows a much larger flux gradient than the uranium cell. More specifically, by using points 7 and 11 of the moderator in Eq. 1.15 it is found that v in the uranium is 1.494 (in units of 2200 m/sec)
g
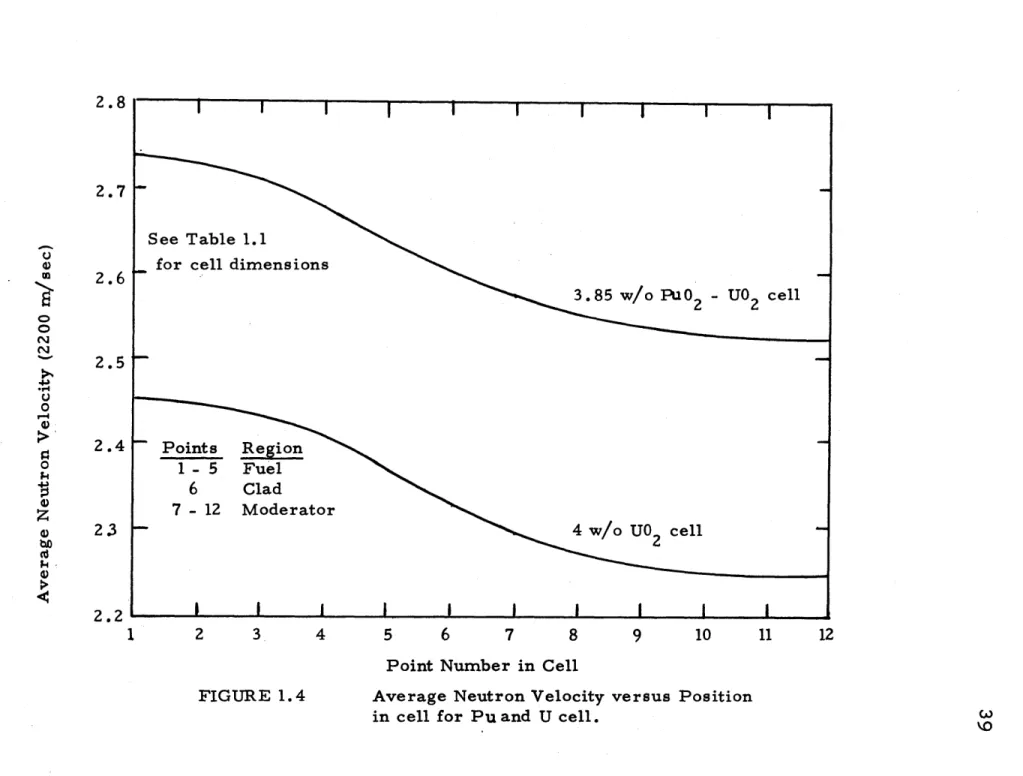
and v in the plutonium is 1.965 (a 32% difference). FIGURE 1.4 shows how the neutron velocity varies in the plutonium and uranium cell and it is seen that although the plutonium cell has a harder spectrum (higher neutron velocity) the change in velocity with position in the cells is almost identical.
1.4.3.2 General Application
By using Eq. 1.14, Eq. 1.7 can be written as
-D
v
n + t S(1.16)where v is the cell average neutron velocity. Modifications to LASER have been done in this study (see subsection 3.3.7) to
cal-culate the GMND cross sections given by
UGMND
(1. 17)GMND = V1.18)
such that use of GMND cross sections is now a simple matter. It is easy to show (using the standard two-group diffusion
equation) that the units of v and v are completely arbitrary. Thus, g
2 3 4 5 6 7 8 9 10 11 12 Point Number in Cell
FIGURE 1.4 Average Neutron Velocity versus Position
in cell for Pu and U cell. '.0
2.8 2.7 2.6 2.5 M .4 U 0 0 N 0 2.4 23 2.2 L 1 . 1 11,11 111111 1 1 1 1 111111 11 11111111111I N II I' I I I 1 1111111111 11111 11 1111111 1 111111 1111 1111 11111111 11 1111
are employed in the thermal group only in a manner completely analgous to the normal cross sections and the effect is to more accurately calculate the power peaking at fuel-water interfaces. It should be noted, however, that the normalization on the thermal flux is also affected such that the cell averaged thermal flux when using GMND cross sections is reduced approximately by a factor of V.
Mertens also extended the GMND method in an attempt to account for power peaking at the mixed- oxide (MOX) - uranium cell inter-face. By using arguments similar to those used to obtain Eq. 1.15, it can be shown that the gradient spectrum averaged velocity for a MOX - UO interface, v , can be obtained from
2 g,Int.
-cell -cell (1.19)
UO Mox
- 2
g,Int. -cell -- cell '
nUO2 Mox
cell -cell
where ~' and n are the cell averaged total flux and neutron density of the individual cells (both cells having the same power). For the plutonium and uranium cells discussed in subsection 1.4.3.1, a value of 2.0202 is obtained for v by using Eq. 1.19. It is
g,Int.
interesting to note that this value is less than 3% higher than v for g the plutonium cell. This implies that to have any effect on the
cal-In conclusion, Mertens has shown that by using GMND cross sections the power peaking at fuel-water and MOX-UO2 interfaces shows reasonable agreement with more rigorous calculations.
For this reason, GMND cross sections have been used in this work. It should be pointed out that MND cross sections are used by at
least one reactor manufacturer(12) as well as other analysis groups in the U. S.
CHAPTER 2
DESCRIPTION OF COMPUTER CODES 2.1 LASER
(8)
The LASER program is a multi-energy,
one-dimensional (cylindrical) unit cell burnup program. The specific nature of the physical problem solved and the mathematical formulation of the model, together with the most complete discussion of the output of LASER, is found
in Ref. 16. LASER is based on modified versions of the slowing down program MUFT (14) and the thermalization transport theory program THERMOS and performs a cal-culation of the neutron spectrum in a uniform lattice made up of cylindrical rods, cladding, and surrounding moder-ator with a thermal energy cutoff of 1.855 eV. An
iso-tropic scattering ring surrounding the cell is automatically provided in LASER. Honeck (1 8) has shown that the inclusion
of the so called white scattering ring eliminates, to a large extent, the errors introduced by cylindricizing the unit cell.
LASER will, at option, perform a burnup calculation for the cell explicitly calculating the spatial distri-bution of the various nuclides as the cell is burned.
LASER uses different treatments in the thermal energy range (0.0 to 1.855 eV) and in the epithermal (1.855 eV to
equation subject to isotropic scattering. In the
epi-thermal and fast energy ranges, LASER solves the consistent B-1 approximation to the transport equation.
LASER has been modified in this study and renamed LASER-M. Most of the modifications were of a fairly minor
nature and none of the basic mathematics of LASER were altered. A complete discussion of the modifications is given in Chapter 3 and further discussion of LASER is con-tained in Appendix G.
2.2 LIBP-IV
The thermal cross section library for LASER is formed
by use of the LIBP-IV program originally written by
Honeck. Basically, LIBP takes preprocessed data and simply puts this data into the form required in the thermal library. To obtain the data for input to LIBP the user must process experimental cross section values using the computer cods SIG1 (described briefly in Ref. 8), ETOT, (2 1) or other similar codes. The thermal library was modified in this work by using ETOT and LIBP. The procedure is discussed in subsection 3.2.1. It is important to note that the input instructions to LIBP-IV are essentially those found in the THERMOS manual 1 7 ) as modified by the
information given in the LASER manual. Appendix D contains a brief discussion of the input to LIBP as well
as a listing of the cards used to change the 'thermal
The LEOPARD code is a zero-dimensional spectrum code which determines fast and thermal spectra using only basic geometry, composition, and temperature data as input. LEOPARD is based on modified versions of the MUFT 1 4 ) and
SOFOCATE (2 2 computer programs. The code will, optionally, perform a depletion calculation for the unit cell.
In the fast energy region (above 0.625 eV) a MUFT calculation is performed similar to that described in
Appendix G for LASER. Also, LEOPARD provides an optional
U-238 L factor search as well as a critical buckling and
poison search almost identical to those described for LASER. Basically, the major difference between LEOPARD and LASER is in the thermal calculation where LEOPARD calculates a Wigner-Wilkins spectrum. Since LEOPARD has a 0.625 eV
thermal cutoff, it is not as effective for analysing plutonium fuel as LASER. Also, since LEOPARD performs a
zero-dimensional calculation, an approximate method of treating space-energy effects by means of multigroup dis-advantage factors is used. In this approach, disdis-advantage
factors are computed using the method of Amouyal, Benoist, and Horswitz (the ABH method) for each of the 172 thermal
energy groups. Flux and volume weighted macroscopic cross sections are then determined at each energy. These energy-dependent macroscopic cross sections are used in a normal
spectrum calculation for a homogeneous medium, and spectrum averaged cross sections are computed.
as well as volume weighted number densities, N , and their ratio, (2Thi / N . This ratio, defined here as g , is actually a mean disadvantage factor which varies from nuclide to nuclide reflecting absorption profiles as well as the geometric location of the nuclide. LEOPARD also edits recion averaged microscopic cross sections for three fast energy groups (10 MeV to 0.823, 0.823 MeV to 5.53 KeV, and 5.53 KeV to 0.625 eV), for one fast group (10 MeV to
0.625 eV), and for the thermal energy group (0.0 to 0.625 eV). LEOPARD does not, however, edit effective thermal microscopic cross sections, aeff, as defined in Appendix G. To obtain the effective cross sections the user must multiply the region averaged cross section, a ,
-3.
by the mean disadvantage factor, g , so that
eff = g 57. (2.3)
Alternately, region averaged cross sections may be entered in the diffusion codes such as PDQ along with thermal
self-shielding factors, used as disadvantage factors, such that PDQ calculates the effective thermal cross sections. Although there is no mention of the fact in the LEOPARD manual, it can be shown that the thermal macroscopics are calculated using the flux weighted number densities
(equivalent to using effective microscopic cross sections) and the fast macroscopics are computed using the volume
of designating a fictitious extra region in addition to the fuel, clad, and moderator region of the unit cell. This allows the user to model as extra region those parts of a fuel assembly or core which are not in a unit cell(i.e. water holes, control rod followers, assembly cans,
structure, etc.). However, care must be taken when using the extra region since the number densities and macroscopic parameters output by LEOPARD in this case are for the
whole "super cell" (the unit cell plus the extra region). Additional features of LEOPARD are the use of a built-in polynomial fit to the pseudo fission product cross
section as a function of burnup and the output of the Mixed Number Density (MND) cross section discussed in subsection 1.4.3.1.
The basic version of LEOPARD has been modified at M.I.T. by Spierling (29) and Farrar.(25) The work by
Spierling is of special interest in this study since he modified LEOPARD to better handle plutonium fuel.
Although Mertens found Spierling's version of LEOPARD (designated LEOPARD-R) to still be somewhat lacking when compared to LASER, LEOPARD-R was used as a secondary tool in this work for comparision to a number of LASER calcul-ations. A primary difficulty of comparing the results of two spectrum codes is assuring that a similar set of basic library data is used.
values of v (neutrons per fission) and K (energy per fission). Unfortunately, it is seen that significant differences (not totally explained by the difference in spectrum calculation) are present.
2.4 PDQ-7/HARMONY
The PDQ-7 computer program(26) solves the neutron diffusion-depletion problem in one, two, and three
dimensions. Up to five energy groups are permitted, with the thermal neutrons represented by a single group or a pair of overlapping groups. Adjoint and boundary value calcul-ations may be performed and the depletion may be by point or block. The geometries available are rectangular,
cylindrical, or spherical in one dimension; rectangular, cylindrical, or hexagonal in two dimension; and rectangular or hexangonal in three dimension. All geometries provide for variable mesh spacing in all dimensions and zero-current,zero-flux, and rotational symmetry boundary conditions are available.
The two overlapping thermal groups may be used in one-or two dimensional problems to describe a spatially
dependent thermal-neutron spectrum as a linear combination of overlapping hard and soft spectra.
The PDQ-7 code permits downscatter to only the next lowest energy group, and flux weighted average values of region-dependent parameters are edited as well as regionwise and pointwise flux and power distributions.
automatically utilize the HARMONY computer code. (2 7 Any of the cross sections or self-shielding factors (obtained from a spectrum code) used in the spatial or depletion
calculation may be represented as time dependent. Isotopic depletion and fission product chains are specified by the user as discussed in Chapter 8. The total number of
depletable isotopes is limited only by the computer storage requirements. Provision has been made in HARMONY to adjust the thermal flux level at specific times within the basic
interval to approximate constant-power operation. Com-positions may be replaced at any time in a depletion study
to investigate the effects of fuel rearrangements. The PDQ-7 and HARMONY code input is described in
Refs. 26 and 27, respectively. However, it should be noted that PDQ-7 at M.I.T. has been revised by the Aerojet
Nuclear Corporation for operation on an IBM computer. The revised input to PDQ-7/HARMONY is excellently summarized
in ANCR-1061(2 8) which should be used in conjunction with the original manuals when using PDQ-7 at M.I.T.
As a further note, the large flexibility of problem description in PDQ-7 can lead to fairly complicated input
requirements. The users should thoroughly familiarize themselves with the unique terminology (summarized in Ref. 27) used in the PDQ-7/HARMONY code system before attempting to run the code. Some of the basics of the input are
CHAPTER 3
MODIFICATIONS TO LASER CONTAINED IN LASER-M
3.1 Introduction
As discussed in Appendix G, the standard Argonne version of LASER has a number of major limitations. The scope of the present study did not include the modification of LASER to eliminate these major limitations. However, numerous minor changes discussed in the following sections
were incorporated into LASER to form a version designated LASER-M.
LASER has been modified by at least one other worker at M.I.T. (C. S. Rim) and for the sake of completeness these modifications will be discussed here. Rim 2 9 ) inserted
additional data in LASER to account for the Doppler broaden-ing effect on the Pu-239 resonance at 0.296 eV. The
resonance parameters given in TABLE 3.1, were used in Rim's
modification to evaluate the line shape function for the
0.296 eV resonance and the virtual level (See Ref. 29 for
TABLE 3.1
RESONANCE PARAMETERS USED TO EVALUATE THE LINE SHAPE FUNCTIONS FOR Pu-239 RESONANCES (Ref. 29)
E 0(eV) a (b)
r(ev) rf/r a Pu-239 0.296 2.120 + 3 9.9 - 2 1.539
-0.40 1.569 + 2 2.20 - 1 9.695 * NOTE 2.120 + 3 = 2.12E+3 = 2.120x10³
a is the capture cross section at the resonance energy E, r the total width, r the fission width, and r a is the absorption width.
Rim also normalized the thermal U-235 and Pu-239 cross sections to the 2200 m/sec parameters reported by Sher, et alF and the thermal Pu-241 data to the 2200 m/sec values which Westcott, et al., (3 1) presented at the 1964 Geneva Conference.
It should be noted that the modifications listed here were the only changes to LASER made by Rim. (32)
3.2 Cross Section Changes
3.2.1 Thermal Cross Section Library
Early in this work it was decided to revise the thermal cross section library of LASER to incorporate the most recent Evaluated Nuclear Data File (ENDF) cross section for the plutonium isotopes. The ENDF/B-II cross sections for Pu-239,
Pu-240, Pu-241, and Pu-242 were processed by Bill Flournoy at Southern California Edison (SCE) using ETOT. (21) In these runs the weighting function was l/E joined to a Maxwellian Distribution, the cross sections were group averaged, and no
resonance parameters were calculated. The cross sections out-put from ETOT (in the form of punched cards) were then used as input to LIBP (the LASER and THERMOS thermal library generation code discussed in Section 2.2 and Appendix D) to update the
thermal library tape of LASER.
The thermal group structure, group-wise microscopic absorption (a ) and fission (a ) cross sections and the
constant thermal values of nu (v) neutrons per fission for the four plutonium isotopes are listed in Appendix C.
As a first basis of comparison, the ENDF/B-II 2200 m/sec values of a a' af, and v for plutonium which were input to
LASER-M are listed in TABLE 3.2 along with the 2200 m/sec
values used in the old LASER library and other often referenced values. For completeness U-235 is also included.
3.2.2 Thermal Resonance Parameters
The resonance parameters for the Pu-240 1.056 eV
resonance were also changed. These parameters were obtained in a manner analogous to that for the thermal cross sections
except that ETOM (3 5) was used to process the ENDF/B-II cross
52
TABLE 3.2
CROSS SECTION PARAMETERS AT 2200 m/sec FOR VARIOUS CROSS
SEC-TION SETS (All cross sections are in barns)
QUANTITY LASER OLD c/s SET LASER-M SET (ENDF/B-II PU) SHER( 3 0) (See Note 1) WESTCOTT (3.4) (See Note 2) U-235 678.98 577.98 2.442 1015.0 741.98 2.8980 272.59 2.9976-2 (See Note 4 2.8866 1376.0 1013.0 2.9779 18.598 678.98 577.98 2.442 1013.0 742.1 2.880 290.1 5.785-2
)
2.8900 1375.0 1008.0 2.9360 30.01 (See Note 3) 678.2 577.1 2.442 1014.5 740.6 2.898 679.9 579.5 2.430 1008.1 742.4 2.871 1391. 1009. 2.969 NOTES:1. There are two cross section sets generally referred to as "Sher" sets. One set appears in BNL 722(1962) but that data has been updated by a revision to BNL 722 published in 1965 (BNL 918, Ref. 30). a Pu-239 a V Pu-240 a a V Pu-241 a a a f V Pu-242 a
Table 3.2 (continued)
2. There are also two cross section sets generally referred to as "Westcott" sets (or "1964 Geneva Conference" sets). See Ref. 31 and 3.4. It should be noted that the values
presented by Westcott at the 1964 Geneva Conference (31) were "preliminary results" and are slightly changed in the final report. (34) The results in the final report "are to be con-sidered as superseding the [1964 Geneva Conference] results."
3. Uotinen, et al., (2) points out that this value should be about 19 barns. (See Section 4.5).
4. This notation will be used throughout where 2.9976-2 = 2.9976E-2 = 2.9976x10⁻².
The major options used in ETOM were as follows:
1. The weighting function was l/E joined to a U-235 fission spectrum.
2. Extra resonances were added to the smooth cross section.
3. The Grueling-Geortzel parameter was calculated from data on the ENDF/B tape.
4. The N-2N cross section was added half to fission, and half to inelastic scattering.
5. The ingroup inelastic scattering was added to the smooth
scattering.
6. The excess scattering was lumped into the highest group.
Data for the Pu-240 1.056 eV resonance obtained for the ETOM run is given in TABLE 3.3.
TABLE 3.3
ENDF/B-II RESONANCE PARAMETER DATA FOR THE Pu-240 1.056 eV RESONANCE (Ref. 36) Parameter Value E eV 1.056 rn eV 2.44-3 r eV 2.986-2 FfI eV 5.70-6 m 5.3111+3 r 1.7361+5 a 1.9085-4
Definitions of the parameters output from ETOM are given in Ref. 35. They are as follows:
(a)
r- (3.1)
r
m= E' c (3.2)
and
= = fission to absorption ratio, (3.3) Ta
where the total width, r, is given by
r = rn + ra (3.4)
and
r = r + r a y f'
with rn = neutron width
r = capture width
ra = absorption width r = fission width.
By using Eq. 3.1 to 3.4 and the data in TABLE 3.3 the
parameters input to LASER-M (Subroutine DOPL) were obtained (for a more detailed discussion see Ref. 37, p. 115). These parameters are listed in TABLE 3.4 along with the variable
TABLE 3.4
RESONANCE PARAMETERS FOR Pu-240 RESONANCE INPUT TO LASER-M
PARAMETER VARIABLE NAME VALUE INPUT
SIGO 1.86225+5 barns
E EO 1.056 eV
rn GAMMAN 2.44-3 eV
r YGAMMAC 2.986-2 eV
GF 1.9085-4
3.2.3 Fast Cross Section Library
Because of the format complexity of the fast cross section library in LASER it was decided not to make any changes in it. It should be noted, however, that the cards and printed output from the ETOT and ETOM runs have been placed in the Nuclear Engineering Code Library to enable future users of LASER-M to further modify the cross section
libraries.
3.2.4 Validation of Modifications
As discussed in Chapter 4, the cross section changes made to LASER were checked against criticals and show good