Publisher’s version / Version de l'éditeur:
BMC Bioinformatics, 11, 105, 2010-02-01
READ THESE TERMS AND CONDITIONS CAREFULLY BEFORE USING THIS WEBSITE.
https://nrc-publications.canada.ca/eng/copyright
Vous avez des questions? Nous pouvons vous aider. Pour communiquer directement avec un auteur, consultez la première page de la revue dans laquelle son article a été publié afin de trouver ses coordonnées. Si vous n’arrivez pas à les repérer, communiquez avec nous à PublicationsArchive-ArchivesPublications@nrc-cnrc.gc.ca.
Questions? Contact the NRC Publications Archive team at
PublicationsArchive-ArchivesPublications@nrc-cnrc.gc.ca. If you wish to email the authors directly, please see the first page of the publication for their contact information.
This publication could be one of several versions: author’s original, accepted manuscript or the publisher’s version. / La version de cette publication peut être l’une des suivantes : la version prépublication de l’auteur, la version acceptée du manuscrit ou la version de l’éditeur.
For the publisher’s version, please access the DOI link below./ Pour consulter la version de l’éditeur, utilisez le lien DOI ci-dessous.
https://doi.org/10.1186/1471-2105-11-105
Access and use of this website and the material on it are subject to the Terms and Conditions set forth at
Free energy estimation of short DNA duplex hybridizations
Tulpan, Dan; Andronescu, Mirela; Leger, Serge
https://publications-cnrc.canada.ca/fra/droits
L’accès à ce site Web et l’utilisation de son contenu sont assujettis aux conditions présentées dans le site LISEZ CES CONDITIONS ATTENTIVEMENT AVANT D’UTILISER CE SITE WEB.
NRC Publications Record / Notice d'Archives des publications de CNRC:
https://nrc-publications.canada.ca/eng/view/object/?id=01769134-a2d2-49a0-9c3d-eaa134ba6196 https://publications-cnrc.canada.ca/fra/voir/objet/?id=01769134-a2d2-49a0-9c3d-eaa134ba6196
R E S E A R C H A R T I C L E
Open Access
Free energy estimation of short DNA duplex
hybridizations
Dan Tulpan
1*, Mirela Andronescu
2, Serge Leger
1Abstract
Background:Estimation of DNA duplex hybridization free energy is widely used for predicting cross-hybridizations in DNA computing and microarray experiments. A number of software programs based on different methods and parametrizations are available for the theoretical estimation of duplex free energies. However, significant differences in free energy values are sometimes observed among estimations obtained with various methods, thus being difficult to decide what value is the accurate one.
Results:We present in this study a quantitative comparison of the similarities and differences among four published DNA/DNA duplex free energy calculation methods and an extended Nearest-Neighbour Model for perfect matches based on triplet interactions. The comparison was performed on a benchmark data set with 695 pairs of short oligos that we collected and manually curated from 29 publications. Sequence lengths range from 4 to 30 nucleotides and span a large GC-content percentage range. For perfect matches, we propose an extension of the Nearest-Neighbour Model that matches or exceeds the performance of the existing ones, both in terms of correlations and root mean squared errors. The proposed model was trained on experimental data with
temperature, sodium and sequence concentration characteristics that span a wide range of values, thus conferring the model a higher power of generalization when used for free energy estimations of DNA duplexes under non-standard experimental conditions.
Conclusions:Based on our preliminary results, we conclude that no statistically significant differences exist among free energy approximations obtained with 4 publicly available and widely used programs, when benchmarked against a collection of 695 pairs of short oligos collected and curated by the authors of this work based on 29 publications. The extended Nearest-Neighbour Model based on triplet interactions presented in this work is capable of performing accurate estimations of free energies for perfect match duplexes under both standard and non-standard experimental conditions and may serve as a baseline for further developments in this area of research.
Background
Predicting the stability of a DNA duplex from base sequences is a well studied problem nowadays. Never-theless, the accuracy of DNA duplex stability predictions largely varies with sequence length, base composition and experimental conditions. The Thermodynamic Nearest-Neighbour (TNN) Model [1] is a state-of-the-art approach that is used to estimate the stability of a single or a pair of DNA (or RNA) molecules based on pairwise base interactions and structural conformations. A large collection of thermodynamic nearest-neighbour
parameters were acquired by interpolation of results obtained from various experimental processes like NMR [2] and optical melting studies [1,3]. The accuracy of computing free energies for DNA duplexes is an impor-tant aspect for all prediction methods, considering their direct application for selecting, for example, microarray probes that perfectly hybridize with their complements within a pre-specified hybridization interval, while avoiding self-hybridization for each probe [4]. Here we select four widely used, publicly available computer pro-grams that implement the TNN Model using large num-bers of experimentally derived thermodynamic parameters, namely: the MultiRNAFold v2.0 package [5,6] with two sets of thermodynamic parameters, the
* Correspondence: dan.tulpan@nrc-cnrc.gc.ca
1National Research Council of Canada, Institute of Information Technology,
100 des Aboiteaux Street, Suite 1100, Moncton, NB, E1A 7R1, Canada
© 2010 Tulpan et al; licensee BioMed Central Ltd. This is an Open Access article distributed under the terms of the Creative Commons Attribution License (http://creativecommons.org/licenses/by/2.0), which permits unrestricted use, distribution, and reproduction in any medium, provided the original work is properly cited.
Vienna Package v1.8.1 [7] and the UNAFold v3.5 pack-age [8].
The MultiRNAFold package (including the PairFold program for duplexes) predicts the minimum free energy, suboptimal secondary structures and free energy changes of one, two, or several interacting nucleic acid sequences. The thermodynamic model for the thermo-dynamic stability of a joint secondary structure for two DNA or RNA molecules at a given temperature is performed similarly to that of a single molecule [9], except that an intermolecular initiation penalty is added. The PairFold algorithm uses dynamic programming to calculate minimum free energy secondary structures and runs in time cubic in the lengths of the input sequences (Θ(n3)). PairFold uses RNA thermodynamic parameters from the Turner Laboratory [10] and DNA thermody-namic parameters from the Mathews and SantaLucia laboratories [11,12].
The Vienna Package consists of a suite of computer programs and libraries for prediction of RNA and DNA secondary structures. Nucleic acid secondary structure prediction is done via free energy minimization using three dynamic programming algorithms for structure prediction: the minimum free energy algorithm of [13], which produces a single optimal structure, the partition function algorithm of [14], which calculates base pair probabilities in a thermodynamic ensemble, and the suboptimal folding algorithm of [15], which generates all suboptimal structures within a given energy range of the optimal energy.
UNAFold, the acronym for “Unified Nucleic Acid Folding”, is a software package for RNA and DNA fold-ing and hybridization prediction. UNAFold folds sfold-ingle- single-stranded RNA or DNA, or two single DNA or RNA strands, by computing partition functions for various states of hybridization. The partition functions will then help to derive base pair probabilities and stochastic sam-ples of foldings or hybridizations. The package provides various energy minimization methods, which compute minimum free energy hybridizations and suboptimal foldings.
All three packages use similar dynamic programming algorithms for prediction of minimum free energy (MFE) and suboptimal structures and for partition func-tion calculafunc-tions. For the purposes of our work (i.e., DNA duplex MFE secondary structure prediction and free energy of hybridization), the main differences lie in the thermodynamic parameters used (SantaLucia or Mathews), and in the features considered (for exam-ple, the Vienna Package does not consider special types of poly-C hairpin loops in their model, whereas the other two packages do). Thus our first goal is to quan-tify the impact of these differences on the accuracy of DNA duplex free energy approximations. Throughout
the paper, we use a set of measures that reflect the degree of similarity of calculated and experimental sec-ondary structures and free energies. Based on these measures we quantify the accuracy of the predictions of the aforementioned programs using a collection of 695 experimental DNA duplex data that we collected from 29 publications.
We also introduce in this work an extended Nearest-Neighbour Model for perfect matches based on triplet interactions, that can approximate free energies for DNA duplexes under a wide range of temperatures, sodium and sequence concentrations. The model is similar to the one introduced in 1999 by Owczarzy et al. [16], the main difference residing in the inclusion of only triplet interactions for our model, rather than a mixture of singlets, doublets and triplets for the other. Thus, our second goal is to show that such a model outperforms simpler models based on doublet interac-tions and produces more accurate free energy approxi-mations for DNA duplex hybridizations occurring in non-standard experimental environments (for example for different sodium concentrations or at different temperatures).
Results and Discussion
In this work, we compare similarities and correlations of free energy values calculated using three publicly avail-able packages, namely MultiRNAFold, UNAFold and Vienna Package and a Nearest-Neighbour (NN) Model for perfect matches based on triplet interactions. For this purpose, we collected and used a data set with 695 pairs of short DNA sequences and we investigated what method produces the closest value to the experimental free energy and under what circumstances. We acknowl-edge the fact that not all sequence lengths are equally represented in the benchmark data set simply due to their availability and thus our analysis may apply better to shorter sequences. The majority (91.37%) of experi-mental free energy calculations were obtained for perfect (0 mismatches) and almost perfect matches (1 mismatch), thus the current DNA parameter sets tend to have higher accuracy for close-to perfect match DNA duplexes. Another bias in the analysis may come from the fact that some authors have already tried to reconcile the existing differences in free energy model parameters [17,18] by optimizing sets of DNA para-meters using the same sequences already present in the benchmark data set.
Comparison of absolute differences between experimental and estimated free energies (MFE_AD)
We begin the presentation of our results by introducing a measure that provides insights into “worst” and “best” estimates for minimum free energies. Thus, the first
comparison involves the absolute differences between experimental and estimated free energies (MFE_AD) among all the methods for model evaluation (column 3 in Table 1) and model prediction (column 3 in Table 2). In an ideal scenario, the estimated free energy would equal the experimentally inferred one, nevertheless in practice we would settle for a low absolute difference. In both scenarios, namely the evaluation of free energy estimates and the evaluation of secondary structure pre-dictions, the largest maximal MFE_AD (18.4 kcal/mol in both) were obtained for the PairFold-Mathews method, while the minimal MFE_AD (13 kcal/mol for EVAL-FE and 11.88 kcal/mol for EVAL-SS) corresponds to the UNAFold method (see Methods for details). The average differences for the EVAL-FE methods range between 2.41 kcal/mol (UNAFold) and 3.16 kcal/mol (Vienna
Package), while for the prediction methods the interval is slightly shifted towards zero. We also observed a simi-lar improvement trend for MFE_AD standard deviations of EVAL-SS methods versus EVAL-FE methods, a phe-nomenon that can be explained by the intrinsic regres-sion-based construction of the underlying DNA parameters used by each method.
Comparison of root mean squared errors (RMSE)
We measure the root mean squared error between experimentally determined and predicted free energies. In an ideal scenario where predicted values equal experi-mental values, the RMSE would be zero, thus the lower the RMSE value is, the closer the predicted values are to the experimental ones. Here, all methods produce com-parably low RMSEs, the lowest EVAL-FE RMSE (3.876)
Table 1 Summary of features for the data sets used in this study
Set Num. duplexes Seq. len. T[C] [Na]+[M] Seq. conc. [M] Aboul-ela et al. [32] 34 16 25, 50 1 [11e-6,440e-6]
Allawi et al.-1 [37] 24 9 - 12 37 1 1e-4
Allawi et al.-2 [20] 28 9 - 14 37 1 1e-4
Allawi et al.-3 [21] 22 9 - 14 37 1 1e-4
Bommarito et al. [43] 37 8 - 9 37 1 n.r.
Breslauer et al. [26] 12 6 - 16 25 1 n.r.
Clark et al. [44] 1 24 37 0.15 2.5e-6
Doktycz et al. [19] 140 8 25 1 2e-6
Gelfand et al. [45] 4 13 25 1 5e-5
LeBlanc et al. [46] 7 10 - 11 25 1 5e-5
Leonard et al. [22] 5 12 25 1 4e-4
Lesnik et al. [39] 14 8 - 21 37 0.1 4e-6
Li et al. [23] 12 8 - 10 25 1 6.1e-6
Nakano et al. [40] 21 6 - 14 37 0.1 8e-6
Petruska et al.-1 [47] 4 9 37 n.r. n.r.
Petruska et al.-2 [36] 2 30 37 0.17 1e-4
Peyret et al. [48] 52 9 - 12 37 1 1e-4
Pirrung et al. [49] 2 25 25 0.1 1e-6
Plum et al. [50] 2 13 25 1 6e-6
Ratmeyer et al. [51] 2 12 37 1 6e-6
SantaLucia et al.-1 [29] 23 4 - 16 37 1 4e-4
SantaLucia et al.-2 [29] 10 12 24.85 1 5e-6
Sugimoto et al.-1 [30] 50 5 - 14 37 1 5e-6
Sugimoto et al.-2 [38] 1 8 37 n.r. 1e-4
Sugimoto et al.-3 [52] 8 6 - 8 37 1 n.r.
Tanaka et al. [34] 126 12 - 25 37 1 5e-5
Tibanyenda et al. [33] 3 16 24.85 1 17.5e-6
Wilson et al. [35] 3 11 25 0.4 n.r.
Wu et al. [53] 48 5 - 11 25, 37 1 1e-4
TOTAL: 695
Each data set has the following characteristics: the number of sequence pairs (Num. duplexes), the length of the sequences (Seq. len), the experimental temperature measured in degrees Celsius for estimating free energies (T), the sodium concentration measured in molar units ([Na]+)and the sequence
concentration (Seq. conc). The set of 695 DNA duplexes contains: (i) 143 perfect match free energies measured at a temperature of 37°C and a sodium concentration of 1 M, (ii) 197 perfect match duplexes measured at a temperature of 25°C and a sodium concentration of 1 M, (iii) 7 perfect match duplexes measured at a temperature of 50°C and a sodium concentration of 1 M, and (iv) 348 duplexes with mismatches measured at various temperatures and sodium concentrations. Note: n.r. denotes values that have not been reported in the original documents.
and EVAL-SS RMSE (3.667) being obtained in both cases with Vienna Package (column 5 in Tables 3 and 4).
Comparison of Pearson correlation coefficients (r)
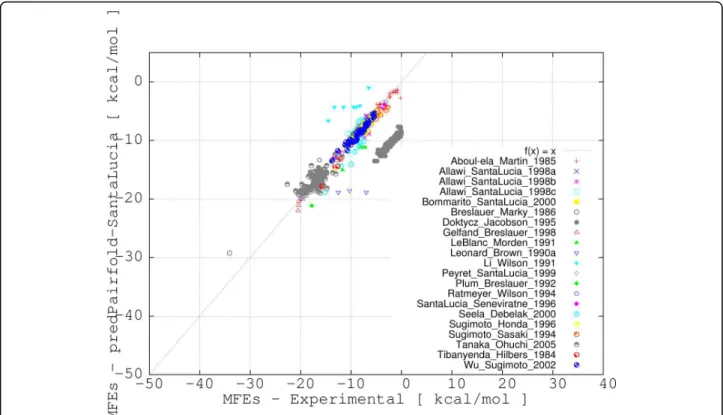
A correlation coefficient is traditionally defined as a symmetric, scale-invariant measure of association between two random variables, which takes values between -1 and 1. The extreme values indicate a perfect positive (1) or negative (-1) correlation, while 0 means no correlation. Positive Pearson Product Moment corre-lations are observed for all methods when experimental and evaluated or predicted free energies are considered as random variables. The highest Pearson correlation coefficients (~ .75 and ~ .77) are consistently obtained with the PairFold-SantaLucia method for both EVAL-FE and EVAL-SS, closely followed by UNAfold, Vienna Package and PairFold-Mathews. A major and consistent deviation from the correlation line of approximately 8 Kcal/mol for the data collected from Doktycz et al. [19] and a few other minor deviations for the data collected
from four additional publications [20-23] were consis-tently noticed for all free energy calculation methods (see Figures 1 and 2). The majority of the deviations (e.g. Doktycz et al. [19]) may come from potentially different free energy interpolation functions used in those studies.
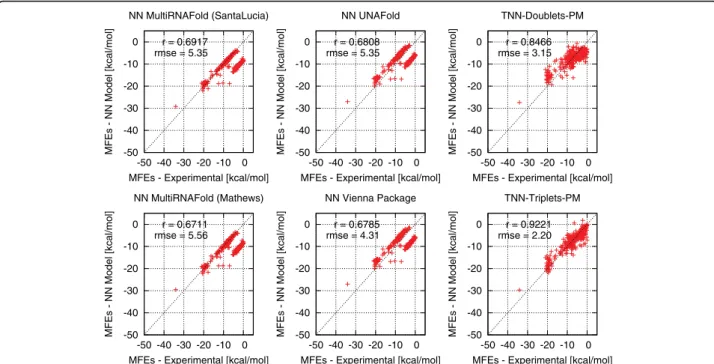
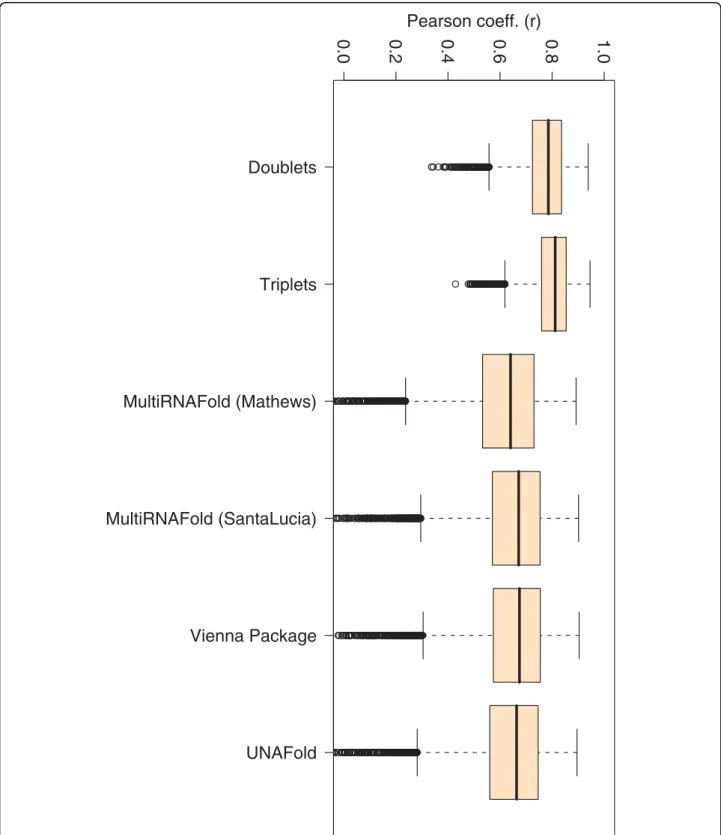
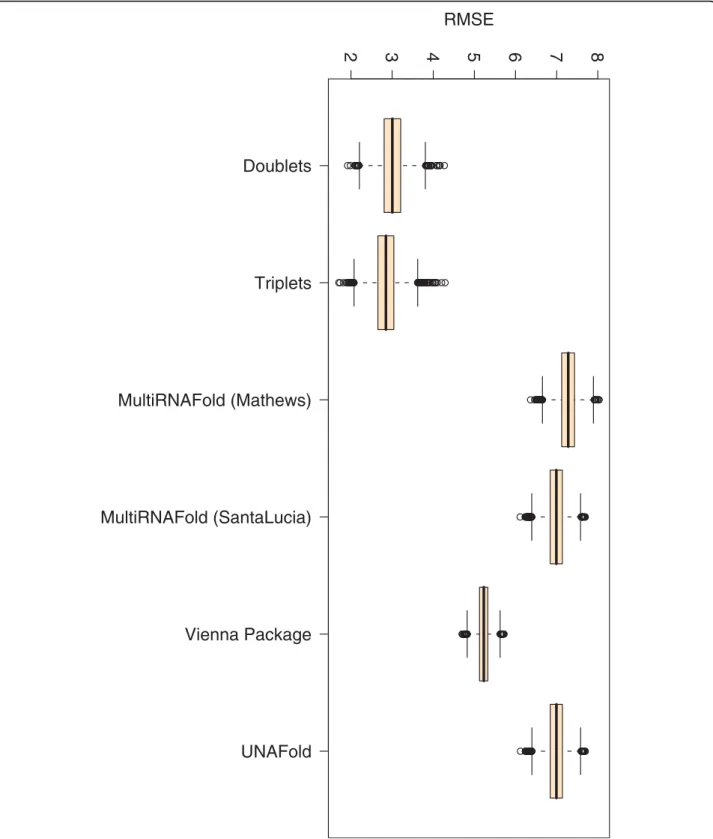
If we consider only perfect match data, the TNN-Tri-plets-PM Model (see Methods) is capable of estimating free energies that correlate better (r = 0.92) with experi-mental values (see Figure 3), than all the other methods, which show an average correlation coefficient r = 0.68. We notice also an improvement in the RMSE for the TNN-Triplets-PM Model, compared to the other pro-grams. To ensure that this improvement is due to the tri-plet aspect of the model rather than other confounding factors, we created a TNN-Doublets-PM Model that has been trained and evaluated on the same perfect match data set. A detailed description of the training and evalua-tion procedure is provided in Tables 5 and 6. For the com-plete data set with perfect matches measured at various temperatures and buffer concentrations, Figures 4, 5, 6, 7,
Table 2 Summary of results for free energy measurements obtained with EVAL-SS methods
Method Stats MFE_AD [kcal/mol] Pearson coeff. (r) SSSI Sens. PPV F-measure MultiRNAFold min 0.000 0.7565 4.35 40.00 0.1667 1 0.2857 (Mathews) q1 0.340 100.00 1.0000 1 1.0000 median 0.860 100.00 1.0000 1 1.0000 mean 2.681 95.83 0.9547 1 0.9711 q3 3.590 100.00 1.0000 1 1.0000 max 18.400 100.00 1.0000 1 1.0000 stddev 3.429 10.56 0.1224 0 0.09236 MultiRNAFold min 0.000 0.7663 4.131 40.00 0.1667 1 0.2857 (SantaLucia) q1 0.330 100.00 1.0000 1 1.0000 median 0.720 100.00 1.0000 1 1.0000 mean 2.528 96.44 0.9608 1 0.9747 q3 3.510 100.00 1.0000 1 1.0000 max 17.200 100.00 1.0000 1 1.0000 stddev 3.269 10.23 0.1189 0 0.08966 min 0.000 0.7660 3.992 40.00 0.1667 1 0.2857 q1 0.256 100.00 1.0000 1 1.0000 median 0.630 100.00 1.0000 1 1.0000 UNAFold mean 2.374 96.08 0.9571 1 0.9724 q3 3.016 100.00 1.0000 1 1.0000 max 11.880 100.00 1.0000 1 1.0000 stddev 3.212 10.66 0.1231 0 0.09234 Vienna min 0.010 0.7630 3.667 5.882 0.0000 0.0000 0.0000 Package q1 1.700 100.000 1.0000 1.0000 1.0000 median 2.330 100.000 1.0000 1.0000 1.0000 mean 3.025 95.210 0.9467 0.9856 0.9616 q3 3.935 100.000 1.0000 1.0000 1.0000 max 15.400 100.000 1.0000 1.0000 1.0000 stddev 2.075 13.74 0.1581 0.1192 0.1387
Summary of results for free energy measurements obtained with EVAL-SS methods. The p-values for the Pearson correlation test were less than 2.2e-16 in all cases.
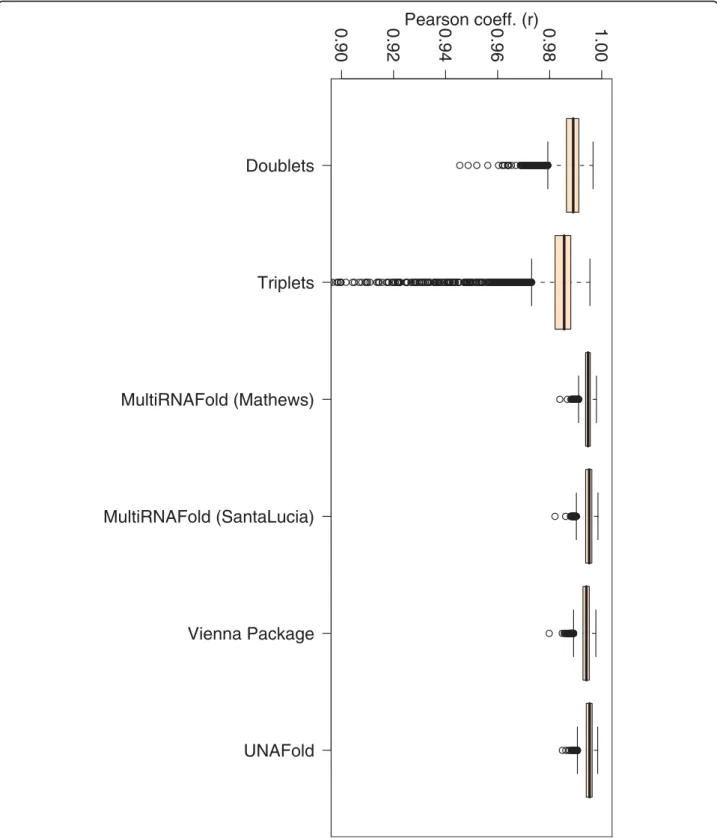
8 and 9 show that our TNN-Triplets-PM Model consis-tently produces better correlations and RMSEs, when we run a random design experiment using 10 000 randomly selected subsets with 67% duplexes (228 perfect match duplexes) used for training and 33% duplexes (112 perfect match duplexes) used for testing. The same high correla-tions can be observed when running the TNN-Triplets-PM Model on perfect match duplex free energies mea-sured at a temperature of 25°C and 1 M sodium concen-tration, while for perfect match free energies measured at 37°C and 1 M sodium concentration, the other models produce better but still comparable correlations (0.9) and RMSEs (0.7) with the TNN-Triplets-PM Model.
Comparison of secondary structure similarity indexes of experimental and predicted secondary structures (SSSI)
The accuracy of secondary structure prediction for various methods can be evaluated by using the newly introduced
measure described in equation 5. The SSSI measure sim-ply calculates the percentage of correctly predicted sec-ondary structure bonds corresponding to the positions in each secondary structure (corresponding to each sequence in the duplex) that match the position in the experimental secondary structure, normalized by the sum of sequence lengths. Comparable mean SSSI values were produced by all methods with a maximal value of 96.44% attained by PairFold-SantaLucia. The lowest value (95.21%) was obtained with Vienna Package (see column 6 in Table 2). All methods have large standard deviation for SSSI values, thus suggesting a wide sample distribution.
Comparison of SENS, PPV and F for predicted secondary structures
The analysis of the variation for sensitivities and F-mea-sures with respect to sequence length and GC content per-centages reveals a common pattern for all prediction methods. Mean sensitivities higher than 0.9 and mean F-measures higher than 0.95 were obtained for all methods and all sequence lengths with one exception. For sequences of length 10 a major drop in sensitivities and F-measures can be observed (see Figures 10 and 11). The main cause for the abrupt drop in sensitivities seem to apply mostly for sequences whose experimentally deter-mined secondary structures contain two consecutive mis-matches (collected from [23]), thus partially supporting the hypothesis that the prediction models under investiga-tion seem to be optimized to produce better results for almost complementary pairs of DNA sequences. Next we look at how GC content % impacts the accuracy of predic-tion for the methods under considerapredic-tion. While sensitiv-ities and F-measures are higher than 0.9 for all methods for a wide range of GC content % intervals (e.g. 0% -10%, 40% - 100%), there are values for which sensitivities and F-measures drop under 0.9 for sequences with GC content percentages in the range 10% - 40%. While Pairfold-Math-ews, Pairfold-SantaLucia and UNAFold generate predic-tions with sensitivities higher than 0.9 for sequences with GC content percentages in the range 20% - 30%, the Vienna Package has a mean sensitivity of only 0.8. For 3 out of 4 methods, the PPV equals 1 (maximum), while for the remaining one, namely the Vienna Package slightly lower mean values (0.98) were obtained.
Comparison of free energy parameters for DNA doublets measured at 37°C and 1 M sodium concentration
Table 2 presents the estimated free energy parameters for DNA doublets measured at 37°C. The set of 10 parameters corresponds to the best set obtained with the procedure explained in Table 6. We compared our set of NN free energy parameters at 37°C with eight other sets of parameters reported by SantaLucia [18], namely the sets obtained by Gotoh [24], Vologodskii
Table 3 Summary of results for free energy measurements obtained with EVAL-FE methods Method Statistics MFE_AD [kcal/
mol] Pearson coeff. (r) RMSE MultiRNAFold min 0.0000 0.7352 4.418 (Mathews) q1 0.300 median 0.800 mean 2.672 q3 3.395 max 18.400 stddev 3.521 MultiRNAFold min 0.0000 0.7456 4.223 (SantaLucia) q1 0.330 median 0.680 mean 2.553 q3 3.390 max 17.200 stddev 3.367 min 0.0000 0.7434 4.101 q1 0.2528 median 0.6128 UNAFold mean 2.4110 q3 2.9970 max 13.0000 stddev 3.319 Vienna min 0.0000 0.7413 3.876 Package q1 1.820 median 2.440 mean 3.167 q3 3.965 max 15.400 stddev 2.236
Summary of results for free energy measurements obtained with EVAL-FE methods. The p-values for the Pearson correlation test were less than 2.2e-16 in all cases.
Table 4 Estimated free energy parameters ID Doublet ΔGo37 [kcal/mol] Counts ID Doublet ΔG37o [kcal/mol] Counts 1. AA/TT -0.838948 84 6. CC/GG -1.698997 74 2. AC/TG -1.394988 102 7. CG/GC -0.967002 106 3. AG/TC -1.323547 102 8. GA/CT -0.938327 101 4. AT/TA -0.375235 130 9. GC/CG -0.711466 126 5. CA/GT -1.406794 95 10. TA/AT -0.144092 136 ID Triplet ΔGo37 [kcal/mol] Counts ID Triplet ΔG37o [kcal/mol] Counts 1. AAA/TTT -0.844597 10 17. CAG/GTC -1.625284 23 2. AAC/TTG -1.841904 19 18. CCA/GGT -1.568813 18 3. AAG/TTC -1.201194 17 19. CCC/GGG -2.396507 17 4. AAT/TTA -0.991596 19 20. CCG/GGC -1.888906 22 5. ACA/TGT -1.121939 20 21. CGA/GCT -1.668273 19 6. ACC/TGG -1.793995 23 22. CGC/GCG -2.195726 23 7. ACG/TGC -1.615048 30 23. CTA/GAT -0.871636 40 8. ACT/TGA -0.781693 23 24. CTC/GAG -1.198450 16 9. AGA/TCT -1.103536 15 25. GAA/CTT -1.317278 18 10. AGC/TCG -1.528461 36 26. GAC/CTG -1.498999 29 11. AGG/TCC -1.323278 18 27. GCA/CGT -1.454430 21 12. ATA/TAT -0.562379 46 28. GCC/CGG -1.973081 24 13. ATC/TAG -1.157521 29 29. GGA/CCT -1.696158 20 14. ATG/TAC -1.263601 26 30. GTA/CAT -1.158422 32 15. CAA/GTT -0.988509 16 31. TAA/ATT -0.519499 27 16. CAC/GTG -2.088824 17 32. TCA/AGT -1.042342 19
Estimated free energy parameters for unique DNA NN doublets and triplets and their corresponding counts of appearance in the perfect match data set. All parameters have been estimated using experimental values measured at 37°C and 1 M sodium concentration.
Figure 1 Correlation plot for the evaluation of free energy estimates (EVAL-FE) obtained with MultiRNAFold (with SantaLucia parameters) versus experimental free energies. The correlation of free energy estimates for all 695 DNA duplexes are represented. The plot depicts with different symbols and colors the source for each data point.
[25], Breslauer [26], Blake [27], Benight [28], SantaLucia [29], Sugimoto [30] and the Unified set [31]. Our set of NN thermodynamic doublet parameters summarized in Figure 12 differs from the unified parameters by less than 0.5 kcal/mol in 8 out of 10 cases. We also notice that our NN set follows in general the reported qualita-tive trend in order of decreasing stability: GC/CG = CG/GC > GG/CC > CA/GT = GT/CA = GA/CT = CT/ GA > AA/TT > AT/TA > TA/AT with one exception, namely GG/CC has a higher weight than GC/CG and CG/GC, an effect that could be caused by the low representation of the GG/CC doublets in the training set and by the absence of duplex initiation parameters in our model.
Conclusions
In this work we showed that no major differences exist among free energy estimations of short DNA duplex hybridization when comparing four publicly available programs that employ various sets of thermodynamic parameters.
Here we introduce a simplified TNN Model based on triplets interactions for perfect match hybridizations of DNA duplexes. The model is able to approximate free energies for DNA duplexes under various experimental conditions with higher accuracy and lower RMSEs
compared to the four publicly available programs con-sidered in this work. The improvement is more notice-able for DNA duplexes at non-standard experimental temperature conditions (for example at 25°C). This improvement obtained with the TNN Model based on triplets could be explained by the presence of a larger set of parameters consisting of 32 unique triplets (compared to only 10 unique doublets in the classical TNN Model) that better capture the impact of sequence components on the overall free energy of a DNA duplex. An alternative and potential complemen-tary explanation of these improvements is the use of a wider variety of experimental data points in the ther-modynamic parameter extrapolation process (the model training stage) compared to the smaller and less diverse data sets used in the other four programs. Nevertheless, we notice that additional experimental data employing longer and more diverse sequences is required in order to obtain a better approximation of free energies for DNA duplexes at other non-standard experimental conditions.
Three extensions of the TNN-Triplets-PM Model might improve its performance, given that additional experimental data that covers a higher percentage of the parameters and experimental condition combinations is obtained experimentally: (i) the model can incorporate
Figure 2 Correlation plot for the evaluation of secondary structure predictions (EVAL-SS) obtained with MultiRNAFold (with SantaLucia parameters) versus experimental free energies. The correlation of free energies for predicted secondary structures for all 695 DNA duplexes are represented. The plot depicts with different symbols and colors the source for each data point.
weighted additive terms that account for hybridization initialization, temperature, pH, sodium concentration or sequence concentrations; (ii) the model can incorporate symmetrical and asymmetrical internal loops, multi-branch loops, dangling ends and hairpin rules similar to those already existent in the classical TNN Model; (iii) the model can also incorporate positional dependencies of triplets with respect to the 5’ and 3’ ends of the sequences.
Methods
The present study is divided into two major sections: • Evaluation of free energy estimates (EVAL-FE): a comparative assessment of free energies calculated for DNA duplexes using different methods when both the duplex sequence and the duplex experi-mental secondary structure are given.
• Evaluation of secondary structure predictions (EVAL-SS): an accuracy assessment of secondary structure predictions when only the duplex sequence is given and the secondary structure is predicted.
Data
The benchmark data set used in this work consists of 695 experimental free energies and secondary structures for DNA duplexes, including 340 perfect matches and 355 imperfect matches. We collected these data from 29 pub-lications and we present its characteristics in Table 1. We must mention that a total of 42 DNA duplexes were removed from the original data set (with 737 DNA
-50 -40 -30 -20 -10 0 -50 -40 -30 -20 -10 0
MFEs - NN Model [kcal/mol]
MFEs - Experimental [kcal/mol] TNN-Doublets-PM r = 0.8466 rmse = 3.15 -50 -40 -30 -20 -10 0 -50 -40 -30 -20 -10 0
MFEs - NN Model [kcal/mol]
MFEs - Experimental [kcal/mol] TNN-Triplets-PM r = 0.9221 rmse = 2.20 -50 -40 -30 -20 -10 0 -50 -40 -30 -20 -10 0
MFEs - NN Model [kcal/mol]
MFEs - Experimental [kcal/mol] NN MultiRNAFold (Mathews) r = 0.6711 rmse = 5.56 -50 -40 -30 -20 -10 0 -50 -40 -30 -20 -10 0
MFEs - NN Model [kcal/mol]
MFEs - Experimental [kcal/mol] NN MultiRNAFold (SantaLucia) r = 0.6917 rmse = 5.35 -50 -40 -30 -20 -10 0 -50 -40 -30 -20 -10 0
MFEs - NN Model [kcal/mol]
MFEs - Experimental [kcal/mol] NN Vienna Package r = 0.6785 rmse = 4.31 -50 -40 -30 -20 -10 0 -50 -40 -30 -20 -10 0
MFEs - NN Model [kcal/mol]
MFEs - Experimental [kcal/mol] NN UNAFold
r = 0.6808 rmse = 5.35
Figure 3 Correlation plots for estimated versus experimental free energies of perfect matches. Each correlation plot consists of 340 data points corresponding to all perfect match duplexes covering all temperatures, sequence and sodium concentrations. The top left plot depicts the correlation between experimental free energies and free energies estimated by MultiRNAFold with SantaLucia parameters. The Pearson correlation equals 0.6917 and the RMSE is 5.35. The bottom left plot depicts the correlation between experimental free energies and free energies estimated by MultiRNAFold with Mathews parameters. The Pearson correlation equals 0.6711 and the RMSE is 5.56. The top middle plot depicts the correlation between experimental free energies and free energies estimated by UNAFold. The Pearson correlation equals 0.6808 and the RMSE is 5.35. The bottom middle plot depicts the correlation between experimental free energies and free energies estimated by Vienna Package. The Pearson correlation equals 0.6785 and the RMSE is 4.31. The top right plot depicts the correlation between experimental free energies and free energies estimated by the TNN-Doublets-PM Model. The Pearson correlation equals 0.8466 and the RMSE is 3.15. The bottom right plot depicts the correlation between experimental free energies and free energies estimated by the TNN-Triplets-PM Model. The Pearson correlation equals 0.9221 and the RMSE is 2.20.
Table 5 Model training
Require:A thermodynamic model T, an input set S with perfect match DNA duplexes.
Ensure:An optimal set of thermodynamic DNA parameters X for the input model
1: Initialize counts matrix F with zeros for all unique doublets/triplets 2: Initialize results matrix R with experimentally approximated free energies for each duplex
3: for i = 0 to ||S|| do
4: Count unique doublets/triplets in duplex S[i] and update F 5: end for
6: Solve the equation X = arg minX(F × X - R)2
duplexes - see Additional file 1) because the ctEnergy function from UNAFold failed to produce valid free ener-gies, due to the lack of DNA parameters for mismatches. The removed data corresponds to 30 duplexes from [31], 4 duplexes from [32], 4 duplexes from [33], 2 duplexes from [34] and 2 duplexes from [35]. The lengths of DNA sequences in the data set range from 4 nucleotides [29] to 30 nucleotides [36], some of them (length 8 and 9) being over represented (see Figure 13).
The GC-content (%) of the sequences in the benchmark data set (see Figure 14) cover the whole spectra from 0% to 100%, with a dominant peak at 50%.
Sequence concentrations range from 17.5 × 10⁻⁶M in [33] to 10-4M in [20,21,31,37,38]. The sodium concen-tration varies from 0.1 M in [39] and [40] to 1 M in 20 out of 29 sources. The reported free energies were mea-sured at reaction temperatures ranging between 24.85°C [33,41] and 50°C [32].
Free energy calculations
In this study, three publicly available packages were used to calculate and compare the free energies for pairs of short DNA sequences: MultiRNAFold (with Mathews and SantaLucia parameters), UNAFold and the Vienna Package. All packages implement the TNN Model based on base doublet parameters.
The basic free energy calculations implemented in MultiRNAFold and Vienna Package are performed according to the Gibbs equation:
ΔGTo =ΔHo−T⋅ΔSo (1)
where G° is the free energy measured, H° is the enthalpy, T is the absolute temperature measured in degrees Kelvin and S° is the entropy.
For a general two-state transition process of the type A + B ⇌ AB at equilibrium, the free energy change is calculated as follows:
ΔGo= − ⋅R T ln k⋅ ( ) (2)
where R is the gas constant (1.98717 cal/(mol K)), T is the absolute temperature, and k is the equilibrium constant.
Computational procedures
The two main sections of this study, namely the evalua-tion of free energy estimates and the evaluaevalua-tion of sec-ondary structure predictions, employ computational procedures made available in the corresponding software packages. The evaluation of free energy estimates (EVAL-FE) includes the following procedures:
• The function free energy pairfold (sequence1, sequence2, known structure)is provided by the Mul-tiRNAFold package to compute the free energy for two sequences when the known secondary structure is given. The pairfold wrapper has been slightly modified to accept as parameters: two sequences, the temperature, the set of parameters (Mathews or SantaLucia), the nucleic acid (DNA or RNA) and the type of hybridization (with or without intra-molecu-lar interactions between nucleotides).
• The function RNAeval is provided by the Vienna Package to compute the free energy for two sequences when the known secondary structure is provided. We wrote a Python wrapper that calls this function with the following parameters: -T tempera-ture, -P dna.par. The wrapper also pre-processes the sequence and structure input so to satisfy the inter-activity requirements of the RNAeval function. • The function ctEnergy is provided by the UNAFold Package to compute the free energy for two sequences when the known secondary structure is given. We wrote a Python wrapper that pre-processes the sequences and structures into a CT-formatted input file and calls the function with the following parameters: -n DNA, -t temperature, -N sodium concentration.
The evaluation of secondary structure predictions (EVAL-SS) includes the following procedures:
• The function pairfold mfe (sequence1, sequence2, output structure)is provided by the MultiRNAFold package to compute the minimum free energy sec-ondary structure for two DNA sequences that fold into ’output structure’. The pairfold wrapper has been slightly modified as described above.
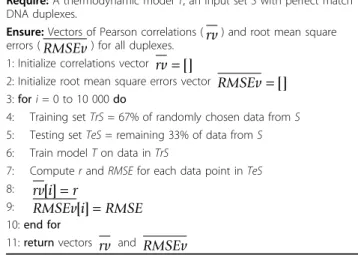
Table 6 Model evaluation
Require:A thermodynamic model T, an input set S with perfect match DNA duplexes.
Ensure:Vectors of Pearson correlations (rv) and root mean square errors (RMSEv) for all duplexes.
1: Initialize correlations vector rv = []
2: Initialize root mean square errors vector RMSEv = [] 3: for i = 0 to 10 000 do
4: Training set TrS = 67% of randomly chosen data from S 5: Testing set TeS = remaining 33% of data from S 6: Train model T on data in TrS
7: Compute r and RMSE for each data point in TeS 8: rv i[ ] =r
9: RMSEv i[ ] =RMSE 10: end for
• The function RNAcofold is provided by the Vienna Package to predict the free energy secondary struc-ture for two sequences. A wrapper has been created for this function to accommodate the input and the parameters for the interactive interface as described above.
• The script UNAFold.pl is provided by the UNA-Fold Package to predict the free energy secondary structure for two sequences. We wrote a Python wrapper that pre-processes the sequences and
structures into a CT-formatted input file and calls the function with the same parameters as for the ctEnergyfunction.
The TNN-Triplets-PM Model
For the case when only free energies for perfect matches are evaluated, we explore an approach that extends the classical TNN Model by looking at base triplets. A simi-lar approach was introduced in 1999 by [16]. For the
Doublets
Triplets
MultiRNAFold (Mathews)
MultiRNAFold (SantaLucia)
Vienna Package
UNAFold
0.0
0.1
Pearson coeff. (r)
0.2
0.2
0.3
0.4
0.4
0.5
0.6
0.6
0.7
0.8
0.8
0.9
1.0
1.0
Figure 4 Box plots for Pearson correlations (r) corresponding to all 340 perfect match duplexes. The figure represents box plots for Pearson correlation coefficients for all 340 perfect match duplex free energies measured at various temperatures, sequence and sodium concentrations. The doublet- and triplet-based models were executed 10 000 times on randomly selected subsets with 67% training data and 33% testing data.
classical TNN Model, only ten different nearest-neigh-bour interactions (out of 16) are possible for any Wat-son-Crick DNA duplex structure due to rotational identities. Here A is hydrogen bonded with T and G is hydrogen bonded with C. These interactions are AA/ TT, AT/TA, TA/AT, CA/GT, GT/CA, CT/GA, GA/CT, CG/GC, GC/CG, and GG/CC. Here the slash, /, sepa-rates strands in anti parallel orientation (e.g., TC/AG
means 5’ - TC - 3’ paired with 3’ - AG - 5’). While the classical TNN model assumes that the stability of a DNA duplex depends on the identity and orientation of only close neighbouring base pairs, the one based on tri-plet interactions takes the approach one step further and assumes that the stability of a DNA duplex can be approximated if the first two neighbours of each base are considered. Since our goal is to examine and
Doublets
Triplets
MultiRNAFold (Mathews)
MultiRNAFold (SantaLucia)
Vienna Package
UNAFold
2
3
RMSE
4
5
6
2
3
4
5
6
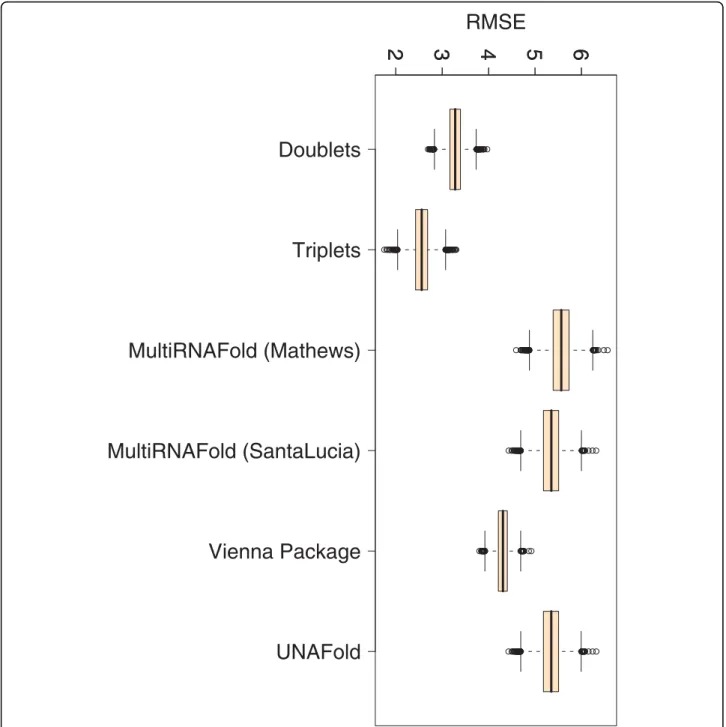
Figure 5 Box plots for RMSEs corresponding to all 340 perfect match duplexes. The figure represents box plots for RMSEs for all 340 perfect match duplex free energies measured at various temperatures, sequence and sodium concentrations. The doublet- and triplet-based models were executed 10 000 times on randomly selected subsets with 67% training data and 33% testing data.
Doublets
Triplets
MultiRNAFold (Mathews)
MultiRNAFold (SantaLucia)
Vienna Package
UNAFold
0.0
0.2
Pearson coeff. (r)
0.4
0.6
0.8
1.0
Figure 6 Box plots for Pearson correlations (r) corresponding to 197 perfect match duplex free energies measured at 25°C. The figure represents box plots for Pearson correlation coefficients for 197 perfect match duplex free energies measured at 25°C and a sodium
concentration of 1 M. The doublet- and triplet-based models were executed 10 000 times on randomly selected subsets with 67% training data and 33% testing data.
Doublets
Triplets
MultiRNAFold (Mathews)
MultiRNAFold (SantaLucia)
Vienna Package
UNAFold
2
3
4
5
6
7
8
RMSE
Figure 7 Box plots for RMSEs corresponding to 197 perfect match duplex free energies measured at 25°C. The figure represents box plots for RMSEs for 197 perfect match duplex free energies measured at 25°C and a sodium concentration of 1 M. The doublet- and triplet-based models were executed 10 000 times on randomly selected subsets with 67% training data and 33% testing data.
Doublets
Triplets
MultiRNAFold (Mathews)
MultiRNAFold (SantaLucia)
Vienna Package
UNAFold
0.90
0.92
Pearson coeff. (r)
0.94
0.96
0.98
1.00
Figure 8 Box plots for Pearson correlations (r) corresponding to 143 perfect match duplex free energies measured at 37°C. The figure represents box plots for Pearson correlation coefficients for 143 perfect match duplex free energies measured at 37°C and a sodium
concentration of 1 M. The doublet- and triplet-based models were executed 10 000 times on randomly selected subsets with 67% training data and 33% testing data.
Doublets
Triplets
MultiRNAFold (Mathews)
MultiRNAFold (SantaLucia)
Vienna Package
UNAFold
0.5
1.0
1.5
RMSE
2.0
2.5
3.0
Figure 9 Box plots for RMSEs corresponding to 143 perfect match duplex free energies measured at 37°C. The figure represents box plots for RMSEs for 143 perfect match duplex free energies measured at 37°C and a sodium concentration of 1 M. The doublet- and triplet-based models were executed 10 000 times on randomly selected subsets with 67% training data and 33% testing data.
Figure 10 Histograms of average variations of the SENS, PPV and F-measure with respect to sequence length. The histograms corresponding to average variations of the SENS, PPV and F-measure (defined in Methods) with respect to sequence length were calculated for all 695 duplexes. All minimum free energies were calculated with PairFold-SantaLucia.
Figure 11 Histograms of average variations of the SENS, PPV and F-measure with respect to GC-content percentage. The histograms corresponding to average variations of the SENS, PPV and F-measure (defined in Methods) with respect to GC-content percentage were calculated for all 695 duplexes. All minimum free energies were calculated with PairFold-SantaLucia.
Figure 12 Variation of doublet NN values for 9 sets of parameters. Free energy values corresponding to nine sets (our set and 8 others) of thermodynamic nearest-neighbour doublet parameters at 37°C are displayed in this plot. Four (Gotoh, Vologodskii, Blake and Benight) out of the eight publicly available sets of doublet parameters correspond to models that do not account for initiation penalties for duplex formations [18], and the sodium concentration for their experiments was between 0.0195 M and 0.195 M. For the other 4 sets (Breslauer, SantaLucia, Sugimoto and Unified) the sodium concentration equals 1 M.
Figure 13 The distribution of sequence lengths for the complete data set. The sequence length distribution of 695 DNA duplexes. The 8-mers, 9-mers followed by 17-mers have the highest frequencies, while 4-8-mers, 5-mers and 25-mers have the lowest frequencies.
compare the impact of doublet versus triplet interac-tions on the accuracy of free energy estimainterac-tions, the approach proposed in this paper relies solely on triplet interactions, while the one proposed by [16] uses a more complex cumulative approach that combines sing-let, doublet and triplet interactions within the same model. Due to rotational identities, only 32 different nearest-neighbour interactions are possible (out of a total of 64) for any Watson-Crick triplet structure. These interactions are enumerated in Table 2 together with corresponding parametric values obtained via a least-mean squared optimization solution for equation 3.
F×X=R (3)
where F is a N × 32 matrix of counts for all perfect match data points, X is a vector with 32 unknown triplet parameter values, and R is a vector with N free energy experimental values for perfect matches. We solve the following equation:
X F X R
X
=arg min( × − )2 (4)
These values were obtained by using an over deter-mined system of N equations (3) and solving equation 4 with a least-mean squared optimization function (imple-mented in the backslash operator for matrices) available in Matlab 7.7. Here N takes the value 228 (67% of 340
perfect match free energies measured at 25°C and 37°C), 132 (67% from 197 perfect match free energies mea-sured at 25°C), or 96 (67% of 145 perfect match free energies measured at 37°C). The system with N equa-tions has been extrapolated by selecting from the initial data set only the free energy measurements for perfect match DNA duplexes and counting the frequency of tri-plets in each duplex. Thus, for each duplex, the sum of parametric values for each triplet multiplied with its counts equals the experimental free energy. While our model is very simple and currently does not take into consideration mismatches, internal loops, and dangling ends, its strength is given by its ability to estimate per-fect match DNA duplex free energies for a wide range of sodium, sequence and target concentrations and tem-peratures. This strength is given by the presence of a large and mixed training data set that was used to extra-polate the nearest-neighbour (NN) parameters for both the doublet- and the triplet-based models.
Model training and testing
The training process for the TNN-Triplets-PM Model is summarized in Table 5. We first process the input set, which contains perfect match DNA sequences and their corresponding experimentally derived free energies. The processing consists of scanning each perfect match sequence from left to right by moving a window of size 3 nucleotides (or 2 for the doublets) and counting the
Figure 14 The distribution of GC-content percentages for the complete data set. The distribution of GC-content percentages for 695 duplexes. The majority of sequences have a 50% GC-content while only a few sequences have either low (10%, 20%) or high (100%) GC-content percentages.
frequency of each of the 32 unique triplets. We record each frequency at corresponding positions (i, j) in matrix F and each experimentally derived free energy is recorded at position i in matrix R. Here i represents the number of the sequence in the set and j represents the number of the triplet (from 1 to 32), whose frequency is recorded. After matrices F and R have been populated, a solution for equation 4 is computed and the value of vector X containing free energy parameters for all the unique triplets is reported.
The evaluation process of the TNN-Triplets-PM Model is summarized in Table 6. The evaluation process is repeated 10 000 times in this work. Each iteration consists of the following steps. First the data set is divided uniformly at random in a training set, TrS con-sisting of 67% of the data and a testing set, TeS that
contains the remaining 33%. Next, the training process described in Table 5 is used to extrapolate the first set of perfect match triplet parameters. The derived para-meters are used next to compute the Pearson momen-tum correlation coefficients and the RMSEs for each DNA perfect match duplex from TeS. Each correlation coefficient and RMSE is recorded in corresponding vec-tors to be analyzed later. The complete coverage of the triplet space, i.e. all possible triplets during the genera-tion of training and testing sets using a randomized mechanism is not ensured for some of the 10 000 sets mostly due to the presence of a few under-represented (less than 20 CCC/GGG) or over-represented (more than 180 GAC/CTG) triplets that characterize the data set with perfect matches (see Figures 15 and 16). Never-theless, we noticed that the training sets that produced
TAAT AATT ATTA AGTC CCGG CAGT GACT ACTG CGGC GCCG Frequency 0 100 200 300 400 500
Figure 15 Distribution of doublet frequencies. The distribution of frequencies for all doublets corresponding to 340 perfect matches is presented. The doublet with the lowest frequency is TA/AT and the one with highest is GC/CG.
the best results cover completely the triplet space. The same coverage was observed for the doublets.
Comparative measures
We use a large number of measures of similarity between experimental and computed free energies. Some of these measures were previously used by [42] to compare melting temperatures obtained with different methods and by [6] to estimate model parameters for RNA secondary structure prediction. If not stated other-wise, all comparisons in this paper were done on a data set comprising 695 pairs of DNA sequences collected
from 29 publications. The measures used in this study are grouped in two categories, namely:
Measures that evaluate accuracy of free energy estimations
The following measures are used for free energy estima-tions of the known structures, as well as free energy estimations of predicted structures.
• the observed absolute difference between experi-mental and estimated free energies (MFE_AD), • the Pearson correlation coefficient (r), CCCGGG ACATGT AACTTG TAAATT CTCGAG AGGTCC AATTTA ACTTGA ACCTGG GAACTT AGATCT ATATAT ATCTAG GTACAT AAATTT TCAAGT GCACGT CACGTG CCGGGC CTAGAT AAGTTC GCCCGG ACGTGC CAAGTT CGAGCT CAGGTC ATGTAC AGCTCG CGCGCG CCAGGT GGACCT GACCTG Frequency 0 50 100 150 200
Figure 16 Distribution of triplet frequencies. The distribution of frequencies for all triplets corresponding to 340 perfect matches is presented. The triplet with the lowest frequency is CCC/GGG and the one with highest is GAC/CTG.
• the root mean squared error (RMSE),
Measures that evaluate accuracy of secondary structure predictions
• the secondary structure similarity index of experi-mental and predicted secondary structures (SSSI) • the prediction sensitivity for secondary structures (SENS)
• the positive predictive value for secondary struc-tures (PPV)
• the F-measure for predicted secondary structures (F) For MFE_AD, SSSI, SENS, PPV and F we report the minimum, the first quartile, the median, the mean, the third quartile, the maximum and the standard deviation.
We define the secondary structure similarity index (SSSI) for two equally long structures as follows:
SSSI SS s exp s calc SS s exp s calc len s exp len s exp
= + + ( , ) ( , ) ( ) ( 1 1 2 2 1 2 )) ⋅ 100 (5)
where s1exp, s2exp are two equally long structures
obtained experimentally, s1calc, s2calc are two equally
long calculated structures, and SS(a, b) is the total num-ber of identical characters at corresponding positions in both structures. SSSI represents the percentage of posi-tions in which two structures agree.
Unlike similar measures that assign a +1 score for two identical base pairs in two duplex structures, SSSI assigns a +1 score for two base pairs that have either the start or the end positions identical. This mechanism allows the differentiation between duplex secondary structures that have either one (score +1) or both (score +2) bases in a base pair correctly predicted.
The sensitivity, positive predictive value and F-mea-sure are defined as in [6], namely:
Sensitivity =number of correctly predicted base pairs
number of true base pairs (6)
PPV =number of correctly predicted base pairs
number of prediicted base pairs (7)
F-measure = ⋅ ⋅ + 2 Sensitivity PPV
Sensitivity PPV (8)
Computational infrastructure
The entire analysis of this study was done with R ver-sion 2.5.1, Perl 5.8.8 and Python 2.5. All computations
were carried out on a Open SuSe 10.2 Linux (kernel version 2.6.18.2) machine equipped with a Pentium 4, 2.8 GHz processor with 1 GB of RAM.
Additional file 1: Data set in comma separated value. The file contains information representing the data set used in this work. The data is structured on 15 columns as follows: (col 1) first sequence of the duplex, (col 2) second sequence of the duplex, (col 3) unique duplex ID containing the first and last authors of the papers that have first published the data, (col 4) dot-parenthesis notation of the secondary structure representation for the first sequence, (col 5) dot-parenthesis notation of the secondary structure representation for the second sequence, (col 6) experimental free energy measurement, (col 7) measurement error for the free energy, (col 8) experimental entropy measurement, (col 9) measurement error for the entropy, (col 10) experimental enthalpy measurement, (col 11) measurement error for the enthalpy, (col 12) experimental temperature of hybridization, (col 13) concentration for self-complementary sequences, (col 14) concentration for non self-complementary sequences, (col 15) [N a]+concentration.
Click here for file
[ http://www.biomedcentral.com/content/supplementary/1471-2105-11-105-S1.CSV ]
Acknowledgements
Funding for this work was provided to DT and SL by the National Research Council of Canada. We gratefully acknowledge the helpful comments and suggestions provided by Dr. Anne Condon and Dr. Miroslava Cuperlovic-Culf. We thank Dr. Fazel Famili, Georges Corriveau and Natalie Hartford for proofreading our article and the anonymous reviewers of this manuscript for their valuable feedback.
Author details
1National Research Council of Canada, Institute of Information Technology,
100 des Aboiteaux Street, Suite 1100, Moncton, NB, E1A 7R1, Canada.
2Department of Genome Sciences, University of Washington, 1705 NE Pacific
St, Seattle, WA 98195-5065, USA.
Authors’ contributions
DT and MA planned the research, collected and curated the data, and wrote the paper. SL wrote the code for results computation and collection with UNAFold and the Vienna Package. DT wrote the code for results computation and collection with MultiRNAFold and analyzed the data. All authors read and approved the final manuscript.
Received: 6 October 2009
Accepted: 24 February 2010 Published: 24 February 2010
References
1. SantaLucia J, Turner DH: Measuring the thermodynamics of RNA secondary structure formation. Biopolymers1997, 44(3):309-319. 2. Barbault F, Huynh-Dinh T, Paoletti J, Lanceloti G: A new peculiar DNA
structure: NMR solution structure of a DNA kissing complex. J Biomol Struct Dyn2002, 19(4):649-658.
3. Schmidt C, Welz R, Müller S: RNA double cleavage by a hairpin-derived twin ribozyme. Nucleic Acids Res2000, 28(4):886-894.
4. Gharaibeh RZ, Fodor AA, Gibas CJ: Software note: using probe secondary structure information to enhance Affymetrix GeneChip background estimates. Comput Biol Chem2007, 31(2):92-98.
5. Andronescu M, Zhang ZC, Condon A: Secondary structure prediction of interacting RNA molecules. J Mol Biol2005, 345(5):987-1001.
6. Andronescu M, Condon A, Hoos HH, Mathews DH, Murphy KP: Efficient parameter estimation for RNA secondary structure prediction. Bioinformatics2007, 23(13):19-28.
7. Hofacker IL: Vienna RNA secondary structure server. Nucleic Acids Res 2003, 31(13):3429-3431.
8. Markham NR, Zuker M: DINAMelt web server for nucleic acid melting prediction. Nucleic Acids Res2005, , 33 Web Server: 577-581.
9. Andronescu M: Algorithms for predicting the secondary structure of pairs and combinatorial sets of nucleic acid strands. PhD thesisUniversity of British Columbia, Computer Science Department 2003.
10. Turner Lab, last visited: November 2008. http://rna.chem.rochester.edu/. 11. Mathews Lab Webpage, last visited: November 2008. http://rna.urmc.
rochester.edu/.
12. SantaLucia Lab, last visited: November 2008. http://ozone3.chem.wayne. edu/home/.
13. Zuker M, Stiegler P: Optimal computer folding of large RNA sequences using thermodynamics and auxiliary information. Nucleic Acids Res1981, 9:133-148.
14. McCaskill JS: The equilibrium partition function and base pair binding probabilities for RNA secondary structure. Biopolymers1990, 29(6-7):1105-1119.
15. Wuchty S, Fontana W, Hofacker IL, Schuster P: Complete suboptimal folding of RNA and the stability of secondary structures. Biopolymers 1999, 49(2):145-165.
16. Owczarzy R, Vallone PM, Goldstein RF, Benight AS: Studies of DNA dumbbells VII: evaluation of the next-nearest-neighbor sequence-dependent interactions in duplex DNA. Biopolymers1999, 52:29-56. 17. Owczarzy R, Vallone PM, Gallo FJ, Paner TM, Lane MJ, Benight AS:
Predicting sequence-dependent melting stability of short duplex DNA oligomers. Biopolymers1997, 44(3):217-239.
18. SantaLucia J: A unified view of polymer, dumbbell, and oligonucleotide DNA nearest-neighbor thermodynamics. Proc Natl Acad Sci USA1998, 95(4):1460-1465.
19. Doktycz MJ, Morris MD, Dormady SJ, Beattie KL, Jacobson KB: Optical melting of 128 octamer DNA duplexes. Effects of base pair location and nearest neighbors on thermal stability. J Biol Chem1995,
270(15):8439-8445.
20. Allawi HT, SantaLucia J: Thermodynamics of internal C.T mismatches in DNA. Nucleic Acids Res1998, 26(11):2694-2701.
21. Allawi HT, SantaLucia J: Nearest neighbor thermodynamic parameters for internal G.A mismatches in DNA. Biochemistry1998, 37(8):2170-2179. 22. Leonard GA, Booth ED, Brown T: Structural and thermodynamic studies
on the adenine.guanine mismatch in B-DNA. Nucleic Acids Res1990, 18(19):5617-5623.
23. Li Y, Zon G, Wilson WD: Thermodynamics of DNA duplexes with adjacent G.A mismatches. Biochemistry1991, 30(30):7566-7572.
24. Gotoh O, Tagashira Y: Stabilities of nearest-neighbor doublets in double-helical DNA determined by fitting calculated melting profiles to observed profiles. Biopolymers1981, 20:1033-1042.
25. Vologodskii AV, Amirikyan BR, Lyubchenko YL, Frank-Kamenetskii MD: Allowance for heterogeneous stacking in the DNA helix-coil transition theory. J Biomol Struct Dyn1984, 2:131-148.
26. Breslauer KJ, Frank R, Blöcker H, Marky LA: Predicting DNA duplex stability from the base sequence. Proc Natl Acad Sci USA1986, 83(11):3746-3750. 27. Delcourt S, Blake R: Stacking energies in DNA. Journal of Biological
Chemistry1991, 266(23):15160-15169.
28. Doktycz MJ, Goldstein RF, Paner TM, Gallo FJ, Benight AS: Studies of DNA dumbbells. I. Melting curves of 17 DNA dumbbells with different duplex stem sequences linked by T4 endloops: evaluation of the nearest-neighbor stacking interactions in DNA. Biopolymers1992, 32(7):849-864. 29. SantaLucia J, Allawi HT, Seneviratne PA: Improved nearest-neighbor
parameters for predicting DNA duplex stability. Biochemistry1996, 35(11):3555-3562.
30. Sugimoto N, Nakano S, Yoneyama M, Honda K: Improved thermodynamic parameters and helix initiation factor to predict stability of DNA duplexes. Nucleic Acids Res1996, 24(22):4501-4505.
31. Allawi HT, SantaLucia J: Thermodynamics and NMR of internal G.T mismatches in DNA. Biochemistry1997, 36(34):10581-10594. 32. Aboul-ela F, Koh D, Jr IT, Martin FH: Base-base mismatches.
Thermodynamics of double helix formation for dCA3XA3G + dCT3YT3G (X, Y = A, C, G, T). Nucleic Acids Research1985, 13(13):4811-4824. 33. Tibanyenda N, De Bruin SH, Haasnoot CA, Marel van der GA, van Boom JH,
Hilbers CW: The effect of single base-pair mismatches on the duplex stability of d(T-A-T-T-A-A-T-A-T-C-A-A-G-T-T-G). d(C-A-A-C-T-T-G-A-T-A-T-T-A-A-T-A). Eur J Biochem1984, 139:19-27.
34. Tanaka F, Kameda A, Yamamoto M, Ohuchi A: Thermodynamic parameters based on a nearest-neighbor model for DNA sequences with a single-bulge loop. Biochemistry2004, 43(22):7143-7150.
35. Wilson WD, Dotrong MH, Zuo ET, Zon G: Unusual duplex formation in purine rich oligodeoxyribonucleotides. Nucleic Acids Res1988, 16(11):5137-5151.
36. Petruska J, Arnheim N, Goodman MF: Stability of intrastrand hairpin structures formed by the CAG/CTG class of DNA triplet repeats associated with neurological diseases. Nucleic Acids Res1996, 24(11):1992-1998.
37. Allawi HT, SantaLucia J: Nearest-neighbor thermodynamics of internal A.C mismatches in DNA: sequence dependence and pH effects. Biochemistry 1998, 37(26):9435-9444.
38. Sugimoto N, Tanaka A, Shintani Y, Sasaki M: Double-Helix Melting of Octamers of Deoxyriboadenylic and Deoxyribothymidylic Acids in the Presence of Ethidium. Chemistry Letters1991, 20:9-12.
39. A LE, Freier SM: Relative thermodynamic stability of DNA, RNA, and DNA: RNA hybrid duplexes: relationship with base composition and structure. Biochemistry1995, 34(34):10807-10815.
40. Nakano S, Fujimoto M, Hara H, Sugimoto N: Nucleic acid duplex stability: influence of base composition on cation effects. Nucleic Acids Res1999, 27(14):2957-2965.
41. Seela F, Debelak H: The N(8)-(2’-deoxyribofuranoside) of 8-aza-7-deazaadenine: a universal nucleoside forming specific hydrogen bonds with the four canonical DNA constituents. Nucleic Acids Res2000, 28(17):3224-3232.
42. Panjkovich A, Melo F: Comparison of different melting temperature calculation methods for short DNA sequences. Bioinformatics2005, 21(6):711-722.
43. Bommarito S, Peyret N, SantaLucia J: Thermodynamic parameters for DNA sequences with dangling ends. Nucleic Acids Res2000, 28(9):1929-1934. 44. Clark CL, Cecil PK, Singh D, Gray DM: CD, absorption and thermodynamic
analysis of repeating dinucleotide DNA, RNA and hybrid duplexes [d/r (AC)]12.[d/r(GT/U)]12 and the influence of phosphorothioate substitution. Nucleic Acids Res1997, 25(20):4098-4105. 45. Gelfand CA, Plum GE, Grollman AP, Johnson F, Breslauer KJ:
Thermodynamic consequences of an abasic lesion in duplex DNA are strongly dependent on base sequence. Biochemistry1998,
37(20):7321-7327.
46. LeBlanc D, Morden K: Thermodynamic characterization of
deoxyribooligonucleotide duplexes containing bulges. Biochemistry1991, 30(16):4042-4047.
47. Petruska J, Goodman MF, Boosalis MS, Sowers LC, Cheong C, Tinoco I: Comparison between DNA melting thermodynamics and DNA polymerase fidelity. Proc Natl Acad Sci USA1988, 85(17):6252-6256. 48. Peyret N, Seneviratne PA, Allawi HT, SantaLucia J: Nearest-neighbor
thermodynamics and NMR of DNA sequences with internal A.A, C.C, G. G, and T.T mismatches. Biochemistry1999, 38(12):3468-3477.
49. Pirrung MC, Zhao X, Harris SV: A universal, photocleavable DNA base: nitropiperonyl 2’-deoxyriboside. J Org Chem 2001, 66(6):2067-2071. 50. Plum GE, Grollman AP, Johnson F, Breslauer KJ: Influence of an exocyclic
guanine adduct on the thermal stability, conformation, and melting thermodynamics of a DNA duplex. Biochemistry1992, 31(48):12096-12102. 51. Ratmeyer L, Vinayak R, Zhong YY, Zon G, Wilson WD: Sequence specific
thermodynamic and structural properties for DNA.RNA duplexes. Biochemistry1994, 33(17):5298-5304.
52. Sugimoto N, Honda KI, Sasaki M: Application of the thermodynamic parameters of DNA stability prediction to double-helix formation of deoxyribooligonucleotides. Nucleosides Nucleotides1994, 13(6):1311-1317. 53. Wu P, Nakano S, Sugimoto N: Temperature dependence of
thermodynamic properties for DNA/DNA and RNA/DNA duplex formation. Eur J Biochem2002, 269(12):2821-2830.
doi:10.1186/1471-2105-11-105
Cite this article as:Tulpan et al.: Free energy estimation of short DNA duplex hybridizations. BMC Bioinformatics2010 11:105.