DOI:10.1093/jnci/dju247
First published online September 22, 2014
© The Author 2014. Published by Oxford University Press. All rights reserved. For Permissions, please e-mail: [email protected].
Article
test of Four colon cancer risk-Scores in Formalin Fixed Paraffin
embedded Microarray Gene expression Data
Antonio F. Di Narzo, Sabine Tejpar, Simona Rossi, Pu Yan, Vlad Popovici, Pratyaksha Wirapati, Eva Budinska, Tao Xie, Heather Estrella, Adam Pavlicek, Mao Mao, Eric Martin, Weinrich Scott, Fred T. Bosman, Arnaud Roth, Mauro Delorenzi Manuscript received December 9, 2013; revised April 22, 2014; accepted July 2, 2014.
Correspondence to: Mauro Delorenzi, PhD, SIB Swiss Institute of Bioinformatics, and University Lausanne, Office 2021, Génopode-UNIL, Quartier Sorge, CH-1015 Lausanne, Switzerland (e-mail: [email protected]).
Background Prognosis prediction for resected primary colon cancer is based on the T-stage Node Metastasis (TNM) staging
system. We investigated if four well-documented gene expression risk scores can improve patient stratification.
Methods Microarray-based versions of risk-scores were applied to a large independent cohort of 688 stage II/III tumors
from the PETACC-3 trial. Prognostic value for relapse-free survival (RFS), survival after relapse (SAR), and overall survival (OS) was assessed by regression analysis. To assess improvement over a reference, prognostic model was assessed with the area under curve (AUC) of receiver operating characteristic (ROC) curves. All statistical tests were two-sided, except the AUC increase.
Results All four risk scores (RSs) showed a statistically significant association (single-test, P < .0167) with OS or RFS in
uni-variate models, but with HRs below 1.38 per interquartile range. Three scores were predictors of shorter RFS, one of shorter SAR. Each RS could only marginally improve an RFS or OS model with the known factors T-stage, N-stage, and microsatellite instability (MSI) status (AUC gains < 0.025 units). The pairwise interscore discordance was never high (maximal Spearman correlation = 0.563) A combined score showed a trend to higher prognostic value and higher AUC increase for OS (HR = 1.74, 95% confidence interval [CI] = 1.44 to 2.10, P < .001, AUC from 0.6918 to 0.7321) and RFS (HR = 1.56, 95% CI = 1.33 to 1.84, P < .001, AUC from 0.6723 to 0.6945) than any single score.
Conclusions The four tested gene expression–based risk scores provide prognostic information but contribute only
margin-ally to improving models based on established risk factors. A combination of the risk scores might provide more robust information. Predictors of RFS and SAR might need to be different.
JNCI J Natl Cancer Inst (2014) 106(10): dju247 doi:10.1093/jnci/dju247
For the management of primary colon cancer (CC), evidence-based (T-stage Node Metastasis [TNM] and other criteria) guide-lines propose adjuvant chemotherapy for stage III cases and for high-risk subgroups of stage II (1). Recently published gene expres-sion–based risk scores (RSs), which use a combination of genes, purportedly contribute additional prognostic information, and allow a better definition of levels of risk (2–12). These models were internally validated using data-resampling techniques. The potential bias that might result from effects accidentally present in a dataset but not in the relevant overall population should be ruled out in one or multiple independent cohorts, because this bias defies internal validation techniques (13). An important element is confir-mation on formalin fixed paraffin embedded (FFPE) tissues, as this remains the standard in terms of routinely available test samples. This should be done without redefinition of the weight given to individual genes to optimally fit the new data, as this would affect the new risk assessment.
In view of introducing an RS for real clinical applications, a cru-cial issue is to test and compare the prognostic value of the differ-ent gene sets and scoring models when applied to the same data generated with a uniform technology and tested in models that also contain the other known risk-factors. Also of high interest is inves-tigating to what extent they concord in risk assessment at the level of the individual patient (14).
We tested four well-documented RSs (Table 1), available with a scoring formula sufficiently detailed to make them assessable. The seven-gene signature developed by Genomic Health (GHS) (9) is of special interest because it was derived from a large collection of data, was since tested in two confirmation studies (15,16), and its routine use is being promoted. This RS was obtained on about 1800 stage II-III tumors from multiple studies (9). The prognostic effects of virtually all of the tested genes appeared not to be different for stage II and stage III tumors. The higher rate of relapse in node-positive stage III allowed the identification of risk genes for relapse, October 8 dju247
which then appeared to be prognostic also in stage II. The RS pro-posed by Veridex (VDS) (5) uses seven genes derived from 123 stage II tumors by reducing an initially proposed 23-gene signature (12) developed on 74 stage II tumors. The Almac (ALM) RS (7) was developed on 215 stage II cases, with 634 probe sets representing 477 genes of their CC Disease Specific Array. The RS proposed by Oh et al. (10), which we call the MDA (MD Anderson) system, uses 114 probe sets, representing 86 genes. This RS was developed on a heterogeneous training set of 177 cases that included stage I-IV patients, with very short survival times in stage IV cases and select-ing for genes that separated two main groups obtained by unsu-pervised clustering, rather than selecting genes associated with a prespecified survival endpoint. This RS was validated on an inde-pendent, publically available data set of 213 stage I-IV patients (10). To compare the prognostic value of the individual RSs when used with the same microarray data from FFPE material and assess their concordance, we tested them on a single independent large homogeneous CC cohort as stand-alone risk indicators, as com-bined risk indicators, and in combination with several established clinico-pathological prognostic variables.
Methods
Patients and Samples
The PETACC-3 (EORTC 40993) is a multicenter pan-European study that included patients aged 18 to 75 years, with completely resected, histologically-proven, stage II-III colonic adenocarcinoma, as described previously (17). After providing written informed consent in which the planned translational study program was clearly specified, patients were randomized to receive six months of 5-FU/FA either alone or in combination with irinotecan (see also Supplementary Materials, available online) and then followed regularly. The trial results were negative (17). The procedures used to establish patho-logical and molecular features, including microsatellite instability (MSI) (18), RNA extraction from FFPE tissue samples (19), as well as analysis of prognostic markers (18,20), have been reported previously. TNM staging was according to the AJCC 5th edition guidelines of
1997. The translational research program was reviewed by the ethical committee of each institution participating to the trial.
Gene Expression Data Cohort
Array-based gene expression data were previously obtained (21) from the PETACC-3 trial biobank (17–19) using the Almac micro-arrays ADXCRC (Almac, Craigavon, UK; ArrayExpress accession:
A-AFFY-101). Of the 1404 patients in the biobank, profiling was undertaken for 1130: all 984 stage III cases, the 73 stage II cases with an relapse-free survival (RFS) event and the same number of randomly selected nonrelapsers. Final quality control was passed by samples representing 688 patients (60.9%, 108 stage II, 580 stage III) (Supplementary Materials, available online). The study cohort is similar to the trial cohort, except for a lower proportion of stage II cases and an increase of cases with an RFS event inside this stratum (Supplementary Table 1, available online). We report the results on the 688 cohort (ArrayExpress accession: E-MTAB-990); results on the 580 stage III populations gave identical conclusions (not shown).
Risk Score Computation
We computed the ALM RS (7) exactly and approximative (“a”) versions to the RSs of Genomic Health (aGHS) (9), Veridex (aVDS) (5), and MD Anderson (aMDA) (10) (Table 1). Coefficients (Supplementary Table 2, available online) were set so that higher scores are used for higher risk; more information is given in the Supplementary Methods (available online). The ALM RS was reproduced using the original ADXCRC probe sets and coeffi-cients. For the other RSs, the prefix “a” is used to indicate approxi-mation because the scores were not computed with the original measurement systems. Of the 114 probe sets of the MDA RS, 110 could be mapped to 86 unique entries (Entrez GeneIDs) in the RefSeq database, of which 85 were represented on the ADXCRC platform. For aVDS, no probe set for the CAPG gene was avail-able, and only the remaining six genes were used.
To assess if the information from the RSs could be usefully aggregated, a combined score called CS4 was computed by calcu-lating the rescaled arithmetic average of the scores (median-cen-tered, scaled to interquartile range [IQR] = 1).
Pairwise percentages of agreement between RSs were deter-mined by splitting each RS at its median and counting the pro-portion of patients classified in the same risk group (high or low). Furthermore, in order to have threshold-independent agreement measures, pairwise Spearman correlations were computed.
Statistical Analysis
Analyses were performed using the R software system for statisti-cal computing, version 2.14.0 (22). Associations between clinical outcomes and categorical or continuous variables were computed using Cox proportional hazard regression. The proportionality assumption was verified with plots of Schoenfeld residuals. Hazard ratios (HRs) reported for continuous variables were referred to one
Table 1. Description of the four risk scores analyzed*
Abbreviation
Risk scores
GHS VDS MDA ALM
Developer Genomic Health Veridex MD Anderson ALMAC diagnostics
Type of assay Q-RT-PCR microarray and Q-RT-PCR microarray microarray
Type of tissue FFPE fresh frozen and FFPE fresh frozen FFPE
Main publication O’Connell et al. 2010. Jiang et al. 2008. Oh et al. 2011. Kennedy et al. 2011.
Total number of features 7 7 114 (86 genes) 634 (482 genes)
Features used (genes) 7 6 85 (85 genes) 634 (identical platform)
* ALM = the scoring system proposed by Almac researchers; GHS = scoring system proposed by Genomic Health researchers; FFPE = formalin fixed paraffin embedded; MDA = scoring system proposed by researchers from MD Anderson Cancer Center; Q-RT-PCR = quantitative real-time PCR (Q-RT-PCR); VDS = scoring system proposed by Veridex researchers.
IQR. Confidence intervals and P values for the HR were computed using the Wald test statistic.
Receiver operating characteristic (ROC) curves and area under curve (AUC) values were computed with the “survivalROC” pack-age (23), using prognostic models fitted with Cox regression and the Kaplan–Meier method to fit the joint distribution of RS and time; statistical significance was assessed by permuting the RS across patients to obtain the distribution under the null hypoth-esis of no prognostic information. Harrell’s Concordance Index for censored survival data, the fraction of pairs of patients whose pre-dicted survival times are correctly ordered (24), was computed with “survival” package.
We report single-test two-sided P values, except for the test on increase of AUC, which is one-sided.
results
Gene expression profiles of an independent cohort of 688 stage II/III patients with a median follow-up of 69 months (21) (Supplementary Methods and Supplementary Table 1, available online) were used to test the prognostic value of four proposed risk-scoring methods (Table 1). One reproduced exactly (ALM), three approximately (a-versions of GHS, VDX, MDA).
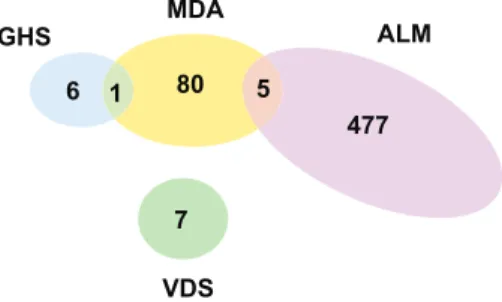
In terms of the genes considered, the four gene signatures had little overlap: five of the 86 genes used by MDA are in the 477-gene ALM signature, and only one is among the seven genes used by GHS (Figure 1). This does not exclude score concordance, if the different gene sets share a similar expression profile.
Prognostic Value of Risk Scores
We first tested the association of each scoring system with out-come (Table 2) using the same survival regression approach as in the previous studies. The assessment was conducted using continu-ous scores, which is preferable for interassay evaluation, rather than the use of arbitrary subgroups, unless the latter are appropriately predefined (25).
In agreement with originally published data, higher values of each RS were associated with shorter survival after diagno-sis (at least overall survival [OS] or RFS), statistically significant (Bonferroni correction for three tested endpoints: P ≤ .05/3 = .0167) (Table 2). The effect sizes were moderate (HR < 1.38 for variation of one IQR). The prognostic value for OS of each RS was only weakly modified in multivariable models, adjusted for the T-stage, N-stage, MSI status, and additional factors (see Table 2). The ALM
score appeared to be the strongest in univariate models (HR = 1.38, 95% confidence interval [CI] = 1.16 to 1.65, P < .001), but lost part of its prognostic value in the multivariable model (HR = 1.22, 95% CI = 1.02 to 1.47, P = .03). Slightly weaker than the others in the univariate model, aVDS was the single RS to lose statistical sig-nificance (P = .07). Survival proportions at three years for low- and high-risk groups obtained by cutting at the median of each RS are given in Table 3, their survival curves in Supplementary Figures 2–4 (available online).
For the prediction of RFS (Table 2), aGHS and ALM had P ≤ .001; aVDS was close (P = .002), which we take as confirming evi-dence for a real association with relapse. These three scores showed similar HRs, close to 1.30 and 95% confidence intervals ranging between 1.10 and 1.60. Adding the ALM score to a set of estab-lished risk factors slightly reduced its prognostic value, probably because of an effect of the inclusion of MSI-H status, with which it is negatively associated (Supplementary Figure 1, available online). In contrast, aMDA was positively associated with MSI-H status; its association with RFS was borderline statistically significant in the univariate and multivariable models in the MSS subpopulation (data not shown), but not in the full cohort.
Uniquely, aMDA was stronger in predicting OS than RFS, and it was the only strong predictor of survival after relapse (SAR) (HR = 1.81, 95% CI = 1.45 to 2.27, P < .001) (Table 2). Multivariable and univariate models for SAR gave similar HR esti-mates (Table 2).
Patient Classification and Improvement on a Reference Clinical Model
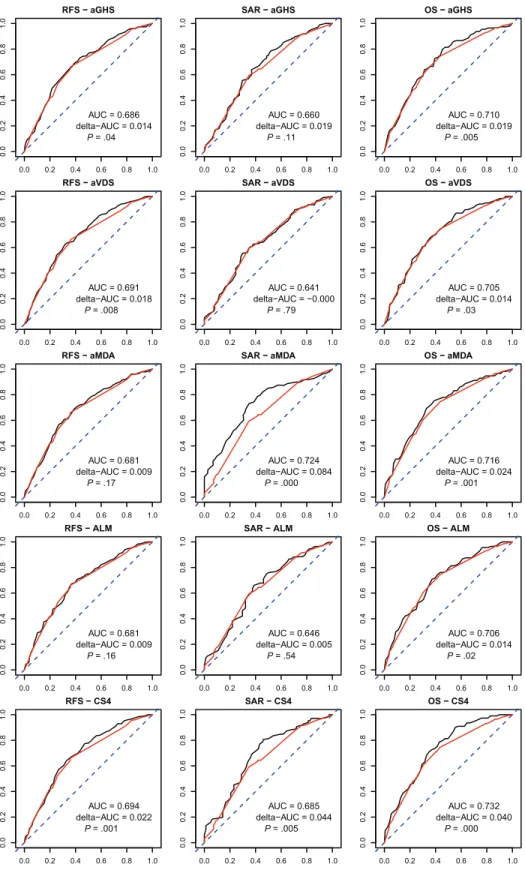
To investigate the ability to risk-classify at the patient level, we cross-classified each RS quartile group with RFS outcome classes, where absence of relapse in five years was considered good and a relapse within three years was considered poor outcome (Table 4). This table shows that 20–30% of the patients considered low risk (lowest quartile) by the scores are relapsing at three years, and, con-versely, 48%-58% of the patients considered at the highest risk of relapse by the scores are relapse free (and probably cured) at five years, when no other risk factors are considered. More important to be useful in clinic, an RS should contribute to better classify patients compared with a survival model based on known risk fac-tors (TNM and MSI status). We evaluated this potential improve-ment in analyzing the AUC of time-dependent ROC curves (23) at three years. The improvement in AUC obtained by adding each RS to a reference model with T-stage, N-stage, and MSI did not exceed 0.025 units (Figure 2; Table 5). While these results depend on the particular time point, they are indicative of the new prog-nostic information that the tested RSs can provide. A time-inde-pendent assessment is provided by Harrell’s concordance index (Supplementary Table 3, available online); tests for an improve-ment in the concordance index were consistent with those for AUC at three years.
Concordance Analysis
Only a small proportion of the total survival variability was explained by the RSs (see R2 statistics, Supplementary Table 4,
available online). This raises the question if the relatively small prognostic information being caught by each RS was the same.
Figure 1. Gene List Overlaps. Venn diagram representing the number of genes unique or in common, among those selected in the original stud-ies for computing the risk scores.
Overall, the RSs concurred poorly. The ALM RS showed very little correlation with any of the other scores. Division of the cohort into equally sized high and low-risk groups (Table 6) resulted in the ALM classification to agree for about 50% of the patients with that of any other signature, as expected by chance for uncor-related classifiers. The highest positive Spearman correlation was
between aGHS and aMDA scores (rho = 0.563, 95% CI = 0.509 to 0.612), with moderate agreement (70.3%). The aVDS score was negatively correlated with the two other scores (particularly with aMDA, Spearman correlation rho = -0.443, 95% CI = -0.501 to -0.381), resulting in agreements of only 33.1% (aMDA) and 37.5% (aGHS).
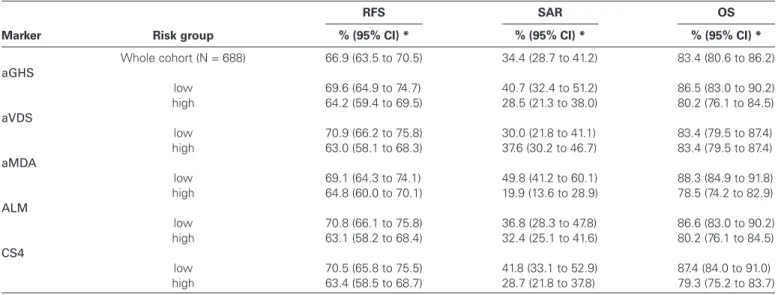
Table 3. Three-year survival
Marker Risk group
RFS SAR OS
% (95% CI) * % (95% CI) * % (95% CI) *
Whole cohort (N = 688) 66.9 (63.5 to 70.5) 34.4 (28.7 to 41.2) 83.4 (80.6 to 86.2) aGHS low 69.6 (64.9 to 74.7) 40.7 (32.4 to 51.2) 86.5 (83.0 to 90.2) high 64.2 (59.4 to 69.5) 28.5 (21.3 to 38.0) 80.2 (76.1 to 84.5) aVDS low 70.9 (66.2 to 75.8) 30.0 (21.8 to 41.1) 83.4 (79.5 to 87.4) high 63.0 (58.1 to 68.3) 37.6 (30.2 to 46.7) 83.4 (79.5 to 87.4) aMDA low 69.1 (64.3 to 74.1) 49.8 (41.2 to 60.1) 88.3 (84.9 to 91.8) high 64.8 (60.0 to 70.1) 19.9 (13.6 to 28.9) 78.5 (74.2 to 82.9) ALM low 70.8 (66.1 to 75.8) 36.8 (28.3 to 47.8) 86.6 (83.0 to 90.2) high 63.1 (58.2 to 68.4) 32.4 (25.1 to 41.6) 80.2 (76.1 to 84.5) CS4 low 70.5 (65.8 to 75.5) 41.8 (33.1 to 52.9) 87.4 (84.0 to 91.0) high 63.4 (58.5 to 68.7) 28.7 (21.8 to 37.8) 79.3 (75.2 to 83.7)
* Estimated proportions of three-year survival (percentage) by the Kaplan-Meier method with 95% confidence intervals for the whole cohort and for risk groups defined by splitting the cohort at the median of each risk score into equally sized subgroups. aGHS = microarray-based approximation of the scoring system proposed by Genomic Health researchers; ALM = the scoring system proposed by Almac researchers; aMDA = approximation of the scoring system proposed by researchers from MD Anderson Cancer Center; aVDS = approximation of the scoring system proposed by Veridex researchers; CI = confidence interval; CS4 = the scoring system obtained by combining the four existing systems; OS = overall survival; RFS = relapse-free survival; SAR = survival after relapse.
Table 2. Cox models estimates
Outcome Marker Univariate* Multivariable*† HR (95% CI) P‡ HR (95% CI) P‡ RFS aGHS 1.33 (1.13 to 1.56) <.001 1.30 (1.11 to 1.53) .001 aVDS 1.29 (1.10 to 1.52) .002 1.27 (1.07 to 1.51) .007 aMDA 1.10 (0.93 to 1.30) .26 1.13 (0.93 to 1.37) .22 ALM 1.31 (1.13 to 1.53) <.001 1.20 (1.02 to 1.40) .03 CS4§ 1.56 (1.33 to 1.84) <.001 1.45 (1.23 to 1.71) <.001 SAR aGHS 1.16 (0.95 to 1.43) .14 1.16 (0.92 to 1.46) .20 aVDS 0.90 (0.72 to 1.13) .38 0.84 (0.66 to 1.08) .17 aMDA 1.81 (1.45 to 2.27) <.001 1.89 (1.46 to 2.46) <.001 ALM 1.19 (0.97 to 1.47) .10 1.10 (0.88 to 1.36) .40 CS4§ 1.46 (1.18 to 1.82) <.001 1.33 (1.05 to 1.67) .017 OS aGHS 1.36 (1.13 to 1.64) .001 1.34 (1.10 to 1.62) .003 aVDS 1.24 (1.03 to 1.50) .02 1.21 (0.99 to 1.48) .07 aMDA 1.31 (1.08 to 1.58) .006 1.37 (1.09 to 1.71) .007 ALM 1.38 (1.16 to 1.65) <.001 1.22 (1.02 to 1.47) .03 CS4§ 1.74 (1.44 to 2.10) <.001 1.57 (1.29 to 1.91) <.001
* Cox proportional hazards regression models were used to estimate hazard ratios for one interquartile range variation of the continuous risk scores; no stratification was applied; adjustment by treatment was applied only in the multivariable models. aGHS = microarray-based approximation of the scoring system proposed by Genomic Health researchers; ALM = the scoring system proposed by Almac researchers; aMDA = approximation of the scoring system proposed by researchers from MD Anderson Cancer Center; aVDS = approximation of the scoring system proposed by Veridex researchers; CI = confidence interval; CS4 = the scoring system obtained by combining the four existing systems; HR = hazard ratio; OS = overall survival; RFS = relapse-free survival; SAR = survival after relapse. † Each multivariable model included one gene expression risk score and the following variables: age, gender, TNM staging (T-stage, N-stage) (27), grade, location
(right = proximal, left = distal), treatment arm, presence of lymphovascular invasion, and microsatellite instability (MSI) status.
‡ Shown are single-test P values. The statistical significance cutoff by the Bonferroni principle (considering three tests) is at 0.05/3 = 0.0167. § CS4 is a combined score obtained by averaging the four original risk scores.
Combined Risk Score
Given that the four scores define different prognostic information, we tested if they could be combined. Interestingly, a combination score (CS4, the average of the four RSs) was more strongly associ-ated with RFS and OS than each individual score in the regres-sion models (HR = 1.74, 95% CI = 1.44 to 2.10 for OS, P < .001; HR = 1.56, 95%CI = 1.33 to 1.84 for RFS, P < .001; similar HRs in the multivariable models) (Table 2), and CS4 also contributed a stronger but still moderate AUC improvement to the reference model for RFS (0.6723 to 0.6945) and OS (0.6918 to 0.7321) (Table 5). CS4 showed a weaker association with the SAR endpoint than MDA, but still statistically significant.
Discussion
We assessed the prognostic information content of four RSs in a uniform setting (same data, same technical platform) and in an independent patient cohort. Routine application of an RS would likely be on FFPE material, as in this study. The PETACC-3 tissue samples originate from a large number of pathology departments, each with their own variations in tissue processing—which closely imitate a routine clinical setting. In this setting, the RSs improved prognostic models containing standard risk factors for at least one endpoint, both in a regression analysis and in an ROC-AUC analy-sis. This confirms their potential relevance for clinical application. The small improvements contributed to a model with known risk factors question, though, if the RSs can be of high relevance.
The discordance we observed suggests that the four RSs use genes representing different risk-associated molecular motifs identifying different subsets of patients with increased risk. The simplest combination, the average of the four scores (CS4), is prognostic for all three endpoints and the strongest for both RFS and OS. The lack of convergence between the RSs might appear surprising at first, considering that ALM, GHS, and VDS selected genes following a similar strategy. Several reasons suggest why sim-ilar RS studies can result in such discordant gene sets. First, even in relatively large studies like GHS, the measures of association of gene expression levels with survival based on regression models are not precise enough to allow for a definitive ranking of the many genes in the human genome (26). Unstable risk ranking causes differences in selected genes, even if the study design is identical. The MDA RS is the only one that was derived from a population including stage IV patients. Likely, it is driven by pathways that are associated with malignant progression and treatment resistance of metastatic lesions rather than the development of metastases from a primary tumor site, and these pathways are different. This might be one reason why MDA was the only of four RSs predicting statis-tically significantly SAR.
For RFS and SAR it might not be possible to find a unique opti-mal RS, and for OS one might need to combine scores that use dif-ferent genes. The CS4 takes a step in that direction and performs better than each of the four RSs for OS.
This study has some limitations. A question is whether or not the approximations we used for aGHS, aVDS, and aMDA might
Table 4. Concordance by risk score and endpoint groups*
Scoring method Risk score subgroup
Actual survival group
Poor Good Rest
aGHS Q1 46 (26.7%) 116 (67.4%) 10 (5.8%) Q2 58 (33.7%) 103 (59.9%) 11 (6.4%) Q3 54 (31.4%) 105 (61.0%) 13 (7.5%) Q4 69 (40.1%) 84 (48.8%) 19 (11.1%) aVDS Q1 40 (23.3%) 117 (68.0%) 15 (8.7%) Q2 60 (34.9%) 101 (58.7%) 11 (6.4%) Q3 63 (36.6%) 96 (55.8%) 13 (7.5%) Q4 64 (37.2%) 94 (54.7%) 14 (8.2%) aMDA Q1 51 (29.7%) 109 (63.4%) 12 (7.0%) Q2 55 (32.0%) 100 (58.1%) 17 (9.9%) Q3 62 (36.0%) 100 (58.1%) 10 (5.9%) Q4 59 (34.3%) 99 (57.6%) 14 (8.1%) ALM Q1 50 (29.1%) 110 (64.0%) 12 (7.0%) Q2 50 (29.1%) 109 (63.4%) 13 (7.6%) Q3 54 (31.4%) 103 (59.9%) 15 (8.7%) Q4 73 (42.4%) 86 (50.0%) 13 (7.5%) CS4 Q1 36 (20.9%) 123 (71.5%) 13 (7.6%) Q2 65 (37.8%) 100 (58.1%) 7 (4.1%) Q3 57 (33.1%) 100 (58.1%) 15 (8.7%) Q4 69 (40.1%) 85 (49.4%) 18 (10.4%)
* Patients were classified into four equally sized risk-score quartile subgroups (Q1: lowest predicted relapse risk, Q4: highest predicted relapse risk) and into actual survival groups (good: follow-up without relapse for at least five years; poor: relapse in the first three years; rest: otherwise (relapse between three and five years or censoring before five years without event). aGHS = microarray-based approximation of the scoring system proposed by Genomic Health researchers; ALM = the scoring system proposed by Almac researchers; aMDA = approximation of the scoring system proposed by researchers from MD Anderson Cancer Center; aVDS = approximation of the scoring system proposed by Veridex researchers; CS4 = the scoring system obtained by combining the four existing systems.
have altered the sense of the RSs. An alteration could be because of diverse factors: gene expression was measured with microarrays (GHS: by RT-PCR) from FFPE material (MDA: fresh-frozen),
and not all genes were available (VDA: 6/7, MDA: 85/86, see Methods). Moreover, the cohort is mostly a stage III European CC population selected to undergo chemotherapy. For aGHS, the
RFS − aGHS 0.0 0.2 0.4 0.6 0.8 1.0 0. 00 .2 0. 40 .6 0. 81 .0 AUC = 0.686 delta−AUC = 0.014 P = .04 SAR − aGHS 0.0 0.2 0.4 0.6 0.8 1.0 0. 00 .2 0. 40 .6 0. 81 .0 AUC = 0.660 delta−AUC = 0.019 P = .11 OS − aGHS 0.0 0.2 0.4 0.6 0.8 1.0 0. 00 .2 0. 40 .6 0. 81 .0 AUC = 0.710 delta−AUC = 0.019 P = .005 RFS − aVDS 0.0 0.2 0.4 0.6 0.8 1.0 0. 00 .2 0. 40 .6 0. 81 .0 AUC = 0.691 delta−AUC = 0.018 P = .008 SAR − aVDS 0.0 0.2 0.4 0.6 0.8 1.0 0. 00 .2 0. 40 .6 0. 81 .0 AUC = 0.641 delta−AUC = −0.000 P = .79 OS − aVDS 0.0 0.2 0.4 0.6 0.8 1.0 0. 00 .2 0. 40 .6 0. 81 .0 AUC = 0.705 delta−AUC = 0.014 P = .03 RFS − aMDA 0.0 0.2 0.4 0.6 0.8 1.0 0.0 0.2 0.4 0. 60 .8 1.0 AUC = 0.681 delta−AUC = 0.009 P = .17 SAR − aMDA 0.0 0.2 0.4 0.6 0.8 1.0 0. 00 .2 0. 40 .6 0. 81 .0 AUC = 0.724 delta−AUC = 0.084 P = .000 OS − aMDA 0.0 0.2 0.4 0.6 0.8 1.0 0. 00 .2 0. 40 .6 0. 81 .0 AUC = 0.716 delta−AUC = 0.024 P = .001 RFS − ALM 0.0 0.2 0.4 0.6 0.8 1.0 0.0 0. 20 .4 0.6 0.8 1.0 AUC = 0.681 delta−AUC = 0.009 P = .16 SAR − ALM 0.0 0.2 0.4 0.6 0.8 1.0 0.0 0. 20 .4 0. 60 .8 1.0 AUC = 0.646 delta−AUC = 0.005 P = .54 OS − ALM 0.0 0.2 0.4 0.6 0.8 1.0 0. 00 .2 0. 40 .6 0. 81 .0 AUC = 0.706 delta−AUC = 0.014 P = .02 RFS − CS4 0.0 0.2 0.4 0.6 0.8 1.0 0. 00 .2 0.4 0.6 0. 81 .0 AUC = 0.694 delta−AUC = 0.022 P = .001 SAR − CS4 0.0 0.2 0.4 0.6 0.8 1.0 0. 00 .2 0.4 0.6 0. 81 .0 AUC = 0.685 delta−AUC = 0.044 P = .005 OS − CS4 0.0 0.2 0.4 0.6 0.8 1.0 0. 00 .2 0. 40 .6 0. 81 .0 AUC = 0.732 delta−AUC = 0.040 P = .000
Figure 2. Receiver operating characteristic (ROC) curves and area under curve (AUC) values. Time-dependent ROC curves and AUC values were computed at t = 3 years for a reference prognostic model based on known risk factors (red) and with the addition of the indicated risk scores (black), for the three endpoints: overall survival (OS), relapse-free sur-vival (RFS), and sursur-vival after relapse (SAR). The factors included in the
reference model were T-stage ((T1 or T2)-T3-T4), N-stage (N0-N1-N2), and MSI-status. Indicated are the AUC value of the reference model and the increment in AUC (delta-AUC), obtained by adding the risk score (see also Table 5). The P value was computed with a permutation test for the null of hypothesis of no increment in AUC when adding the risk score (one-sided test).
biological function of the genes is well documented, and, in our microarray profiles, the genes most positively correlated with the risk score (“stroma-EMT”) and those most negatively correlated
(proliferation genes) were the same, suggesting that the original GHS would rank the patients in a very similar way as aGHS. For large gene sets (ALM, aMDA), it is unlikely that the relative scor-ing of patients would be sensitive to the technology used; for aVDS (six out of seven genes), this is less obvious.
The prognostic effects we found for aGHS in the survival regression model are similar to those observed in the large valida-tion study based on patients in the QUASAR trial (15). The stand-ardized HRs for RFS were in close agreement (univariate HR per IQR = 1.38, 95% CI = 1.11 to 1.74), suggesting that the difference in technology did not markedly impact the estimated prognostic value. In the study of Gray (15), the reported HR for GHS was determined in a cohort of stage II patients that underwent surgery without chemotherapy. The HR estimated in the patient group randomized to fluorouracil/folinic acid was similar. The pooled estimate (HR per IQR = 1.29, 95% CI = 1.09 to 1.52) was very close to what we report here (HR per IQR = 1.30, 95% CI = 1.11 to 1.53). This suggests a similar prognostic value in cohorts with or without 5-FU based chemotherapy. We contend that our results are relevant for assessing the state of research in prognostic gene-expression signatures for the typical CC population.
Note that we report statistical significance without full adjust-ment for multiple testing; we proceeded as if each RS would be tested by itself. Under the hypothesis that no RS has association with outcome, there is therefore in this study a higher risk to be wrongly reporting at least one statistically significant association (type I error). Since each RS had previously passed a test of statisti-cal significance in the original study, we found this preferable to a more stringent statistical cutoff that would raise the risk of false negative conclusions (type II error).
In summary, we tested the prognostic value of four RSs on micro-array gene expression data from routinely collected FFPE material. We found that they are associated with survival endpoints but that they are discordant and seem to add little to risk models with known risk factors. The good performance of CS4 suggest that there might still be more information in gene expression profiles than is being extracted by the four RSs tested here, and future work and larger datasets might allow finding a stronger prognostic signature in CC.
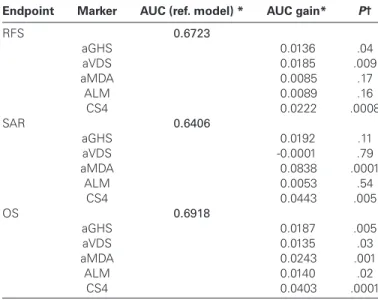
Table 5. Time-dependent receiver operating characteristic curves,
area under curve (time = 3 years) by endpoint and risk score
Endpoint Marker AUC (ref. model) * AUC gain* P†
RFS 0.6723 aGHS 0.0136 .04 aVDS 0.0185 .009 aMDA 0.0085 .17 ALM 0.0089 .16 CS4 0.0222 .0008 SAR 0.6406 aGHS 0.0192 .11 aVDS -0.0001 .79 aMDA 0.0838 .0001 ALM 0.0053 .54 CS4 0.0443 .005 OS 0.6918 aGHS 0.0187 .005 aVDS 0.0135 .03 aMDA 0.0243 .001 ALM 0.0140 .02 CS4 0.0403 .0001
* Area under curve (AUC) for predicting survival status at three years was computed by risk scoring methods and endpoint. A reference model was fitted using the predictor variables N-stage, T-stage, and MSI status. The AUC gain was computed by adding the gene expression risk score to the predictor variables in the model. aGHS = microarray-based approximation of the scoring system proposed by Genomic Health researchers; ALM = the scoring system proposed by Almac researchers; aMDA = approximation of the scoring system proposed by researchers from MD Anderson Cancer Center; AUC = area under curve; aVDS = approximation of the scoring system proposed by Veridex researchers; CS4 = the scoring system obtained by combining the four existing systems; OS = overall survival; RFS = relapse-free survival; SAR = survival after relapse.
† Statistical significance against the null hypothesis of no increase was determined by the permutation method. By construction, the minimal P value that can be reached is .0001 (bold), as they were based on 10’000 permutations, and estimated as: (#(permuted deltaAUCs > observed deltaAUC) + 1) / (# permutations + 1); this is by definition a one-sided test, as the model can only improve when adding the RS.
Table 6. Pairwise agreements and correlations between risk scores
aGHS (95% CI) aVDS (95% CI) aMDA (95% CI) ALM (95% CI) CS4 (95% CI)
aGHS -0.318* 0.563 0.187 0.662 (-0.383 to -0.249) (0.509 to 0.612) (0.114 to 0.258) (0.618 to 0.702) aVDS 37.5%† -0.443 0.071 0.145 (33.9% to 41.3%) (-0.501 to -0.381) (-0.004 to 0.145) (0.071 to 0.218) aMDA 70.3% 33.1% 0.125 0.573 (66.8% to 73.7%) (29.7% to 36.8%) (0.050 to 0.197) (0.521 to 0.621) ALM 57.8% 49.1% 54.1% 0.652 (54.1% to 61.6%) (45.3% to 52.9%) (50.3% to 57.8%) (0.607 to 0.693) CS4 75.3% 52.9% 70.1% 72.4% (71.9% to 78.4%) (49.1% to 56.7%) (66.5% to 73.4%) (68.9% to 75.7%)
* Above the diagonal, pairwise Spearman correlations between the continuous risk scores, with 95% confidence intervals in parentheses. aGHS = microarray-based approximation of the scoring system proposed by Genomic Health researchers; ALM = the scoring system proposed by Almac researchers; aMDA = approximation of the scoring system proposed by researchers from MD Anderson Cancer Center; aVDS = approximation of the scoring system proposed by Veridex researchers; CI = confidence interval; CS4 = the scoring system obtained by combining the four existing systems.
† Below the diagonal, pairwise percentage of agreement between risk scores, as given by splitting the continuous scores at their medians, with 95% confidence intervals in parentheses.
references
1. Benson AB 3rd, Schrag D, Somerfield MR, et al. American Society of Clinical Oncology recommendations on adjuvant chemotherapy for stage II colon cancer. J Clin Oncol. 2004;22(16):3408–3419.
2. Arango D, Laiho P, Kokko A, et al. Gene-expression profiling predicts recur-rence in Dukes’ C colorectal cancer. Gastroenterology. 2005;129(3):874–884. 3. Barrier A, Boelle PY, Roser F, et al. Stage II colon cancer prog-nosis prediction by tumor gene expression profiling. J Clin Oncol. 2006;24(29):4685–4691.
4. Eschrich S, Yang I, Bloom G, et al. Molecular staging for survival predic-tion of colorectal cancer patients. J Clin Oncol. 2005;23(15):3526–3535. 5. Jiang Y, Casey G, Lavery IC, et al. Development of a clinically feasible
molecular assay to predict recurrence of stage II colon cancer. J Mol Diagn. 2008;10(4):346–354.
6. Jorissen RN, Gibbs P, Christie M, et al. Metastasis-Associated Gene Expression Changes Predict Poor Outcomes in Patients with Dukes Stage B and C Colorectal Cancer. Clin Cancer Res. 2009;15(24):7642–7651.
7. Kennedy RD, Bylesjo M, Kerr P, et al. Development and independent vali-dation of a prognostic assay for stage II colon cancer using formalin-fixed paraffin-embedded tissue. J Clin Oncol. 2011;29(35):4620–4626.
8. Lin YH, Friederichs J, Black MA, et al. Multiple gene expression classifiers from different array platforms predict poor prognosis of colorectal cancer. Clin Cancer Res. 2007;13(2 Pt 1):498–507.
9. O’Connell MJ, Lavery I, Yothers G, et al. Relationship between tumor gene expression and recurrence in four independent studies of patients with stage II/III colon cancer treated with surgery alone or surgery plus adjuvant fluorouracil plus leucovorin. J Clin Oncol. 2010;28(25):3937–3944.
10. Oh SC, Park YY, Park ES, et al. Prognostic gene expression signature associated with two molecularly distinct subtypes of colorectal cancer. Gut. 2012;61(9):1291–1298.
11. Salazar R, Roepman P, Capella G, et al. Gene expression signature to improve prognosis prediction of stage II and III colorectal cancer. J Clin Oncol. 2011;29(1):17–24.
12. Wang Y, Jatkoe T, Zhang Y, et al. Gene expression profiles and molecu-lar markers to predict recurrence of Dukes’ B colon cancer. J Clin Oncol. 2004;22(9):1564–1571.
13. Ransohoff DF. Rules of evidence for cancer molecular-marker discovery and validation. Nat Rev Cancer. 2004;4(4):309–314.
14. Fan C, Oh DS, Wessels L, et al. Concordance among gene-expression-based predictors for breast cancer. N Engl J Med. 2006;355(6):560–569. 15. Gray RG, Quirke P, Handley K, et al. Validation study of a quantitative
multigene reverse transcriptase-polymerase chain reaction assay for assess-ment of recurrence risk in patients with stage II colon cancer. J Clin Oncol. 2011;29(35):4611–4619.
16. Venook AP, Niedzwiecki D, Lopatin M, et al. Biologic determinants of tumor recurrence in stage II colon cancer: validation study of the 12-gene recurrence score in cancer and leukemia group B (CALGB) 9581. J Clin Oncol. 2013;31(14):1775–1781.
17. Van Cutsem E, Labianca R, Bodoky G, et al. Randomized phase III trial comparing biweekly infusional fluorouracil/leucovorin alone or with irinotecan in the adjuvant treatment of stage III colon cancer: PETACC-3. J Clin Oncol. 2009;27(19):3117–3125.
18. Roth AD, Tejpar S, Delorenzi M, et al. Prognostic role of KRAS and BRAF in stage II and III resected colon cancer: results of the translational study on the PETACC-3, EORTC 40993, SAKK 60-00 trial. J Clin Oncol. 2010;28(3):466–474.
19. Bosman FT, Yan P, Tejpar S, et al. Tissue biomarker development in a multicentre trial context: a feasibility study on the PETACC3 stage II and III colon cancer adjuvant treatment trial. Clin Cancer Res. 2009;15(17):5528–5533.
20. Roth AD, Delorenzi M, Tejpar S, et al. Integrated analysis of molecular and clinical prognostic factors in stage II/III colon cancer. J Natl Cancer Inst. 2012;104(21):1635–1646.
21. Popovici V, Budinska E, Tejpar S, et al. Identification of a poor-prognosis BRAF-mutant-like population of patients with colon cancer. J Clin Oncol. 2012;30(12):1288–1295.
22. R-Development-Core-Team. R: A Language and Environment for Statistical Computing. Vienna, Austria: R Foundation for Statistical Computing; 2010. 23. Heagerty PJ, Lumley T, Pepe MS. Time-dependent ROC curves for cen-sored survival data and a diagnostic marker. Biometrics. 2000;56(2):337–344. 24. Harrell FE Jr, Lee KL, Mark DB. Multivariable prognostic models: issues
in developing models, evaluating assumptions and adequacy, and measur-ing and reducmeasur-ing errors. Stat Med. 1996;15(4):361–387.
25. Royston P, Altman DG, Sauerbrei W. Dichotomizing continuous predic-tors in multiple regression: a bad idea. Stat Med. 2006;25(1):127–141. 26. Ein-Dor L, Zuk O, Domany E. Thousands of samples are needed to
gener-ate a robust gene list for predicting outcome in cancer. Proc Natl Acad Sci U S A. 2006;103(15):5923–5928.
27. Gunderson LL, Jessup JM, Sargent DJ, et al. Revised TN categorization for colon cancer based on national survival outcomes data. J Clin Oncol. 2010;28(2):264–271.
Funding
The PETACC-3 trial and its translational research program are conducted in col-laboration with the European Organization for Research and Treatment of Cancer (EORTC #40993), the Swiss Group for Clinical Cancer Research (SAKK 60/00), and the SIB Swiss Institute of Bioinformatics (SIB). This work was supported by the grants SNF 320030_135421 of the Swiss National Science Foundation and KFS 0269708-2010 of the Krebsliga Schweiz to AR and MD and by the EU Seventh Framework Programme, grant agreement 259015 COLTHERES to MD. We thank the Fondation Medic for financial support. VP and PW were supported by the NCCR Molecular Oncology program of the Swiss National Science Foundation. ST is senior investigator of the fund for Scientific Research-Flanders, Belgium (Fonds Wetenschappelijk Onderzoek-Vlaanderen). We thank all the clinicians who enrolled patients and participated in the PETACC-3 trial (see Appendix at: http://jco.ascopubs.org/content/27/19/3117.long)
Notes
The study sponsors had no role in the design of the study, the collection, analysis, or interpretation of the data, the writing of the manuscript, nor the decision to submit the manuscript for publication.
The authors declare the following COIs:
Pratyaksha Wirapati: grants/grants pending or Contracts, Novartis AG to institution, which and pays part of his salary. Heather Estrella: employment at Pfizer and is currently employed by Regulus Therapeutics. Adam Pavlicek: was an employee at Pfizer during the time of this study. Mao Mao: owns stock/ stock options at Pfizer. Eric Santos Martin: was an employee at Pfizer during the time of this study. Scott Weinrich: employee at Pfizer and is s stock holder. Fred T. Bosman: Is a consultant for Amgen. Arnaud Roth: Is a consultant for Pfizer. Mauro Delorenzi: Grants/grants pending or contract from Novartis AG to insti-tution, which pays part of Dr. Wirapati’s salary.
Affiliations of authors: SIB Swiss Institute of Bioinformatics, Lausanne, Switzerland (AFDN, SR, VP, PW, EB, MD); Digestive Oncology Unit and Center for Human Genetics, University Hospital Gasthuisberg, Leuven, Belgium (ST); Department of Pathology, Lausanne University, Lausanne, Switzerland (PY, FB); Oncology Research Unit , Worldwide Research and Development, Pfizer Inc., La Jolla, CA (TX, HE, AP, MM, EM, WS); Oncosurgery, Geneva University Hospital Geneva, Switzerland (AR); SAKK Coordination Center, Bern, Switzerland (AR); Ludwig Center for Cancer Research (MD) and Oncology Department, University of Lausanne, Lausanne, Switzerland (MD).