Spatial and Temporal Variation in Abundance of Anopheles
(Diptera: Culicidae) in a Malaria Endemic Area in
Papua New Guinea
J.L.K. H I I ,1 2 T. SMITH,1-3 A. MAI,1 S. MELLOR,1 D. LEWIS, *• 4 N. ALEXANDER,1 AND M. P. ALPERS1
J. Med. Entomol. 34(2): 193-205 (1997)
ABSTRACT Abundance of anophelines in 10 villages in the Wosera area of Papua New Guinea was monitored during 1990-1993. Of 85,197 anophelines collected in 1,276 paired indoor and outdoor landing catches, 40.4% were Anopheles koliensis Owen, 36.7% An. punc-tulatus Donitz, 14.3% Art. karwari (James), 4.9% An. farauti s.l. Laveran, 3.1% An. longirostris Brug, and 0.7% An. bancroftii Giles. Maps of average indoor biting rates were produced using a Bayesian conditional autoregressive model which allowed for heterogeneities in sampling effort over time and space. Differences in spatial distributions among species were observed among and within villages and were related to the distribution of larval habitats and vegetation. Abundance of An. punctulatus and An. koliensis decreased with distance from the main wa-terway and probably from a sago swamp forest at 6 villages in North Wosera. Abundance of An. punctulatus was associated negatively with those of An. farauti s.l., An. longirostris, and An. bancroftii. The latter 3 species also had relatively low ratios of indoor-to-outdoor biting rates, and earlier biting times than An. punctulatus. Human blood indices of at least 0.79 were observed for all species except An. bancroftii. Abundance of all 6 species was correlated temporally with recent rainfall, but An. koliensis, An. kanvari, and An. longirostris showed greater temporal variability than the other species. An. punctulatus and An. koliensis tended to occur together in time and space (index of association, / = 0.85). Weaker associations were seen between An. farauti s.l. and An. longirostris (I = 0.44) and An. koliensis and An. kanvari (I = 0.34). The most frequently collected species occurred together and were concentrated near the Amugu river; the remaining species tended to occur together but in different parts of the Wosera area. The importance of understanding ecological requirements of the different Anopheles vectors and their association with key household and landscape features are dis-cussed in relation to malaria transmission and control.
KEY WORDS Anopheles spp., ecology, biting cycles, conditional autoregressive model, spa-tial analysis, malaria
MALARIA OCCURS THROUGHOUT the coastal low- ical studies in preparation for vaccine trials (Alpers lands of Papua New Guinea but has been most et al. 1992, Genton et al. 1995), but the ecology of intensively studied in Madang and East Sepik Anopheles spp. has not been studied since a pilot Provinces near the north coast. The Madang area DDT trial during 1958-1959 (Peters 1960a, b; Pe-is highly endemic for both Plasmodium falciparum ters and Standfast 1960).
and P. vivax (Cattani et al. 1986a). In the Wosera The anopheline situation in Papua New Guinea area of East Sepik province, P. malariae also is fre- is complex, both taxonomically and ecologically, quently encountered (Genton et al. 1995). Exten- The main vectors are members of the Anopheles sive entomological studies in preparation for ma- punctulatus complex. Recent allozyme studies laria vaccine trials have been carried out near h a v e s h o w n A a t ^e r e a r e a t l e a s t 6 i e s^ j ^ Madang (Burkot et al. 1987, 1988b). The Wosera ^ i n p N e w G u i n e a ( F o l e t a l area also has been the site of recent epidemiolog- 1 9 9 3 ) i n c l u d i n g A n. vunctulatus s.s. Donitz, An.
koliensis Owen, and 4 sibling species of An. farauti 'Papua New Guinea Institute of Medical Research, P.O. Box Laveran S.l. The 2 former species and at least 1 378 Madang, Papua New Guinea. member of the An. farauti complex are important
-Department of Public Health and Tropical Medicine, James •> * L r
Cook University, Townsville, Queensland 4811, Australia. malaria vectors in Papua New Guinea (Burkot et 3Current address: Department of Public Health and Epidemi- al. 1988b). Two more species with distributions ology, Swiss Tropical institute, Socinstrasse 57, Postfach CH-4002, c e n t er i n g around N e w Guinea have been
consid-Basel, Switzerland. , . °, . . , _, , /•tn,nc\\ J
Southern Zone Population Health Unit, Brisbane, Queensland, e r e d t o b e m m o r vectors—de Rook (1929) and Australia. Metselaar (1957) found low infection rates in An.
bancroftii Giles, and An. longirostris Brug was
sus-pected to be a minor vector by Peters (1965). The latter species feeds predominantly on pigs (Charl-wood et al. 1985) in the Madang area, but there may be several sibling species (D.H. Foley, per-sonal communication) with different ecologies. In addition, An. karwari and An. subpictus, 2 second-ary malaria vectors whose distribution centers on the Indian subcontinent, have been found locally in Papua New Guinea (Peters and Christian 1963, Lee et al. 1987).
Variation in vector ecology is one of the most important factors affecting heterogeneity in the microepidemiology of malaria (Greenwood 1989). Both in the Western Province of Papua New Guin-ea (Nakazawa et al. 1994), and nGuin-ear Madang (Bur-kot et al. 1987, 1988b; Cattani et al. 1986b; Charl-wood et al. 1983, 1986), considerable spatial variation in levels of malaria endemicity, transmis-sion rates, and mosquito abundance and survival rates have been found, even between villages with-in a few kilometers of each other. The known ma-laria vectors near Madang are An. punctulatus, An.
koliensis, and An. farauti No. 1. The latter is 1 of
the 6 sibling species within the An. farauti complex and has been given the non-Iinnean designation (Foley et al. 1993). An. punctulatus larvae occur in small sunlit bodies of water and are distributed widely around Madang (Charlwood et al. 1986), whereas An. koliensis breeds in semipermanent habitats at forest margins (Belkin 1962) and has a more focal distribution (Charlwood et al. 1986).
An. farauti No. 1 favors brackish water and streams
in lowland coastal areas.
Rainfall is spread relatively evenly throughout the year in most of Papua New Guinea, so that there is no season without any mosquitoes and densities can reach very high levels (Spencer 1970, Affifi et al. 1980). However, patterns of seasonally differ among mosquito species (Burkot et al. 1988b), and this may be important in the epide-miology of malaria because of the interspecific variation in transmission potential. For instance, in the Madang area, the peak abundance of An.
far-auti No. 1 occurs at the end of the dry season,
when the larvae are less likely to be flushed out of riparian breeding sites (Charlwood et al. 1986).
Small-area variations in contact rates between mosquitoes and man may have a profound effect on the true vector potential of a mosquito popu-lation (Dye and Hasibeder 1986) and on the im-munological responses in the host population (For-syth et al. 1989). Limited mixing of mosquito populations between villages also tends to perpet-uate heterogeneities in transmission of plasmodial parasites (Charlwood et al. 1988).
Tto determine whether the pattern of small-area variation near Madang was reproduced elsewhere in Papua New Guinea, we studied the extent and scale of spatial and temporal heterogeneity in the anopheline populations in the Wosera area. Peters and Standfast (1960) found that An. punctulatus
was the primary vector throughout the year, with lower densities of An farauti s.l. and An. koliensis, but did not carry out detailed studies of small-area variation. Using a Bayesian model of spatial and temporal variability developed in analyses of ma-laria vectors in Tanzania (Smith et al. 1995), we estimated how abundance of An. punctulatus com-plex mosquitoes and 3 other anophelines varied geographically during a 34-mo period in 10 Wosera villages. We then attempted to relate the different spatial and temporal patterns observed for differ-ent anophelines to their ecology and to consider the implications for malaria transmission.
Materials and Methods
Study Site. The study was carried out as part of
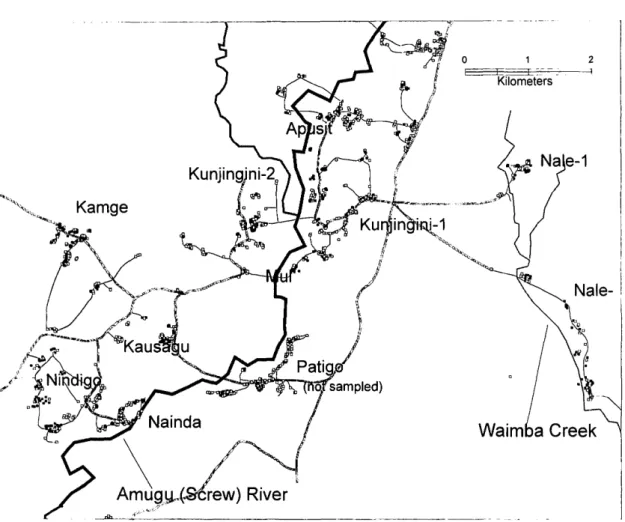
the Papua New Guinea Malaria Vaccine Epide-miology and Evaluation Project (Alpers et al. 1992) in the Wosera area (143° E, 52' S) of East Sepik Province (Fig. 1). The area is divided into 2 census divisions, North and South Wosera, comprising 469 and 333 km2, respectively. Its major feature is the Amugu (Screw) River, a permanent stream of greatly variable discharge arising in mountains to the north. The altitude is ^lSO m above sea level. The climate is wet tropical (Genton et al. 1995) with a mean annual rainfall of 1,847 mm during 1990-1993 (range, 1,759-1,936 mm). Approxi-mately 58-65% of annual precipitation falls during the wet season (October-April); the dry season oc-curs from May to September.
All villages and hamlets were accessible by dirt roads and footpaths. Village populations ranged from 100 to 800 residents and were subdivided into geographically distinct hamlets. Traditional Wosera houses consist of a timber frame (inverted V) covered with sago leaf roofs that reach the ground. More recently, houses with elevated floors, corrugated iron roofing, and walls of split bamboo or sago palm stems have appeared.
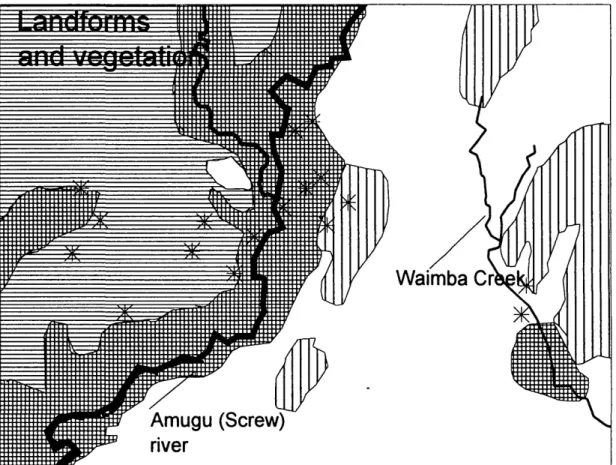
House positions were recorded using a hand-held global positioning system (GPS) device (Trim-ble Navigational Europe, London). The resulting map was validated against sketch maps of the vil-lage. The heights of houses and other architectural features also were recorded in annual surveys of the village. The software system Maplnfo (Map-Info 1990) was used to compile a digitized map using the coordinates collected with the GPS sys-tem, showing the houses sampled, roads, rivers, creeks, potential Anopheles breeding sites, and other landscape features. Numerous seasonal streams exist throughout the area and their flow corresponds with periods of heavy rainfall, usually from October through April. The central part of the study area consisted of the flood plain of the Screw River and its tributaries (Fig. 2). Most of the land is mixed regrowth with patches of sago palm, Metroxylon sagu, swamp (Haanjens et al. 1968). Allen et al. (1993) distinguished 2 agricul-tural systems in use. Apusit, Kunjinigini-1,
Nindi-March 1997 Hn ET AL.: VARIATION IN Anopheles ABUNDANCE IN PAPUA NEW GUINEA 195
Amugy^S'erew) River
Fig. 1. Map of VVosera area, showing sampled (filled boxes) and unsampled (open boxes) houses, all-weather roads
(---), footpaths ( ), Amugu (Screw) River, and Waimba creek.
go, Kausagu, and Nainda form part of the most intensively cultivated area in East Sepik Province and depend on silt from river floods to sustain fer-tility with a short fallow period. Yams, Dioscorea
escidenta, were the most important crop, but
planted sago and taro, Colocasia esculenta, also are important. In Mul, Kunjingini-2, and Kamge, where there is less silt from river flooding, land use is less intensive, with a longer period of re-growth.
Much of Nale village (comprising Nale-1 and Nale-2), which is separated from the rest of the study area by a wide plain, is dominated by
Im-perata spp. grassland or kunai. In Nale, the forest
is cultivated less intensively than in the valley of the Amugu (Screw) River, and gardens extend into the neighboring grasslands.
Sampling of Anophelines. In June 1990, 7
vil-lages (Apusit, Kunjingini-1, Nale-1, Nale-2, Kun-jingini-2, Mul, Kamge) in North Wosera and 3 vil-lages (Kausagu, Nindigo, Nainda) in South Wosera were selected for entomological monitoring. Sam-pling of Nale-2 and Mul commenced in October 1991 and February 1992, respectively; sampling of Nainda was suspended temporarily during
Febru-ary-August 1992; sampling ceased on September 1993. All-night human landing collections were made monthly in these villages by resident adults who gave informed consent after receiving consent protocols and verbal explanations in Neo-Melane-sian language on the rationale and purpose of en-tomological monitoring, including possible haz-ards. Ethical guidelines of the Papua New Guinea Medical Research Council were followed. Each of the 8 villages were divided geographically into 5 sectors (A-E), whereas Kamge and Nainda were divided into 6 sectors (A-F). Within each sector, a random individual was selected each month, and the house inhabited by that individual was, where possible, sampled for mosquitoes. The different sectors were sampled on 5 consecutive nights; sec-tors E and F were sampled concurrently on the 5th night. Paired indoor and outdoor landing catches were made by 4 adult male collectors working in 2 teams of 2, 1 team working from 1800 to 2400 hours and the other from 2400 to 0600 hours. One member of each team collected mos-quitoes which landed on him inside the selected house; the 2nd collected outside. Searches for en-gorged resting mosquitoes were carried out from
Amugu (Screw)
river
Fig. 2. Vegetation and land systems map of the Wosera area. Names for the land systems are those used by Haanjens et al. (1968) for forest and grass-covered hills with garden regrovvth (Q); rolling grassland, largely Imperata spp. (a); flat to gently undulating grassland with minor swamp vegetation (n); flood plains and low river terraces, with mixed flood plain forest and garden regrowth (ffl); and Anopheles breeding sites (*).
0630 to 0730 hours inside the bedrooms of the house used for the landing catch, and in 3 other neighboring houses. At the same time, outdoor col-lections were made from naturally occurring rest-ing sites around the perimeters of these houses.
In the 3rd yr, immature stages of Anopheles were sought from accessible aquatic sites that could possibly serve as potential breeding places. These included rainwater surface pools, pools left by the receding streams, sago swamps, ground seepage, and surface areas in which the level of water fluctuates with that of the streams. Standard dipping using enamel bowls was used for sampling larvae from accessible sites. The approximate po-sitions of these sites were entered into maps ob-tained from household surveys.
Identification of Anophelines. Mosquitoes
were taken to the field laboratory, and the anoph-elines were identified morphologically (Belkin 1962, Lee et al. 1987). Representative females ob-tained from landing and resting collections were sent to the Queensland Institute of Medical Re-search for confirmation using cellulose acetate electrophoresis (Foley et al. 1993) and 32P-labeled species specific DNA probes (Cooper et al. 1991).
Human Blood Index. The midguts of semi- and fully engorged female Anopheles mosquitoes from indoor and outdoor resting collections were squashed onto filter papers and later tested by a direct enzyme-linked immunosorbent assay (ELI-SA) using antihost immunoglobulin (IgG) conju-gates against human, pig, dog, cat, and goat (Beier et al. 1988). Each filter paper sample was eluted individually in 50 ^1 PBS (pH 7.4), diluted with 1 ml PBS and stored at -20°C until testing by direct ELISA. Cross-reactivity was decreased by the ad-dition of 1:500 dilutions of heterologous sera to the conjugate solutions. Because 70% of the blood sources could be detected after 24 h of digestion (Burkot et al. 1988a), we did not compare the level of cross-reactivity with blood meals from other hosts.
Statistical Model for Spatial and Temporal Variation in Densities. Maps of average mosquito
densities and estimates of day-to-day variation were produced separately for each Anopheles spe-cies, as described by Smith et al. (1995) for map-ping of mosquito densities in Tanzania. In brief, a Bayesian conditional autoregressive Poisson model was used to estimate expected average indoor
den-March 1997 Hn ET AL.: VARIATION IN Anopheles ABUNDANCE IN PAPUA NEW GUINEA 197
Table 1. Number of indoor landing catches per house, August 1990-September 1993 1 2 3 4 > 4 Totals No. North Wosera 201 111 49 20 29 410 houses South Wosera 78 34 18 11 13 154
sities in each house, allowing appropriately for im-balances in tlie sampling effort and for day-to-day variation in mosquito populations.
The (natural) logarithm of the expected number of mosquitoes (Et/) was analyzed as a function of space and time as In E« = ty + 0: , where % is the effect associated with house i, and (9, is the effect associated with nighty.
To allow for spatial autocorrelation and to pro-vide estimates of densities for houses that were not sampled, a spatially smooth function tf* was de-fined, corresponding to the mean of W( for all houses within a radius of 150 m (r = 150) from the point (x,y), excluding any house at precisely point (x,y). The model then treated the effect for a given house i, at position (x,y), ^ , as drawn from a nonnal distribution with mean tyxy. % —^Xttj then measures tlie difference (on a log scale) be-tween tlie estimated numbers of mosquitoes in a house and tlie numbers that would be expected given its position.
The value of r (150 m) was chosen to allow for short-range autocorrelation. A lower limit to r is imposed because isolated houses (with no neigh-bors at distances <r) cannot be included in the model. The value of 150 m for r allowed inclusion of a total of 564 sampled houses.
The night effects, 0j, also were treated as ran-dom effects. This made it possible to compare the levels of both spatial and temporal variation in densities for tlie different species while allowing for sampling variation (Smith et al. 1995). The model was fitted by Gibbs sampling using the pro-gram BUGS (Thomas et al. 1992).
Associations Between Species. Southwood's
(1978) index of association between species was
calculated as I = 2 [J/(A + B) - 0.5], where / is the number of individuals of both species in sam-ples where they occur together, and A and B are the total numbers of individuals of the 2 species in all samples (Service 1993). 7 lies between between the normal range of —1 (no association) to +1 (complete association).
Results
Sampling Pattern. Fig. 1 shows the locations of
564 houses included in the analyses and other un-sampled houses. 72.7% (n = 410) of the un-sampled houses were located in North Wosera. The distri-bution of houses and number of sampling occa-sions per house is shown in Table 1. There was a high level of household participation in imple-menting the original sampling plan. The number of indoor landing catches was similar during 1990-1991 and 1992-1993 (623 versus 653, respective-
ly)-Species Abundance and Endophily.
Morpho-logically identified An. koliensis, An. punctulatus,
An. karwari, An. farauti s.l., An. longirostris, and An. bancroftii comprised 40.4, 36.7, 14.3, 4.9, 3.1,
and 0.7%, respectively, of the 85,197 Anopheles specimens collected during the 1,276 paired land-ing catches. Allozyme studies confirmed the pres-ence of both An. punctulatus s.s. (n = 27) and An.
koliensis (n = 118). The An. farauti s.l. differed
electrophoretically (n = 9) and by DNA probe analysis (n = 127) from An. farauti sibling species Numbers 1, 2, and 3, but a positive identification of these mosquitoes was not obtained.
The ratios of numbers of landing mosquitoes caught indoors/outdoors are given in Table 2. All these ratios differed significantly from 1:1 except for that of An. karwari ( ^ = 2.2, P > 0.05).
Spatial Pattern. Table 3 gives mean human
landing rates by village for each anopheline spe-cies, for the houses and time periods sampled. There were substantial differences in both species composition and abundance (numbers relative to a collector) among villages. These averages did not allow for imbalances in the sampling effort, nor did they indicate the extent of variation within the vil-lages. However, Fig. 3 shows contour maps of the indoor bites per person per night, averaged over
Table 2. Comparison of anopheline species
An. punctulatus An. koliensis An. kancari An. farauti s.l. An. bancroftii An. longirostris
Total caught In/out ratio
Total tested for human blood Human blood index
31,263 0.87
926
0.90 Empirical variance of CAR model estimates
House effects (ipi)a
Night effects (8j) 1.42 1.00 34,376 0.95 2,097 0.79 5.60 1.57 12,162 0.96 313 0.79 3.49 2.99 4,156 0.72 111 0.88 2.42 1.00 611 0.69 38 0.40 2.90 0.54 2,629 0.65 31. 0.84 2.03 1.67 CAR, conditional autoregression.
Table 3 . Human landing rates by village and species
Village Person-nights punctulatusAn. koliensisAn, karwariAn. farauti s.l.An. An. An.
bancroftii longirostris Totals
Kamge N indigo Nale-2 Nale-1 Kunjingini-1 Nainda Kausagu Mul Apusit Kunjingini-2 280 260 174 300 298 216 252 180 339° 252 3.1 3.9 4.1 5.6 9.6 11.4 11.6 14.7 23.1 32.8 1.8 10.1 14.6 15.0 9.9 11.5 2.7 20.0 23.2 26.3 0.2 0.6 11.7 26.0 2.8 0.7 0.6 0.5 2.2 0.5 1.8 2.0 7.4 1.8 0.9 1.0 1.4 1.0 0.4 0.5 0.3 0.3 0.5 0.4 0.2 0.1 0.3 0.2 0.1 0.1 4.8 1.5 2.0 0.3 0.5 0.3 0.4 0.1 0.2 0.2 12.0 18.4 40.3 49.1 23.9 25.0 17.0 36.5 49.2 60.4 Data tabulated are the mean numbers of mosquitoes captured from 1800 to 0600 hours per exposed mosquito collector per night over all sampling nights. Both indoor and outdoor catches are included.
" One night's sampling from Apusit consisted of indoor landing data only.
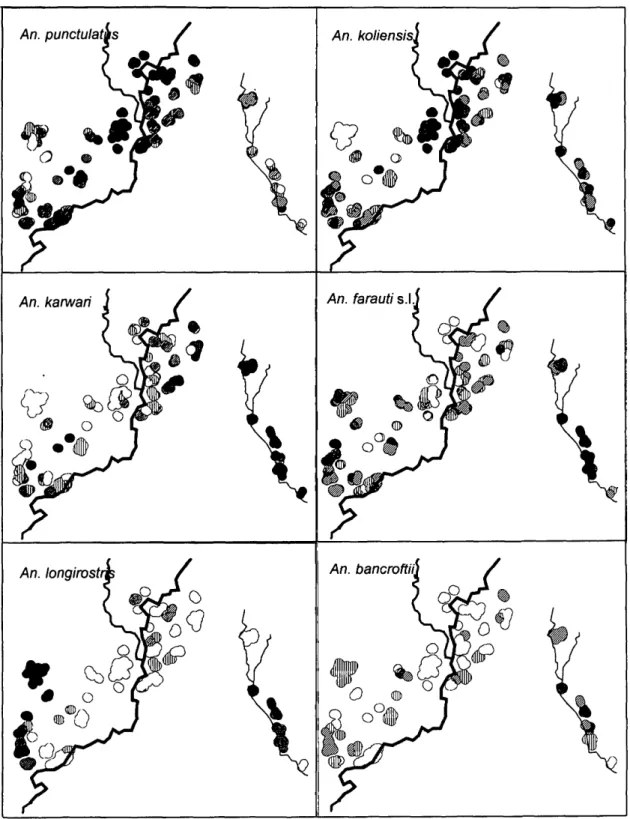
time and smoothed in space, allowing appropriate-ly for imbalances in the sampling scheme using the conditional auto regression models. The models in-cluded data for 164 nights of sampling, in which 564 houses were represented and a total of 1,141 landing catches made.
Substantial variation in anopheline abundance was evident even within the villages, and because the peripheries of 4 villages (Kunjingini-1, Mul, Kunjingini-2, Apusit, Nindigo, and Nainda) were more or less contiguous, the spatial patterns often did not segregate by village boundaries (Fig. 3). The variances of the distributions of % (Table 2) measure the overall spatial variability of each spe-cies. All species had focal distributions within the study area. Although An. koliensis had the highest variance of #), the spatial distributions of the 2 most abundant species were quite similar, with both An. punctulatus and An. koliensis abundance concentrated along the banks of the Amugu river and its tributaries in Apusit, Mul, and Kunjingini-2 (Fig. 3). An. karwari was most frequently collected in Nale village but also was relatively abundant in the parts of Apusit and Kunjingini which were nearest to Nale (and hence farthest from the Amu-gu river). An. farauti s.l. showed a non-overlapping distribution with An. punctulatus (Fig. 3) with rel-atively high densities in Nale-2 and Nindigo and low densities in Apusit, especially near the river. Although An. longirostris was relatively and infre-quently collected in most villages, it was the com-monest human biter in Kamge village, which formed an isolated group of houses where the oth-er species woth-ere least abundant. It also was collect-ed relatively frequently in the other villages along the western fringe of the study area and in Nale-2. The distribution of An. bancroftii was similar to that of An. longirostris, although it was not abun-dant.
Changes in Landing Rates over Time. Fig. 4
shows the average mosquito abundance in the sampled houses predicted from the conditional auto regression model for each day of sampling, which comprised 8, 61, 50, and 45 d in 1990, 1991, 1992, and 1993, respectively. Similar patterns were
observed for the unadjusted geometric mean den-sities (not shown). Ranges of exp(^) were 0.1-70.27 females per person per night for An.
kolien-sis (Fig. 4A), 0.25-26.09 for An. punctulatus (Fig.
4A), 0.02-33.82 for An. karwari (Fig. 4B), 0.07-5.75 for An. farauti s.l. (Fig. 4B), 0.02-4.82 for An.
longirostris (Fig. 4C) and 0.04-1.52 for An. ban-crofti (Fig. 4C). The variances of the night effects
of 0j (Table 2) give measures of the overall tem-poral variability for each species. The magnitude of maximum and minimum peaks in landing rates showed that An. koliensis (Fig. 4A), An. karwari (Fig. 4B), and An. longirostris (Fig. 4C) have the highest degree of variability over time. There was much less temporal variability in landing rates of
An. punctulatus (Fig. 4A), An. farauti s.l. (Fig. 4B)
and An. bancroftii (Fig. 4C).
The abundance of all 6 anopheline species in-creased following increases in rainfall (compare Fig. 4 A-C and Fig. 4D), but there were no regular annual cycles in abundance over time. Spearman correlation coefficients between values of ®> and mean daily rainfall measured during the 4 wk pre-ceding day^' were similar for each of the 6 species, ranging from +0.18 (An. karwari) to +0.34 (An.
koliensis) (all P < 0.03).
Biting Cycles. Fig. 5 shows the biting cycles for
each species. In each case, the percentage of hu-man landing per hour was plotted separately for indoor and outdoor collections. An. punctulatus,
An. koliensis, and An. karwari showed peak biting
during the early hours of the morning, whereas An.
farauti s.l. and An. longirostris were abundant
ear-ly in the evening (Fig. 5). The biting activity of An.
bancroftii occurred more or less equally
through-out the night. An farauti s.l., An. longirostris, and
An. bancroftii all showed a slight tendency to bite
earlier outdoors than indoors.
Human Blood Index.In total, 8,463
anophe-lines were obtained from indoor and outdoor rest-ing collections in the 10 villages durrest-ing 1990-1993. The specimens processed for blood meal identifi-cation comprised 95.4% of all 3,685 engorged fe-males. Of the 3,516 specimens processed, 2,245 (46.3%) were collected resting inside houses and
March 1997 Hu ET AL.: VARIATION IN Anopheles ABUNDANCE IN PAPUA NEW GUINEA 199
An. punctulat An. koliensis,
An. karwari An. farauti s.l
An. longirosti An. bancroftii
Fig. 3. Contour plot of average indoor anopheline abundance per house in Wosera during 1990-1993. Human landing rate of An. punctulatus and An. koliensis: D, <1; m, 1-2; D, 2-5; B, 5-10; • , >10. Human landing rate of An. kancari, An. farauti s.l., An. longirostris and An. bancroftii: O, <0.1; m, 0.1-0.2; D, 0.2-0.5; U, 0.5-1.0; • , >1.0.
o>60- O40§ 2 0 -o-1 5 £ 4 -8. c 3 H 5 . 2 -An. punctulatus An. koliensis An. longirostris An. bancroftii p h 90 I 93
B
90 YearFig. 4. Human-biting rate (exp((9j)) of Anopheles mosquitoes estimated from indoor landing catches, 1990-1993.
Fitted values estimated from the CAR model for the 564 sampled houses. Solid lines refer to the 1st species, the dotted line to the 2nd species. (A) An. punctulatus and An. koliensis. (B) An. kanuari and Ari. farauti s.l. (C) An. longirostris and An. bancroftii. (D) Rainfall, by 4-wk period recorded at Kunjingini, 1990-1993.
1,271 (35.1%) were collected from outdoor natural shelters. The human blood index was calculated as the sum of indoor and outdoor numbers containing a specific host blood meal divided by the total numbers of indoor and outdoor blood-fed mos-quitoes (Garrett-Jones 1964). An. punctulatus had the highest HBI (Table 2) followed by An. farauti s.l., An. longirostris, An. koliensis, and An. karwari.
An. bancroftii had a much lower HBI than the
oth-er species. Human blood indices calculated sepa-rately from indoor and outdoor resting mosquitoes for all species other than An. koliensis were not significantly different. 84.1% of 1,337 An. koliensis caught indoors had fed on humans, compared with 70.1% of 760 caught outdoors ( ^ = 57.5, P < 0.0001).
Index of Association Between Species. Indices
of association between species reflected spatial and temporal co-occurence. The strongest positive as-sociations were between An. punctulatus and An.
koliensis (+0.85), followed by An. farauti s.l. and An. longirostris (+0.44) and An. koliensis and An. karwari (+0.34) (Table 4). An. punctulatus and An. koliensis were strongly negatively associated with
the rarer species An. bancroftii and An.
longiros-tris. The negative association between An. punc-tulatus and An. farauti s.l. was not as obvious here
as shown in Fig. 3, presumably because the ten-dency for them to occur in different villages was somewhat offset by a tendency to occur on the same nights.
Relationship of Numbers of Mosquitos Caught to House Construction. The quantity % — ^.x,j is a measure of the deviation of mosquito abun-dance in house i from that expected for its loca-tion. Means of % — ^.Xy were computed for each anopheline species separately for houses raised on stilts (104 houses) and for houses at ground level (252 houses). The form of construction of the re-maining sampled houses had not been recorded. For all 6 species differences were small and not statistically significant.
Discussion
The 6 morphological species of Anopheles iden-tified in the Wosera area of Papua New Guinea exhibited substantial differences in abundance,
March 1997 Hn ET AL.: VARIATION IN Anopheles ABUNDANCE IN PAPUA NEW GUINEA 201 2 5 2 O 215 o
An. punctulatus
D Indoor
I Outdoor
An. koliensis
1 0 S O 25 2O •5 15 .a *o at o> f| 1O o 25 2 O :i 15 o8,
1 0An. karwari
An. longirostris
An. farauti
An. bancroftii
O r ( i n <M (M N W 0) O i- CM i- N O(M W CM N CO 10 (0Time of night (h)
Time of night (h)
Fig. 5. Nocturnal indoor and outdoor biting cycles of females of 6 Anopheles species collected from 10 villages in study area. Open bars refer to indoor biting, and filled bars to outdoor biting. An. punctulatus (n = 14,505 indoor, 16,758 outdoor); An. koliensis (n = 16,748 indoor, 17,629 outdoor); An. karwari (n = 5,965 indoor, 6,197 outdoor); An. farauti s.l. (n = 1,745 indoor, 2,411 outdoor); An. longirostris (n = 1,038 indoor, 1,591 outdoor); An. bancroftii (n = 249 indoor, 362 outdoor).
Table 4. Measure of association (I) between Anopheles species Species An. punctulatus An. koliensis An. kancari An. forauti s.l. AH. hancroftii An. koliensis 0.85 — — An. kanvari 0.12 0.34 — — — An. farauti s.l. -0.27 -0.09 0.29 — — An. bancroftii -0.73 - 0 68 -0.22 -0.25 — An. longirostris - 0 60 -0.06 -0.43 0.44 -0.13
spatial and temporal distribution, and biting be-havior. The taxonomy of these anophelines, es-pecially of An. farauti s.l., is not fully resolved. Fo-ley et al. (1993) recognized 6 species of the An.
farauti complex in Papua New Guinea and the
So-lomon Islands, but new species continue to be dis-covered (e.g., Foley et al. 1995).
Recently described species included one sibling morphologically identical to An. punctulatus found near the south coast of Papua New Guinea (Foley et al. 1995). However, allozyme studies indicated that the Wosera populations belong to An.
punc-tulatus s.s. The allozyme analyses also confirmed
the identity of An. koliensis from Wosera, but we cannot exclude the possibility that some An.
far-auti No. 4 also may occur, because this taxon is
morphologically indistinguishable from An.
kolien-sis (Foley et al. 1993). The human blood indices
for An. punctulatus and An. koliensis in our study were in good agreement with those of Burkot et al. (1988a) for the Madang area.
The abundance of An. punctulatus was highest along the low-lying banks of the Amugu River and adjacent tracts of sago swamp running north-south through Apusit, Kunjingini-1, Kunjingini-2, and Mul, but with its abundance decreasing with dis-tance from the river. Because the fringes of the river are populated densely and have the most in-tensive agriculture, this is consistent with a high degree of vector anthropophily and with An.
punc-tulatus breeding in the areas most disturbed by
human activity. Although this species has been re-ported to disperse up to 1.8 km from a release site (Charlwood and Bryan 1987), most females re-mained concentrated in small areas along the banks of the Amugu River, most noticeably in Apu-sit and Kunjingini-2.
Although An. koliensis reportedly exploits larval habitats different than those of An. punctulatus (Charlwood et al. 1986, Lee et al. 1987), we found that adults of the 2 species were strongly associ-ated, even though An. koliensis showed more vari-ation over time in landing catches and showed a decreasing gradient of abundance away from the Amugu (Screw) River. Larvae of An. koliensis were collected from the sago swamps among the north-erly hamlets of Apusit and Kunjingini-1, which may have been major breeding sites (unpublished data), but we do not have an explanation for the relative scarcity of this species in areas around sim-ilar swamps near Kamge and Nainda. Larvae oc-casionally have been found in temporary habitats at the forest margin (Owen 1945, Belkin 1962).
Peters and Standfast (1960) also found An.
kolien-sis to be more seasonal than An. punctulatus in the
same area as the current study, whereas changes in population density of both species were syn-chronized with monthly rainfall in the Madang area (Charlwood 1985, Burkot et al. 1988b).
Landing rates of An. farauti s.l. were highly sea-sonal near Madang (Afifi et al. 1980, Charlwood et al. 1986, Burkot et al. 1988b), and in that area it was the predominant vector of malaria in coastal but not inland villages, breeding mainly in coastal streams with large temporal fluctuations in adult densities. Although not as early as in the Wosera, peak landing catches in Madang area also occurred before midnight (Charlwood 1985). In the Wosera,
An. farauti s.l. was one of the species with the least
variation over time in landing catches and has a relatively early biting cycle, in agreement with the previous study of Standfast (1967) from the Maprik district. The human blood index in our study was double that of coastal An. farauti s.l. reported by Burkot et al. (1988a). It occured mostly in the vil-lages of Nale-1 and Nale-2, but even there peak abundance was not high. This species seems to be associated with less disturbed habitats than those of An. punctulatus, and the Imperata spp. grass-land would seem to provide some degree of iso-lation from the anopheline communities in the center of the study area. Allozyme and DNA probe results (D. Foley and N. Beebe, personal com-munication) indicated that the An. farauti s.l. in Wosera is a different species than the coastal pop-ulations which belong to An. farauti No. 1.
The morphotype of An. longirostris also may consist of several sibling species in Papua New Guinea (D. Foley, personal communication). Un-like Charlwood et al. (1985), we found An.
longi-rostris to be predominantly anthropophagic;
there-fore we suspect that another sibling species different from that in Madang may predominate in Wosera. There is a relatively high abundance of
An. longirostris, both in Kamge at the western side
of the study area where this species accounts for the most human biting, and in Nale-2.
Anopheles karwari, which can be identified
eas-ily morphologically, breeds in foothill seepages and small streams (Lee et al. 1987) but has a spatial distribution in Wosera similar to that of An. farauti s.l. and is concentrated in Nale-1 and Nale-2, per-haps breeding in the small creeks there. In Nale-1, An. karwari is the most abdundant anopheline biting humans. An. karwari showed much more temporal variation in abundance than did An.
far-March 1997 Hn ET AL.: VARIATION IN Anopheles ABUNDANCE IN PAPUA NEW GUINEA 203 auti s.l.; therefore, despite similar spatial
distribu-tions, we suspect that these species have different breeding sites.
The least abundant anopheline recorded, An.
hancroftii also can be identified morphologically. It
showed less temporal variation in abundance than the other species and is the least anthropophagic, occurring at low densities in all the villages. This species also has a low propensity for human biting in Australia, preferring to feed on domestic ani-mals (Lee et al. 1987).
It has long been recognized (Peters and Stand-fast 1960) that the most intense malaria transmis-sion in Papua New Guinea occurs where the main vectors are An. punctulatus or An. koliensis. The high human blood indices of these species are an important reason for this, but none of the Papua New Guinea species fed exclusively on humans.
An. koliensis fed on marsupials and pigs as well as
on humans, and An. punctulatus also fed on pigs (Foley et al. 1993). The late-biting cycles of these 2 most frequently collected species may be a spe-cialization for human biting which they share with Afrotropical malaria vectors (Charlwood et al. 1996). However An. karwari also has a late-biting cycle, altliough it prefers to feed on bovines in Asia (Lee et al. 1987). Cattle are not found in Wosera where An. karwari has a high human blood index. In Nale-1, it was the anopheline with the highest human landing rate; therefore, it may be an im-portant malaria vector in this area.
Because the more abundant anophelines tend to occur together in time and space, there is marked spatial clustering of human biting in Wosera. It may be that the clustering of malaria transmission is even more pronounced, because the minor an-opheline species, whose spatial distributions to some extent complement those of the more abun-dant species, probably are less efficient vectors.
An. farauti s.l., An. longirostris, and An. bancroftii
are early outdoor biters and seem to be more suc-cessful in biting people that are engaged in out-door activities before midnight. However, because they are less likely to enter houses, this would make it easier for people to avoid them. Neverthe-less, all these species except An. bancroftii had high human blood indices; therefore, their impor-tance as vectors of malaria remains uncertain.
It seems unlikely that human behavior plays an important role in either spatial or temporal varia-tion in landing rates. Although there are large dif-ferences among villages in the use of mosquito bed nets (Genton et al. 1994), these nets are not im-pregnated with insecticide. The structure of houses and the activity patterns and life styles of the peo-ple varied little among the villages. Only the mis-sion station at Kunjingini-1 formed a discrete area of houses, some of which were screened against mosquitoes. In contrast to the study by Charlwood et al. (1984) in coastal Madang of Papua New Guinea, we did not find a significant reduction in landing rates in raised structures, presumably
be-cause different sibling species of An. farauti oc-curred there.
The evidence presented here clearly shows that
Anopheles populations are clustered rather than
homogeneously distributed, altliough explanations for these patterns are not clear. The co-occurence of An. punctulatus and An. koliensis in Wosera, despite focal distributions of both species, may lead to extreme variation in space in the transmis-sion of malaria. The degree of concentration of an-opheline abundance in Wosera might be excep-tional, but given the degree of species diversity (Foley et al. 1993) and breeding site specialization (Charlwood 1985, Charlwood et al. 1986), extreme small-area variation in the composition of anophe-line communities is probably a general character-istic in Papua New Guinea. The consequent large variations in malaria transmission over a few hun-dreds of meters very likely play an important role in keeping some parts of the human population relatively free from sporozoite inoculations and re-ducing the spread of Plasmodium variants. It also may explain the small-area epidemiological varia-tions observed by Cattani et al. (1986b). Further analyses of our data will consider the sporozoite rates in the different anopheline species. This will make possible a direct test of this hypothesis by relating malaria in the human population to mea-sured entomological inoculation rates.
Acknowledgments
We thank M. Packer, R. Paru, E. Ibam, II. Dagoro, E. Renyard, M. Lagog, M. Baea, L. Rare, J. Taiine, P. Kave, and D. Kotale for excellent technical and logistic support. We are grateful to J. D. Charlwood, R. D. Cooper, D. Foley, and J. H. Bryan for their helpful comments on the manuscript. D. Foley and N. Beebe are thanked for iden-tifying specimens using electrophoresis and DNA spe-cies-specific probes. We thank an anonymous reviewer and W. Reisen for valuable suggestions. We thank the members of the field teams in Wosera, as well as villagers among the 10 communities, for their cooperation and ac-tive participation. Clearance for this research was given by the Medical Research Advisory Committee of Papua New Guinea. This work was part of the Malaria Vaccine Epidemiology and Evaluation Project funded by the United States Agency for International Development No. 9365967.89. Data analysis was partly supported by Swiss National Science Foundation Grant No. 32-43427.95.
References Cited
Afifi, A., M. Spencer, P. B. Hudson, and N. W. Tavil. 1980. Biting prevalence and malaria transmission patterns in the Anopheles punctulatus complex (Dip-tera: Culicidae) in Papua New Guinea. Aust. J. Exp. Biol. Med. Sci. 58: 1-17.
Allen B. J., R. L. Hide, D. Bourke, D. Friutch, R. Crau, E. Lowes, T. Nen, E. Nirsie, J. Riaimeri, and M. Woruba. 1993. Agricultural systems of Papua New Guinea, working paper No. 2. East Sepik Prov-ince: text summaries, maps, code lists and village Identification. ANU, Canberra.
Alpers, M. P., F. Al-Yaman, H.-P. Beck, K. K. Bhatia, J. Hii, D. J. Lewis, R. Paru, and T. Smith. 1992.
The malaria vaccine epidemiology and evaluation pro-ject of Papua New Guinea: rationale and baseline studies. P.N.G. Med. J. 35: 285-297.
Beier, J. C , P. V. Perkins, R. A. Wirtz, J. Koros, D. Diggs, T. P. Gargan, and D. K. Koech. 1988.
Bloodmeal identification by direct enzyme-linked im-munosorbent assay (ELISA), tested on Anopheles (Diptera: Culicidae) in Kenya. J. Med. Entomol. 25: 9-16.
Bclkin, J. N. 1962. The mosquitoes of the South
Pa-cific (Diptera: Culicidae), vols. 1 and 2. University of California Press, Berkeley.
Burkot, T. R., P. M. Graves, J. A. Cattani, R. A. Wirtz, and F. D. Gibson. 1987. The efficiency of
sporozoite transmission in the human malarias, Plas-modiiim falciparum and P. vivax. Bull. W.H.O. 65: 375-380.
Burkot, T. R., P. M. Graves, R. Paru, and M. Lagog. 1988a. Mixed bloodfeeding by the malaria vectors
in the Anopheles punctulatus complex (Diptera: Cu-licidae). J. Med. Entomol. 25: 205-213.
Burkot, T. R., P. M. Graves, R. Paru, R. A. Wirtz, and P. F. Heywood. 1988b. Human malaria
trans-mission studies in the Anopheles punctulatus complex in Papua New Guinea: sporozoite rates, inoculation rates and sporozoite densities. Am. J. Trop. Med. Hyg. 39: 135-144.
Cattani, J. A., J. L. Tulloch, H. Vrbova, D. Jolley, F. D. Gibson, J. S. Moir, P. F. Heywood, M. P. Alpers, A. Stevenson, and R. Clancy. 1986a. The
epide-miology of malaria in a population surrounding Ma-dang, Papua New Guinea. Am. J. Trop. Med. Hyg. 35: 3-15.
Cattani, J. A., J. S. Moir, F. D. Gibson, M. Ginny, J. Paino, W. Davidson, and M. P. Alpers. 1986b.
Small-area variations in the epidemiology of malaria in Madang Province. P.N.G. Med. J. 29: 11-17.
Charlwood, J. D., R. Paru, H. Dagoro, M. Lagog, L. Kelepak, S. Yabu, P. Krimbo, and P. Pirou. 1983.
Factors affecting the assessment of man biting rates of malaria vectors, pp. 143-151. In J. H. Bryan and P. M. Moodie [eds.], Malaria: proceedings of a con-ference to honour Robert H. Black. Australian Gov-ernment Publishing Service, Canberra.
Charlwood, J. D., R. Paru, and H. Dagoro. 1984.
Raised platforms reduce mosquito bites. Trans. R. Soc. Trop. Med. Hyg. 78: 141-142.
Charlwood, J. D. 1985. The influence of larval habitat
on the ecology and behavior of females of the punc-tulatus group of Anopheles mosquitoes from Papua New Guinea, pp. 399-406. In L. P. Lounibos, J. R. Rey, and J. H. Frank [eds.], Ecology of mosquitoes: proceedings of a workshop. Florida Medical Ento-mology Laboratory, Vero Beach.
Charlwood, J. D., H. Dagoro, and R. Paru. 1985.
Blood feeding and resting behaviour in the Anopheles punctulatus group (Diptera: Culicidae) from Madang. Bull. Entomol. Res. 75: 463-475.
Charlwood, J. D., P. M. Graves, and M. P. Alpers. 1986. The ecology of the Anopheles punctulatus
group of mosquitoes from Papua New Guinea: a re-view of recent work. P.N.G. Med. J. 29: 19-26.
Charlwood, J. D., and J. H. Bryan. 1987. A
mark-recapture experiment with the filariasis vector Anoph-eles punctulatus in Papua New Guinea. Ann. Trop. Med. Parasitol. 81: 429-436.
Charlwood, J. D., P. M. Graves, and T. F. de C. Mar-shall. 1988. Evidence for a memorised home range
in Anopheles farauti. Med. Vet. Entomol. 2: 101-108.
Charlwood, J. D., T. Smith, J. Kihonda, P. F. Billing-sley, and W. Takken. 1996. Density independent
feeding success in malaria vectors from Tanzania. Bull. Entomol. Res. 85: 29-35.
Cooper, L., R. D. Cooper and T. R. Burkot. 1991.
The Anopheles punctulatus complex: DNA probes for identifying the Australian species using isotopic, chro-mogenic and chemiluminescence detection systems. Exp. Parasitol. 73: 27-35.
Dye, C., and G. Hasibeder. 1986. Population
dynam-ics of mosquito-borne diseases: effects of flies which bite some people more frequently than others. Trans. R. Soc. Trop. Med. Hyg. 80: 69-77.
Foley, D. H., R. Paru, H. Dagoro, and J. H. Bryan. 1993. Allozyme analysis reveals six species within the Anopheles punctulatus complex of mosquitoes in Pa-pua New Guinea. Med. Vet. Entomol. 7: 37-48.
Foley, D. H., R. D. Cooper, and J. H. Bryan. 1995.
A new species within the Anopheles punctulatus com-plex in Western Province, Papua New Guinea. J. Am. Mosq. Control Assoc. 11: 122-127.
Forsyth, K. P., R. F. Anders, J. A. Cattani, and M. P. Alpers. 1989. Small area variation in prevalence of
an S-antigen serotype of Plasmodium falciparum in villages of Madang, Papua New Guinea. Am. J. Trop. Med. Hyg. 40: 344-350.
Garrett-Jones, C. 1964. The human blood index of
malaria vectors inrelation to epidemiological assess-ment. Bull. W.H.O. 30: 241-261.
Genton, B., J. Hii, F. Al-Yaman, R. Paru, H.-P. Beck, M. Ginny, H. Dagoro, D. Lewis, and M. P. Alpers. 1994. The use of untreated bednets and malaria
in-fection, morbidity and immunity. Ann. Trop. Med. Parasitol. 88: 263-270.
Genton B., F. Al-Yaman, H.-P. Beck, J. Hii, S. Mellor, A. Narara, N. Gibson, T. Smith, and M. P. Alpers. 1995. The epidemiology of malaria in the Wosera
area, East Sepik Province of Papua New Guinea, in preparation for vaccine trials. I. Malariometric indices and immunity. Ann. Trop. Med. Parasitol. 89: 359-376.
Greenwood, B. M. 1989. The microepidemiology of
malaria and itsimportance to malaria control. Trans. R. Soc. Trop. Med. Hyg. 83: 25-29.
Haanjens H. A., J. M. Arnold, J. R. McAlpine, J. A. Mabbutt, E. Reiner, R. G. Robbins, and J. C. Saunders. 1968. Lands of the Wewak-Lower Sepik
Area, Territory of Papua New Guinea. Land Research Series No. 22, CSIRO, Melbourne.
Lee D. J., M. M. Hicks, M. Griffiths, M. L. Deben-ham, J. H. Bryan, R. C. Russell, M. Geary, and E. N. Marks. 1987. The Culicidae of the Australasian
Region, vol. 5. Australian Government Publishing Ser-vice, Canberra.
Maplnfo. 1990. Maplnfo, version 1.1. Maplnfo, Troy,
NY.
Metselaar, D. 1957. A pilot project of residual
insec-ticide spraying in Netherlands New Guinea, contri-bution to the knowledge of holo-endemic malaria. Acta Leiden. 27: 1-128.
Nakazawa M., R. Ohtsuka, T. Kawabe, T. Hongo, T. Suzuki, T. Inaoka, T. Akimichi, S. Kano, and M. Suzuki. 1994. Differential malaria prevalence
among villages of the Gidra in lowland Papua New Guinea. Trop. Geogr. Med. 46: 350-354.
March 1997 Hn ET AL.: VARIATION IN Anopheles ABUNDANCE IN PAPUA NEW GUINEA 205
Owen, W. B. 1945. A new anopheline from the
Solo-mon islands with notes on its biology. J. Parasitol. 31: 236-240.
Peters, W. 1960a. Studies on the epidemiology of
ma-laria in New Guinea. I. Holoendemic mama-laria—the clinical picture. Trans. R. Soc. Trop. Med. Hyg. 54: 242-248.
1960b. Studies on the epidemiology of malaria in New
Guinea. III. Holoendemic malaria—the analysis of data and relation to control. Trans. R. Soc. Trop. Med. Hyg. 54: 254-260.
1965. Ecological factors limiting the extension of
laria in the southwest Pacific—their bearing on ma-laria control or eradication programmes. Acta Trop. 22: 62-69.
Peters, W., and H. A. Standfast. 1960. Studies on the
epidemiology of malaria in New Guinea. II. Holoen-demic malaria—the entomological picture. Trans. R. Soc. Trop. Med. Hyg. 54: 249-254.
Peters, W., and S. H. Christian. 1963. The
bionom-ics, ecology anddistribution of some mosquitoes (Dip-tera: Gulieidae) in the Territory of Papua and New Guinea. Acta Trop. 20: 35-79.
Rook, H. de 1929. Malaria en anophelinen aan de
Boven-Digoel. Rapport D.V.G., Batavia, Indonesia.
Service, M. 1993. Indices of association between spe-cies and spespe-cies diversity, pp. 890-913. In M. W. Ser-vice [ed.], Mosquito ecology: field sampling methods, 2nd ed. Elsevier, London.
Smith T., J. D. Charlwood, W. Takkcn, M. Tanner, and D. Spiegelhalter. 1995. Mapping the densities
of malaria vectors within a single village. Acta Trop. 59: 1-18.
South wood, T.R.E. 1978. Ecological methods with
particular reference to the study of insect populations. Chapman & Hall, London.
Spencer, M. 1970. Density and longevity of Anopheles farauti Laveran. P.N.G. Med. J. 13: 84-90.
Standfast, H. A. 1967. Biting times of nine species of
New Guinea Culicidae (Diptera). J. Med. Entomol. 4: 192-196.
Thomas, A., D. J. Spiegelhalter, and W. R. Gilk.s. 1992. BUGS: a program to perform Bayesian
infer-ence using Gibbs sampling, pp. 837-842. In J. M. Bernado, J. O. Berger, A. P. Dawid, and A.F.M. Smith [eds.], Bayesian statistics, vol. 4. Clarendon, Oxford. Received for publication 7 March 1996; accepted 26 September 1996.