Misconceptions about fructose-containing sugars and their role in the
obesity epidemic
Vincent J. van Buul
1, Luc Tappy
2and Fred J. P. H. Brouns
1*
1Maastricht University, Faculty of Health, Medicine and Life Sciences, Department of Human Biology, PO Box 616, 6200 MD, Maastricht, The Netherlands
2University of Lausanne, Department of Physiology, 7 Rue du Bugnon, CH-1005, Lausanne, Switzerland
(Submitted 1 April 2013 – Final revision received 22 November 2013 – Accepted 31 January 2014)
Abstract
A causal role of fructose intake in the aetiology of the global obesity epidemic has been proposed in recent years. This proposition, how-ever, rests on controversial interpretations of two distinct lines of research. On one hand, in mechanistic intervention studies, detrimental metabolic effects have been observed after excessive isolated fructose intakes in animals and human subjects. On the other hand, food disappearance data indicate that fructose consumption from added sugars has increased over the past decades and paralleled the increase in obesity. Both lines of research are presently insufficient to demonstrate a causal role of fructose in metabolic diseases, however. Most mechanistic intervention studies were performed on subjects fed large amounts of pure fructose, while fructose is ordinarily ingested together with glucose. The use of food disappearance data does not accurately reflect food consumption, and hence cannot be used as evidence of a causal link between fructose intake and obesity. Based on a thorough review of the literature, we demonstrate that fructose, as commonly consumed in mixed carbohydrate sources, does not exert specific metabolic effects that can account for an increase in body weight. Consequently, public health recommendations and policies aiming at reducing fructose consumption only, without additional diet and lifestyle targets, would be disputable and impractical. Although the available evidence indicates that the consumption of sugar-sweetened beverages is associated with body-weight gain, and it may be that fructose is among the main constituents of these beverages, energy overconsumption is much more important to consider in terms of the obesity epidemic.
Key words:Fructose: Sugar: Sugar-sweetened beverages: Obesity
Introduction
Several studies and reports(1 – 8) have indicated an increased consumption of sugar-sweetened beverages (SSB) over the period 1970 – 2005 in the USA and Europe. The SSB category includes sodas (soft drinks), fruit drinks, sports drinks, ready-to-drink sweetened tea and coffee, rice drinks, bean beverages, sugared milk drinks, sugar cane beverages and non-alcoholic wines or malt beverages. The increased intake was related to a high availability of such products in the market, amplified marketing efforts, and larger portion sizes, which increased three- to five-fold over time(9). As such, SSB consumption was suggested to be a considerable amount of total daily energy intake(10).
Interestingly, over the last 5 years, the global annual con-sumption of carbonated soft drinks has remained constant or even has declined(11), while bottled water has increased
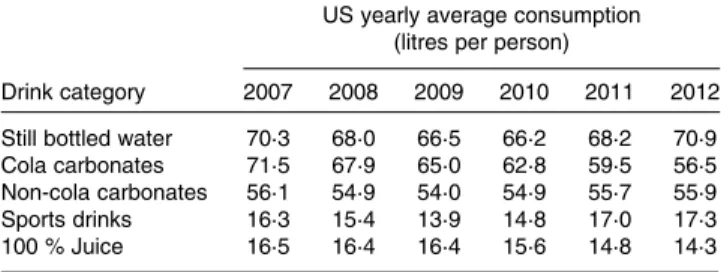
to more than 1 litre per individual per year in recent years(12). Obesity rates, however, seem to have increased independently of these shifts in beverage intake(13). An overview of the average Western European consumption of the five most common drink categories, including SSB, per capita per year are given in Table 1(14). Data from the USA are given in Table 2(15). Note that in the USA, carbonated water is replaced by sports drinks in the five most consumed categories.
Although data from Table 1 and Table 2 were obtained through trade sources and national statistics (by Euromoni-tor International(14,15)), which did not account for wastage and were not corrected for export to other countries, it can be concluded that, even if intake patterns are shifting, consumers in different parts of the world still purchase a relatively high amount of SSB.
In this light, the systematic reviews by Malik et al.(16)in 2006 and Hu & Malik(17) in 2010 concluded that such
* Corresponding author: Professor Fred Brouns, email [email protected]
Abbreviations: EFSA, European Food Safety Authority; EU, European Union; HFCS, high-fructose corn syrup; SSB, sugar-sweetened beverages.
qThe Authors 2014. The online version of this article is published within an Open Access environment subject to the conditions of
the Creative Commons Attribution licence http://creativecommons.org/licenses/by/3.0/
quantities of SSB consumption were associated with both weight gain and type 2 diabetes prevalence. Moreover, results from a survey in Australia indicated that high SSB intake may be an important predictor of cardiometabolic risk(18). A scientific opinion by the European Food Safety Authority (EFSA)(19), however, concluded that additional justification for the correlation between SSB consumption and such adverse health effects was required.
In this respect, one may question what in SSB could be responsible for these adverse effects on health(20). More specifically, first, is there evidence that specific sugars, such as fructose and glucose, as present in sucrose and high-fructose corn syrup (HFCS), promote excess energy intake? Second, is there evidence that excess energy intake as sugars is more detrimental to health than excess energy as fat, or as complex carbohydrate present in potatoes, rice, refined cereals, and so forth?(21).
Since the recent publications of Lustig and co-workers(22,23), in which it was suggested that fructose is toxic and should be ‘treated as alcohol’, the daily news all over the world highlighted fructose in SSB as a potential poison. It was proposed that fructose is a causal factor in obesity aetiology, based on the scientific evidence that substantiated that fructose, when consumed in excessive amounts, led to detrimental effects on body-weight regu-lation, lipid metabolism and glucose homeostasis in animals and in human subjects(24 – 27). As a result, an overall reduction in the global consumption of fructose-containing sugars was recommended in recent literature(1,4,16,28 – 36). To achieve this reduction, various measures have been proposed(37), most of which related to extra taxes on foods, such as SSB, that are considered unhealthy because of their high fructose content(38 – 43). However, raising tax levels, and consequently purchase prices, has generally failed to change consumption behaviours(44). In line with this, also the removal of products from the site of avail-ability has been discussed as possibly inappropriate in changing purchase behaviour, since it may result in exchanging the purchase with similar products(45). In the field studies of Wansink et al.(45), it was evidenced that taxing soft drinks in Utica (New York State) led beer-buying households to increase their purchases of beer. Similarly, taking out snacks and soft drinks from vending machines did not withhold children from buying such
products at other locations or finding other alternatives that are also high in sugars, fat, and energy-dense.
Moreover, as the human body does not differentiate fruc-tose absorption, whether it comes from HFCS, cane or beet sugar, or from an intrinsic source such as that present in fruits or fruit juices(19,46,47), would this reduction also be necessary for fruits that contain relatively large amounts of fructose such as apples, apricots and ripe bananas? Should honey also be removed from our diet(48)? These questions have confused the typical consumer of sweet (and sweetened) food products(49). This confusion may have been intensified by the issuing of a scientific opinion on fructose by EFSA in 2011. With this, European food manufacturers can claim that ‘consumption of fructose leads to a lower blood glucose rise than consumption of sucrose or glucose’(50). Having evaluated the scientific literature at their disposal(47,51 – 57), the EFSA panel assumed that, when fructose replaces sucrose or glucose in foods or beverages, the claimed effect will be obtained. The panel took into account two human intervention studies(51,52) that showed a consistent significant reduction in post-prandial glycaemic responses. This occurred without disproportionally increasing postprandial insulinaemic res-ponses. Further, the panel noted that the mechanism by which fructose (when replacing sucrose or glucose) in food or beverages could exert the claimed effect was well established.
The panel did note that high intakes of fructose (set at $25 % of total energy) was shown to lead to metabolic complications such as dyslipidaemia, insulin resistance and increased visceral adiposity, based on several review articles(47,53 – 56). With this scientific opinion, and related health claim, the panel clearly took a different position from the opinion that fructose is toxic and should be treated as alcohol.
So, what is the current status concerning the role of fructose-containing SSB that supply glucose along with fructose? Identifying added fructose as a prime cause of obesity can be misleading to the public, as well as policy makers, about the ‘truth of obesity’ in the case that causality remains unproven. Obesity is recognised to be a multiple-factor-related health problem(58), in which life-style factors(59), eating behaviour(60) and socio-economic aspects(61) all play a key role, and fructose intake may be Table 1. Average Western European consumption of the five most
common drink categories, including sugar-sweetened beverages(14) European average yearly consumption (litres per person)
Drink category 2007 2008 2009 2010 2011 2012
Still bottled water 54·0 55·2 55·6 56·3 57·5 58·5
Cola carbonates 28·4 28·7 29·4 30·1 30·7 31·0
Carbonated bottled water 28·2 27·4 27·2 27·1 27·4 27·7
Non-cola carbonates 20·7 20·6 20·8 20·9 20·9 20·9
100 % Juice 12·9 12·5 12·1 11·9 11·5 11·2
Table 2. Average US consumption of the five most common drink categories, including sugar-sweetened beverages(15)
US yearly average consumption (litres per person)
Drink category 2007 2008 2009 2010 2011 2012
Still bottled water 70·3 68·0 66·5 66·2 68·2 70·9
Cola carbonates 71·5 67·9 65·0 62·8 59·5 56·5
Non-cola carbonates 56·1 54·9 54·0 54·9 55·7 55·9
Sports drinks 16·3 15·4 13·9 14·8 17·0 17·3
100 % Juice 16·5 16·4 16·4 15·6 14·8 14·3
just one among several factors involved in its prevalence. At present, there are reasons to believe that isolated reductions in added fructose-containing sugar intake, as recently investigated(62,63), will not lead to a decrease in obesity prevalence. When similar isolated reductions were undertaken concerning added fats(64), the desired overall reduction in fat intake and development of low-fat/light products were not observed(65).
Fructose is considered by some authors to be a signi-ficant culprit for obesity and related disorders based on three categories of arguments:
(1) Arguments that generalise data derived from animal models of obesity (in which sugar overfeeding was used as an experimental tool to increase body weight) as well as human studies in which excessive fructose intakes were used to study the mechanisms of metabolic dysregulation.
(2) Arguments that confuse the relative contents of glucose and fructose in industrially produced food and beverages.
(3) Arguments that underestimate our personal responsibility to remain physically active and to consume a healthy diet.
A plethora of unbalanced reviews on the topic have recently been published(23,66,67), including citations to other reviews instead of addressing the authentic data. In the present review, we therefore look at evidence regarding both positive and negative effects of fructose and fructose-containing sugar sources on obesity, as described in recent peer-reviewed research papers.
Metabolic effects of fructose
In order to study the effects of fructose on metabolism, scientists have generally used dosages high enough to observe some significant effects, mostly in animal studies and sometimes in human intervention research. Based on recent publications(27,56,68,69), we summarise a number of key findings from studies with high to excessive fructose intakes. It is important to note that fructose intake varies between individuals, based on their daily consumption patterns(70). Through a 2008 US survey in 21 483 children and adults, it was found that the mean intake of fructose was 9·7 (standard error of difference 0·1) % of total energy intake, and that 95 % of these sampled individuals consumed less than 19·5 (standard error of difference 0·7) % of fructose as part of their total energy intake(70). Therefore, in the discussion below, we assume fructose intake to be excessive if its pure intake amount is larger than 20 % of daily energy.
Effects of excessive doses of fructose
Already in 1993, researchers(71) agreed that excessive fruc-tose consumption (then defined as 7·5 % to 70 % of total
energy intake) induces immediate de novo lipogenesis in both animals and humans, because, in different exper-imental settings, it circumvented substrate inhibition feed-back mechanisms that are present for glucose when it enters glycolysis. It was shown that the dietary fructose fraction not converted to lactate in the intestinal epithelium was rapidly taken up by the liver, where it was sub-sequently converted first into fructose-1-phosphate, and then to triose-phosphate and pyruvate/lactate. These are both potential substrates for liver glycogen synthesis and for fatty acid production, leading to an increased TAG release from the liver into blood. Also, it was found that fructose stimulated key lipogenic enzymes by activating sterol regulatory element-binding protein-1c (SREBP-1c) in the livers of mice(72).
In addition, it was found that high fructose loads (50 % of total diet) led to an increase in PPARg co-activator 1a and 1b (PGC-1a and PGC-1b) which promoted insulin resist-ance and lipogenesis(73,74), as well as decreased insulin receptor activation and insulin receptor substrate phos-phorylation(75). Subsequently, lipogenesis induced by this high fructose load was associated with the formation of larger fat deposits in adipose tissue and muscle, in animal models(73,74). However, to the best of our knowl-edge, there are no results of long-term human intervention studies available in which comparable quantities of fruc-tose were investigated. One short-term intervention study (96 h) examined the effects of 50 % excess energy as fruc-tose, sucrose or glucose, and indicated that, even under these drastic conditions, de novo lipogenesis remained a minor pathway for fructose disposal in both lean and obese women(76).
Hyperuricaemia may occur as a consequence of rapid fructose entry from portal blood into the liver, where fruc-tose will reduce the total adenosine nucleotide (TAN) pool in liver cells. A degradation of hepatic TAN will result in the production of uric acid. In a within-subjects intervention, this was measured in obese men and women where pure fructose intake provided 30 % of total energy intake(77). Chronic hyperuricaemia was also proposed to act as a promoter of insulin resistance and type 2 diabetes deve-lopment(78). Based on recent findings from in vivo research in fructose-fed rats, it was suggested that uric acid may impair the action of insulin by decreasing insulin-mediated muscle vasodilatation(79). In addition, it may possibly act as an intracellular mediator to enhance hepatic de novo lipogenesis(80). It remains unclear if these metabolic con-sequences can occur in humans considering moderate fructose intake level and complex dietary composition. We will discuss this in detail below.
In older adults consuming fructose daily through SSB, fructose led to stressful conditions in hepatocytes(81) result-ing in the release of TNF-a, a strong pro-inflammatory messenger involved in insulin resistance development(82). Also in rats, excessive fructose intake (. 62 % of total energy)
induced oxidative stress, mitochondrial and endothelial dysfunction, resulting in hypertension(83).
In summary, it appears that excessive fructose intake can have deleterious metabolic effects in both animals and humans.
Disputable interpretations
In contrast to these deleterious effects observed in animal models and in human trials with excessive intakes, the metabolic effects of fructose presented in ordinary human diets remain poorly investigated and highly contro-versial. The assumption that fructose was directly involved in the occurrence of obesity relied on correlation data between the increase in HFCS consumption and obesity prevalence in the USA. This assumption has been considered as misleading for several reasons.
First, the correlation of HFCS and obesity data only happened in North America. In Europe, there was also an increase in obesity prevalence during the same period, but HFCS was not consumed to any significant amount. Moreover, the term HFCS often led individuals to believe that it had a very high fructose content. In fact, the relative proportion of fructose to glucose in HFCS 55 (55 % fructose; used in most soft drinks) and HFCS 42 (42 % fructose; mostly used in non-beverage appli-cations) is not that different from sucrose (50:50 %)(46), although absolute levels as analysed in drinks may vary. In this respect, free fructose content in sucrose-sweetened acid-containing beverages, such as colas, was found to be increased during storage due to acid-induced sucrose hydrolysis(84,85).
A prospective cohort study(86) indicated that higher consumption of SSB was associated with a higher risk of CHD. Additionally, a cross-sectional study(34) and two other cohort studies(87,88)positively associated a reduction in SSB consumption with a reduction of disease risk factors such as elevated blood pressure or weight gain. It should be mentioned, however, that relevant intervention studies with such risk factors as end-point are lacking. Interest-ingly, four large cohort studies showed no relationship between moderate sugar intake and type 2 diabetes(89 – 92). The question of whether the aforementioned effects are really caused by fructose can therefore not be answered by the observational data since these show associations, not causality.
In this respect, it is important to note that through analysis of the same set of data, a positive association between obesity risk and SSB intakes was found without adjustment for total energy intake(93). These outcomes from the modelling analyses may indicate that SSB consumption was not associated with obesity risk if poten-tial impact of total energy intake was accounted for. In this light, a meta-analysis(93), a descriptive time-series study(94) and a cohort study(95) did report a relationship between sugar intake or SSB intake and diabetes, dyslipidaemia
and cardiometabolic risk factors. In all these studies, how-ever, the relationship disappeared when the analysis was adjusted for body weight, strongly suggesting that obesity rather than sugar intake may be the factor associated with the disease status or biomarkers mentioned.
Goran et al.(96) did find that diabetes prevalence was 20 % higher in European Union (EU) countries with a higher availability of HFCS, as compared with countries with low availability. The authors stated that these differ-ences were retained after adjusting for country-level estimates of BMI, population and gross domestic product. An analysis of the study, however, shed an interesting light on the reliability of these findings. The cited HFCS consumption data for the EU countries were, in fact, not consumption data at all but rather production data. In the EU, HFCS travels freely across EU borders and can thus be consumed anywhere. For instance, the article stressed that Hungary consumed significant amounts of HFCS and also showed a higher prevalence of diabetes(97). In reality, most HFCS from Hungary, which was one of Europe’s leading producers of this ingredient, was exported(98). Consumption and production figures are, as such, two entirely different things. Even if export and import figures were accounted for, food spoilage (which can be up to 30 %(99)) makes a serious impact on the above findings. This is also the case in many other epidemiological research papers that have used sugar pro-duction or disappearance data as the bases for correlations with obesity, as well as papers that cite such data for build-ing their arguments. More recently, Basu et al.(100) used food supply data from the UN FAO to capture the market availability of different food items worldwide. From this, the authors concluded that an increase in sugar availability was associated with higher diabetes prevalence after test-ing for potential selection biases and controlltest-ing for other food types, total energy intake, overweight and obesity, period effects, and several socio-economic variables such as ageing, urbanisation and income. As discussed, the market availability of food is a debatable indicator for sugar consumption.
In this respect, a recent New York Times article by Strom(101)pointed out that, due to incorrect methodology, as discussed by Muth(102), US sugar consumption in recent years has been overestimated by . 20 %. Interestingly, the author implied that sugar consumption has not risen sub-stantially since the 1980 s. This makes many assumptions based on higher production or per capita consumption data unsubstantiated. In addition, data obtained from the US National Health and Nutrition Examination Surveys, in 2005 – 2010(21), concluded that total energy from added sugars remained rather constant, or even declined in some segments of the population, in recent years. More-over, the consumption of added sugar through beverages contributed to only one-third of total added sugar intake, indicating that the energy from added sugars mostly came from foods rather than beverages.
Alternative and balancing views
In animal models, excessive-fructose diets lead to hyperphagia, obesity and the development of a metabolic syndrome(27). In human subjects, however, evidence is scarce. Short-term studies that used large amounts of fructose have led to relatively modest changes in meta-bolic profile (including hypertriacylglycerolaemia) and a moderate decrease in hepatic insulin sensitivity and no change in whole-body/muscle insulin resistance(47,103,104). This may suggest that there is a large metabolic plasticity in response to dietary changes and what we observe are minor adjustments of metabolic pathways rather than pathogenic events.
There has been no evidence that relatively high levels of SSB consumption could be associated with obesity, diabetes or cardiometabolic risk in professional athletes who usually consume SSB as energy and dehydration drinks. On the other hand, there is evidence that physical inactivity, even within a few days, causes insulin resistance and dyslipidaemia in normal healthy individuals(105). In this regard, two randomised within-subjects studies in healthy males and females showed that higher plasma TAG concentrations, induced by a high-carbohydrate diet, were completely prevented by physical activity(106,107). Thus, the metabolic consequences of a high mixed glucose – fructose intake can be significantly modulated by exercise. In a narrative review(108), it was reported that high fructose consumption induces insulin resistance, impaired glucose tolerance, hyperinsulinaemia, hypertria-cylglycerolaemia and hypertension in animal models. The data in human subjects, however, were considered less clear. In this respect, fructose consumption, even in large amounts (17 % of total energy), did not result in significant effects in healthy males but did cause these effects in healthy women(109). Moreover, such fructose consumption did not stimulate de novo lipogenesis in premenopausal women(110,111). In a review addressing sugars, insulin sen-sitivity and the postprandial state(112), it was concluded that research on animals, particularly rodents, has shown a clear and consistent effect of sucrose and high-fructose diets in decreasing insulin sensitivity. Again, it was underlined that experiments in human subjects have produced very conflicting results, as there is only limited evidence from human consumption data, using fructose levels of higher than 15 % of daily energy intake, for such an effect on insulin sensitivity.
If it is not fructose, is it just added sugars in a solution?
The suggestion that HFCS is causal to obesity(32,113)cannot explain why overweight and diabetes have also increased over the past decades in regions where HFCS is not (or is hardly being) used in soft drinks (for example, Europe and India), or where SSB consumption is limited (Asia and Africa)(114).
Several reviews and position papers have proposed that SSB are causally related to obesity because energy-containing liquids do not elicit the same satiety signals as energy-containing solid foods(17,115 – 118). This hypothesis was partially supported by studies that showed that sup-plementation with SSB increased body weight, and thus that the intake of energy from other sources was not ade-quately suppressed(62,63). In such studies, however, the cumulated weight gain observed was substantially lower than expected from added SSB energy, indicating that there was at least partial compensation(117,119). This com-pensatory effect and other problems in this research area were highlighted recently by Allison(120) and quantified by Kaiser et al.(20). In their meta-analysis(20), the observed weight gain from six randomised controlled trials in which the effect of SSB on weight gain was tested was compared with the theoretical weight gain in these studies. It was found that the observed data were, on average, 85 % lower than the theoretical weight gain, indicating a high compensation effect. In other words, the effect of added sugars on weight gain was much smaller than the theoreti-cally assumed result. This does not mean that a frequent consumption of SSB does not make an impact on weight gain. It does show, however, that other factors do contri-bute significantly as well.
In a recent cross-sectional study, it was reported that US adolescents, who consumed high amounts of added sugars (20 – 30 % of total energy), had higher blood cholesterol and TAG compared with low sugar consumers (10 – 20 % of total energy)(121). High sugar consumers had similar body weight and total energy intake compared with low sugar consumers, but a lower intake of energy from fat and protein, indicating that sugar intake was at least partially compensated(121). Several smaller studies(122,123) documented that liquid sugar preloads significantly reduce spontaneous food intake at subsequent buffet meals and that fructose was as efficient as glucose – in some instances even more efficient – in this regard.
Thus, these data provide a basis for arguments against the hypothesis that fructose-containing liquids have a different effect on satiety, since all energy-containing beverages seem to have similar effects(124). This has led Moran(125)to conclude that results have been inconsistent and that particular findings concerning the effects of fructose on satiety appear to depend on the timing, eating context and volume of preload relative to the test meal. Another study(126) listed the effect of fructose on body weight in controlled feeding trials. Herein, the authors concluded that fructose does not seem to cause weight gain when it is substituted for other carbohydrates in diets providing similar energy content. In this respect, the question arises whether consuming energy through beverages results in fewer satiety signals compared with energy from solid foods. To answer this, the US 2010 Dietary Guidelines Advisory Committee(127) reviewed the literature and concluded: ‘A limited body of evidence
shows conflicting results about whether liquid and solid foods differ in their effects on energy intake and body weight, except that liquids in the form of soup may lead to decreased energy intake and body weight.’
Most recently, Page et al.(128) performed a study on neurophysiological factors that might underlie associations between fructose consumption and weight gain. For this purpose, twenty healthy adult volunteers underwent two MRI sessions at Yale University in conjunction with fructose or glucose drink ingestion in a blinded, random-order, cross-over design. The authors concluded that glucose but not fructose ingestion reduced the activation of the hypothala-mus, insula and striatum – brain regions that regulate appe-tite, motivation and reward processing. Glucose ingestion also increased functional connections between the hypo-thalamic – striatal network and increased satiety. The dispa-rate responses to fructose were associated with lower systemic levels of the satiety-signalling hormone insulin and were not probably attributable to an inability of fructose to cross the blood – brain barrier into the hypothalamus, or to a lack of hypothalamic expression of genes necessary for fructose metabolism. The authors discussed a number of limitations of this well-designed study, but did not consider the possibility that the observed effects were merely mediated by hyperinsulinaemia present after glucose, but not after fructose, ingestion. They also did not discuss that, in real life, fructose is never consumed as a single carbo-hydrate source but always together with glucose. Thus, diet-ary intakes of sucrose and HFCS all raise insulin levels significantly, and should not induce the observed brain responses to feeding fructose alone.
Fructose and obesity
As discussed, it is generally believed that the consumption of fructose leads to an immediate increase in lipid synthesis in the liver and a subsequent increase in circulating TAG. This assumed relationship between fructose, lipid synthesis and hypertriacylglycerolaemia has been extrapolated to obesity(28,32). However, careful studies in human subjects, using stable isotopes, do not confirm this relationship. Chong(129) observed that, after a load of 0·75 g fructose per kg body weight, the enhanced postprandial elevation of plasma TAG is mainly explained by a small impact of fructose on insulin compared with glucose, reducing TAG clearance, rather than as a result of new synthesised lipids which appeared to be small. Given the fact that about 50 % of a fructose load is converted into glucose, 25 % into lactate, and approximately 15 % into glycogen, de novo lipogenesis is a minor pathway for fructose disposal(56). This is in line with the substantial evidence reviewed by Hellerstein et al.(130), who summarised the evidence as follows:
(1) After consumption of a normal diet, , 3 % of post-absorptive VLDL was estimated to come from sugar;
(2) In the fed state, , 5 – 7 % of VLDL post-absorptive comes from sugar;
(3) When given 250 g fructose within 6 h, , 10 % of the fructose load was converted to lipids, equivalent to ,1 g/h in absolute amounts;
(4) Daily overfeeding with 150 – 200 g fat and 750 – 1000 g carbohydrates led to a de novo synthesis of 5 g fat per d, equivalent to , 3 % of the total fat consumed.
Accordingly, Hellerstein et al.(130)concluded that de novo net lipogenesis, after fructose or sugar consumption, is in fact very small. The explanation for these observations is that the consumed carbohydrates are primarily cleared from the blood, to be oxidised in energy metabolism and/or stored as glycogen, at the expense of fat oxidation which drops due to lipolysis inhibition by insulin and reduced NEFA availability. Thus, only very small amounts of lipids are synthesised after large fructose, sugar or carbohydrate loads, unless extreme carbohydrate over-loading is sustained for several days(131).
Very recently, Sun & Empie(132)reviewed isotopic tracer studies in human subjects. The authors summarised their findings as follows: ‘Fructose is readily absorbed and its absorption is facilitated by the presence of co-ingested glu-cose. Sucrose, honey, 50:50 glucose-fructose mixtures and HFCS all appear to be similarly absorbed. Fructose itself is retained by the liver, while glucose is mainly released into the circulation and utilized peripherally. Plasma levels of fructose are an order of magnitude (10 – 50 folds) lower than circulating glucose, and fructose elicits only a modest insulin response.’ Further, the authors stated that the average oxidation rate of fructose was similar in non-exercising and non-exercising conditions (45·0 and 48·8 %, respectively). Moreover, they underscored that when fruc-tose is ingested together with glucose, the mean oxidation rate of the mixed sugars increased significantly.
In their review, Sun & Empie(132) described the meta-bolic fate of pure fructose based on several studies. Follow-ing 3 – 6 h after Follow-ingestion, on average 41 (SD 10·5) % fructose was converted to glucose. Only a small percentage of ingested fructose (, 1 %) was directly converted to plasma TAG. Approximately one-quarter of ingested fruc-tose was converted into lactate within a few hours. They discussed further that the observed increases in plasma TAG and de novo lipogenesis, as observed in various studies, can arise from both increased lipid synthesis and decreased lipid clearance, and that the relative contri-butions were not addressed in any detail in the available studies. Furthermore, the fate of fructose ingested together with glucose had received little attention so far. In addition, habitual fructose intake, health status (and more specifi-cally insulin resistance), sex, or ethnic/genetic background were all-important factors that may modulate sugar – lipid relationships but had not yet been adequately investigated. Accordingly, the influence of fructose consumption on plasma lipids and de novo lipogenesis remains
sial and understudied and conclusions that fructose is a liver toxin similar to alcohol are certainly premature.
Fructose, uric acid and insulin resistance
In 2009, Johnson et al.(133) hypothesised that excessive fructose intake (. 50 g/d) may be one of the underlying factors in the aetiologies of the metabolic syndrome and type 2 diabetes. The authors suggest that this occurs through mechanisms by which rapidly increased fructose phosphorylation in liver cells results in total adenine nucleotide degradation leading to the liberation of elevated uric acid, leading to higher cardiovascular risk(134). In a study of Sa´nchez-Lozada et al.(135), rats were fed either a combination of 30 % fructose and 30 % glucose or 60 % sucrose, while control rats were fed normal rat chow con-taining 60 % maize starch. Diets concon-taining 30 % of either both free fructose and free glucose, or as the disaccharide sucrose, induced the metabolic syndrome, intra-hepatic accumulation of uric acid and TAG, leading to fatty liver. Relevant for the interpretation of this study is that the level of fructose consumed by the rats was excessive and does not reflect levels consumed by humans.
Another study, by Abdelmalek et al.(91), investigated twenty-five diabetic adults receiving an intravenous fruc-tose challenge. Based on their data, the authors concluded that high fructose consumption depletes hepatic ATP and impairs recovery from ATP depletion after an intravenous fructose challenge. This approach, however, relied on the intravenous administration of . 25 g of pure fructose (250 mg/kg body weight) within 1 min, resulting in a massive hepatic disposal. Similar ATP depletion has also been observed with large oral fructose load, but led to only small increases in uric acid concentrations in healthy subjects(136). However, it has been recently reported that ingestion of even larger amounts of fructose failed to acutely increase uric acid concentration when ingested in split doses throughout several days, suggesting that liver ATP depletion is unlikely to occur with usual patterns of sugar consumption(137).
Lin et al.(138) also observed that fructose consumption resulted in higher serum uric acid levels in individuals with a BMI of . 30 kg/m2. Interestingly, their study showed that there was no effect of fructose intake in the subjects with a BMI between 25 and 29 kg/m2, although serum uric acid showed a trend to be elevated depending on body-weight status. Moreover, the blood samples were drawn after an overnight fast in the morning, ruling out any postprandial effect of fructose ingestion. Accordingly, the effect on serum uric acid was more likely to be secondary to obesity or the metabolic syndrome than to fructose con-sumption per se. In this study, intake was calculated from food frequency recall, which is known to have a low level of accuracy(139). Moreover, food frequency intake data are based on food composition tables that are not controlled for recipe-related changes in food and beverage
products on the market. This double chance of error should not be neglected.
Limited data are available on serum uric acid changes after realistic dietary loads of fructose-containing sugars(140). For example, Akhavan & Anderson(141)tested solutions containing different ratios of glucose and fruc-tose. In their study, overnight-fasted men received a stan-dardised breakfast in the morning. At 4 h later, a 300 kcal (1255 kJ) drink was ingested within 3 min. The solutions were sweetened with either HFCS containing 55 % of fructose, sucrose or the monosaccharide forms of glucose and fructose in specific ratios as follows: 80 % glucose: 20 % fructose (G80:F20), sucrose, G50:F50, G35:F65 and G20:F80. At 75 min, uric acid concentrations were highest after G20:F80. The sucrose and F50:G50 solutions each resulted in significantly lower uric acid concentrations than did the G20:F80 solution, but they did not differ significantly from any other solutions. The uric acid AUC did not differ significantly after the G35:F65, G50:G50 and sucrose solutions. In other research(142), only a weak response of serum uric acid to fructose was found.
Very recently, Wang et al.(143) conducted a systematic review and meta-analysis of controlled fructose-feeding trials. The authors noted that hyperenergetic supplemen-tation of control diets with excessive fructose (þ 35 % excess energy, i.e. 213 – 219 g/d) significantly increased serum uric acid compared with the control diets in non-diabetic participants (mean difference 31·0 (95 % CI 15·4, 46·5) mmol/l). Confounding from excessive energy could not be ruled out in the hyperenergetic trials, because no uric acid-increasing effect of tested fructose, isoenerge-tically exchanged with other carbohydrates, was noted in either the non-diabetic or diabetic trial.
Zgaga et al.(144)recently observed a positive association between plasma uric acid and SSB consumption, but no association with fructose intake, leading the authors to suggest that fructose is not the causal agent underlying the SSB – urate association. In another cross-sectional study(145), it was also concluded that higher dietary fructose intake was not associated with a higher hyper-uricaemia risk in healthy adults. This is in line with the results of a meta-analysis(146) and review(147) that refuted the relationship between normal dietary consumption of sugars containing fructose and diabetes.
Final considerations
As discussed, recent findings suggest that high or excessive fructose intake can induce certain metabolic alterations in both animal and human models. In this respect, thoughts regarding the potential harmfulness of excessive fructose and fructose-containing sugar intakes seem legitimate, especially in view of the high SSB consumption and the burdens of obesity and type 2 diabetes.
Based on the currently available data, however, any statement that ordinary fructose intake is toxic and that
consumption of fructose-containing drinks are the leading cause of the global obesity epidemic is not supported by scientific consensus. We wish to highlight the findings of Gibson(148), who re-examined the evidence from forty observational and four intervention studies, as well as six reviews. She noted that the totality of the evidence was dominated by American studies and that most studies suggest that the effect of SSB is small except in susceptible individuals, involving genetic predispositions, psychologi-cal factors and environmental stimuli(149), or at excessive levels of intake (. 20 % of total energy). She reported that progress in reaching a definitive conclusion on the role of SSB in obesity is hampered by the paucity of good-quality interventions, which reliably monitor diet and lifestyle and adequately report effect sizes. Of the three long-term (6 months) interventions, one reported a decrease in obesity prevalence but no change in mean BMI and two found a significant impact only among chil-dren already overweight at baseline. Of the six reviews, two concluded that the evidence was strong, one that an association was probable, while three described it as inconclusive, equivocal or near zero.
Noteworthy is the study of Pollock et al.(150), who observed in adolescents that higher fructose consumption is associated with multiple markers of cardiometabolic risk, but when visceral adipose tissue was included as a covariate, it attenuated these associations and showed that these relationships were mediated by visceral obesity. Also, Rizkalla(27) concluded that ‘no fully relevant data have been presented to account for a direct link between dietary fructose intake and health risk markers’. A re-evaluation of published epidemiological studies concerning the consumption of dietary fructose or mainly HFCS showed that most of these studies have been cross-sectional or based on passive inaccurate surveillance, especially in children and adolescents(151), and thus have not established direct causal links. Research evidence of the short- or acute-term satiating power or increasing food intake after fructose consumption as compared with that resulting from normal patterns of sugar consumption, such as sucrose, remains unclear. Further, the negative conclusions regarding fructose have been drawn from studies in rodents or in human subjects attempting to elucidate the mechanisms and biological pathways under-lying fructose consumption by using unrealistically high amounts of pure fructose. In this respect, we also want to draw attention to the results of a data analysis by Livesey(152) who, based on the data of several large cohorts, concluded as follows:
‘Fructose is proving to have bidirectional effects. At moderate or high doses, an effect on any one marker may be absent or even the opposite of that observed at very high or excessive doses; examples include fasting plasma triglyceride, insulin sensitivity, and the putative marker uric acid. Among markers, changes can be ben-eficial for some (e.g., glycated hemoglobin at moderate
to high fructose intake) but adverse for others (e.g., plasma triglycerides at very high or excessive fructose intake). Evidence on body weight indicates no effect of moderate to high fructose intakes, but information is scarce for high or excessive intakes. The overall balance of such beneficial and adverse effects of fructose is difficult to assess but has important implications for the strength and direction of hypotheses about public health, the relevance of some animal studies, and the interpretation of both interventional and epidemiological studies. By focusing on the adverse effects of very high and excessive doses, we risk not noticing the potential benefits of mode-rate to higher doses, which might modemode-rate the advent and progress of type-2 diabetes, cardiovascular disease, and might even contribute to longevity.’(152)
Conclusion
Through multiple misconceptions about fructose and fructose-containing sugars, a causal role of their intake has been proposed in the aetiology of the global obesity epidemic. However, current evidence on the metabolic effects of fructose, as consumed by the majority of popu-lations, is insufficient to demonstrate such a role in meta-bolic diseases and the global obesity epidemic.
Given the impact of obesity and related metabolic diseases on health care costs, practical steps to prevent their development are obviously required. Nevertheless, implementing taxes on sugary foods and beverages as suggested is not supported by solid scientific evidence, and can be expected to be largely insufficient to address the whole issue of energy overconsumption(153,154). In this respect, one may rather aim at reducing the consump-tion of energy-dense foods, which represent a large panel of sweet and salted foods made largely available in shops, fast foods and restaurants. The food production and service industries would be welcome to play a responsible role by gradually limiting the amount of fat and added sugars in ready-to-eat or to-drink products to reduce energy density. In addition, effective policies that facilitate and promote healthier diets and nutritious food alternatives should be publicly promoted.
Acknowledgements
We thank the two anonymous reviewers for their thorough review. We highly appreciate their comments and sugges-tions, which significantly contributed to improving the quality of the final article. In addition, we thank Melissa Chung, Health Food Innovation Management MSc student, Maastricht University, for her editorial feedback.
The present review was funded by an independent research grant of the research foundation Stichting Wetenschappelijk Onderwijs Limburg (SWOL; The Limburg University Fund) of Maastricht University, the Netherlands.
SWOL had no role in the design, analysis or writing of this article.
F. J. P. H. B. and L. T. initiated the literature research. F. J. P. H. B. wrote the paper. V. J. v. B. was primary responsible for final editing, and F. J. P. H. B. and V. J. v. B. were primary responsible for final content. All authors read and analysed the cited literature, and all authors read and approved the final manuscript.
The authors declare no conflicts of interest and received no grant from industry. They had no interaction with the food and beverage industry with respect to the contents of this article. F. J. P. H. B. performed research on oral rehydration beverages containing sugars during his PhD studies and during his period at Sandoz-Nutrition from 1984 to 1999, and on low-glycaemic sugars and carbo-hydrates in the period of his employment at Cerestar and Cargill between 1999 and 2008. F. J. P. H. B. chaired the Carbohydrate Task Force at ILSI Europe in the period of 1998 – 2003. Since 2008 F. J. P. H. B. has been an inde-pendent researcher.
References
1. Bleich SN, Wang YC, Wang Y, et al. (2009) Increasing
consumption of sugar-sweetened beverages among
US adults: 1988-1994 to 1999-2004. Am J Clin Nutr 89, 372 – 381.
2. Duffey KJ & Popkin BM (2012) Shifts in patterns and
consumption of beverages between 1965 and 2002. Obesity 15, 2739 – 2747.
3. Nielsen SJ & Popkin BM (2004) Changes in beverage intake
between 1977 and 2001. Am J Prev Med 27, 205 – 210.
4. Popkin BM & Nielsen SJ (2012) The sweetening of the
world’s diet. Obes Res 11, 1325 – 1332.
5. Nielsen SJ, Siega-Riz AM & Popkin BM (2012) Trends in
energy intake in US between 1977 and 1996: similar shifts seen across age groups. Obes Res 10, 370 – 378.
6. Storey ML, Forshee RA & Anderson PA (2006) Beverage
consumption in the US population. J Am Diet Assoc 106, 1992 – 2000.
7. Wang YC, Gortmaker SL, Sobol AM, et al. (2006) Estimating
the energy gap among US children: a counterfactual approach. Pediatrics 118, e1721 – e1733.
8. Euromonitor International (2011) Soft drink consumption –
global. Euromonitor Passport GMID database. http://www. euromonitor.com/passport
9. Young LR & Nestle M (2003) Expanding portion sizes in the
US marketplace: implications for nutrition counseling. J Am Diet Assoc 103, 231 – 234.
10. Wang YC, Bleich SN & Gortmaker SL (2008) Increasing
caloric contribution from sugar-sweetened beverages and 100% fruit juices among US children and adolescents, 1988-2004. Pediatrics 121, e1604 – e1614.
11. Welsh JA, Sharma AJ, Grellinger L, et al. (2011)
Consump-tion of added sugars is decreasing in the United States. Am J Clin Nutr 94, 726 – 734.
12. Euromonitor International (2013) Bottled water
consump-tion – global. Euromonitor Passport GMID database. http://www.euromonitor.com/passport
13. Ogden CL, Carroll MD, Kit BK, et al. (2012) Prevalence of
obesity and trends in body mass index among US children and adolescents, 1999-2010. JAMA 307, 483 – 490.
14. Euromonitor International (2013) Soft drink consumption
per category – Western Europe. Euromonitor Passport GMID database. http://www.euromonitor.com/passport
15. Euromonitor International (2013) Soft drink consumption
per category – North America: USA. Euromonitor Passport GMID database. http://www.euromonitor.com/passport
16. Malik VS, Schulze MB & Hu FB (2006) Intake of
sugar-sweetened beverages and weight gain: a systematic review. Am J Clin Nutr 84, 274 – 288.
17. Hu FB & Malik VS (2010) Sugar-sweetened beverages and
risk of obesity and type 2 diabetes: epidemiologic evidence. Physiol Behav 100, 47 – 54.
18. Ambrosini GL, Oddy WH, Huang RC, et al. (2013)
Prospec-tive associations between sugar-sweetened beverage
intakes and cardiometabolic risk factors in adolescents. Am J Clin Nutr 98, 327 – 334.
19. Agostoni C, Bresson JL, Fairweather-Tait S, et al. (2010)
Scientific opinion on dietary reference values for carbo-hydrates and dietary fibre. EFSA J 8, 1462 – 1539.
20. Kaiser K, Shikany J, Keating K, et al. (2013) Will reducing
sugar-sweetened beverage consumption reduce obesity? Evidence supporting conjecture is strong, but evidence when testing effect is weak. Obes Rev 14, 620 – 633.
21. Ervin R & Ogden C (2013) Consumption of added
sugars among U.S. adults, 2005-2010. NCHS Data Brief 122, 1 – 8.
22. Lustig RH, Schmidt LA & Brindis CD (2012) Public health:
the toxic truth about sugar. Nature 482, 27 – 29.
23. Lustig RH (2010) Fructose: metabolic, hedonic, and
societal parallels with ethanol. J Am Diet Assoc 110, 1307 – 1321.
24. Johnson RJ, Lanaspa MA & Sanchez-lozada LG (2012)
Effects of excessive fructose intake on health. Ann Intern Med 156, 905 – 906.
25. Melanson KJ, Angelopoulos TJ, Nguyen V, et al. (2008)
High-fructose corn syrup, energy intake, and appetite regu-lation. Am J Clin Nutr 88, 1738S – 1744S.
26. Perez-Pozo S, Schold J, Nakagawa T, et al. (2009) Excessive
fructose intake induces the features of metabolic syndrome in healthy adult men: role of uric acid in the hypertensive response. Int J Obes 34, 454 – 461.
27. Rizkalla SW (2010) Health implications of fructose
con-sumption: a review of recent data. Nutr Metab (Lond) 7, 82.
28. Bray GA (2008) Fructose: should we worry? Int J Obes 32,
S127 – S131.
29. Bray GA (2008) Fructose - how worried should we be?
Medscape J Med 10, 159.
30. Bray GA (2012) Fructose and risk of cardiometabolic
disease. Curr Atheroscler Rep 14, 570 – 578.
31. Bray GA (2013) Potential health risks from beverages
containing fructose found in sugar or high-fructose corn syrup. Diabetes Care 36, 11 – 12.
32. Bray GA, Nielsen SJ & Popkin BM (2004) Consumption of
high-fructose corn syrup in beverages may play a role in the epidemic of obesity. Am J Clin Nutr 79, 537 – 543.
33. Brown C, Dulloo A & Montani J (2008) Sugary drinks in the
pathogenesis of obesity and cardiovascular diseases. Int J Obes 32, S28 – S34.
34. Brown IJ, Stamler J, Van Horn L, et al. (2011)
Sugar-sweetened beverage, sugar intake of individuals, and their blood pressure: International Study of Macro/Micronutrients and Blood Pressure. Hypertension 57, 695 – 701.
35. Malik VS & Hu FB (2012) Sweeteners and risk of obesity and
type 2 diabetes: the role of sugar-sweetened beverages. Curr Diab Rep 12, 195 – 203.
36. Popkin BM (2012) Sugary beverages represent a threat to
global health. Trends Endocrinol Metab 23, 591 – 593.
37. Klurfeld DM (2013) What do government agencies consider in the debate over added sugars? Adv Nutr 4, 257 – 261.
38. Elbel B, Cantor J & Mijanovich T (2012) Potential effect
of the New York City policy regarding sugared beverages. N Engl J Med 367, 680 – 681.
39. Caprio S (2012) Calories from soft drinks - do they matter?
N Engl J Med 367, 1462 – 1463.
40. Anonymous (2012) Regulation of sugar-sweetened
beverages. N Engl J Med 367, 1464 – 1466.
41. Chaufan C, Hong GH & Fox P (2009) Taxing “sin foods”
-obesity prevention and public health policy. N Engl J Med 361, e113.
42. Pomeranz JL & Brownell KD (2012) Portion sizes and
beyond - government’s legal authority to regulate food-industry practices. N Engl J Med 367, 1383 – 1385.
43. Cohen DA & Babey SH (2012) Candy at the cash register - a
risk factor for obesity and chronic disease. N Engl J Med 367, 1381 – 1383.
44. Just DR & Payne CR (2009) Obesity: can behavioral
eco-nomics help? Ann Behav Med 38, 47 – 55.
45. Wansink B, Hanks A & Just D (2012) et al. From Coke
to Coors: a field study of a sugar-sweetened beverage tax and its unintended consequences. Social Science Research Network [serial on the Internet]. http://ssrn.com/ abstract¼2079840
46. White JS (2008) Straight talk about high-fructose corn
syrup: what it is and what it ain’t. Am J Clin Nutr 88, 1716S – 1721S.
47. Leˆ K-A & Tappy L (2006) Metabolic effects of fructose. Curr
Opin Clin Nutr Metab Care 9, 469 – 475.
48. Bogdanov S, Jurendic T, Sieber R, et al. (2008) Honey
for nutrition and health: a review. J Am Coll Nutr 27, 677 – 689.
49. Casazza K, Fontaine KR, Astrup A, et al. (2013) Myths,
presumptions, and facts about obesity. N Engl J Med 368, 446 – 454.
50. Agostoni C, Bresson JL, Fairweather-Tait S, et al. (2011)
Scientific opinion on the substantiation of health claims related to fructose and reduction of post-prandial glycaemic responses (ID 558) pursuant to Article 13(1) of Regulation (EC) no 1924/2006. EFSA J 9, 2223 – 2238.
51. Bantle JP, Laine DC, Castle GW, et al. (1983) Postprandial
glucose and insulin responses to meals containing different carbohydrates in normal and diabetic subjects. N Engl J Med 309, 7 – 12.
52. Crapo PA, Kolterman OG & Olefsky JM (1980) Effects
of oral fructose in normal, diabetic, and impaired glucose tolerance subjects. Diabetes Care 3, 575 – 581.
53. Stanhope KL & Havel PJ (2008) Endocrine and metabolic
effects of consuming beverages sweetened with fructose, glucose, sucrose, or high-fructose corn syrup. Am J Clin Nutr 88, 1733S – 1737S.
54. Stanhope KL, Schwarz JM, Keim NL, et al. (2009)
Consum-ing fructose-sweetened, not glucose-sweetened, beverages increases visceral adiposity and lipids and decreases insulin sensitivity in overweight/obese humans. J Clin Invest 119, 1322 – 1324.
55. Stanhope KL & Havel PJ (2010) Fructose consumption:
recent results and their potential implications. Ann N Y Acad Sci 1190, 15 – 24.
56. Tappy L & Leˆ K-A (2010) Metabolic effects of fructose and
the worldwide increase in obesity. Physiol Rev 90, 23 – 46.
57. Vasankari TJ & Vasankari TM (2006) Effect of dietary
fructose on lipid metabolism, body weight and glucose tolerance in humans. Food Nutr Res 50, 55 – 63.
58. Grundy SM (1998) Multifactorial causation of obesity:
impli-cations for prevention. Am J Clin Nutr 67, 563S – 572S.
59. Martinez-Gonzalez M, Alfredo Martinez J, Hu F, et al. (1999)
Physical inactivity, sedentary lifestyle and obesity in the European Union. Int J Obes 23, 1192 – 1201.
60. Torres SJ & Nowson CA (2007) Relationship between stress,
eating behavior, and obesity. Nutrition 23, 887 – 894.
61. Sobal J & Stunkard AJ (1989) Socioeconomic status and
obesity: a review of the literature. Psychol Bull 105, 260 – 275.
62. de Ruyter JC, Olthof MR, Seidell JC, et al. (2012) A trial
of sugar-free or sugar-sweetened beverages and body weight in children. N Engl J Med 367, 1397 – 1406.
63. Ebbeling CB, Feldman HA, Chomitz VR, et al. (2012) A
ran-domized trial of sugar-sweetened beverages and adolescent body weight. N Engl J Med 367, 1407 – 1416.
64. Golay A & Bobbioni E (1997) The role of dietary fat in
obesity. Int J Obes Relat Metab Disord 21, S2.
65. Allais O, Bertail P & Niche`le V (2010) The effects of a fat tax
on French households’ purchases: a nutritional approach. Am J Agric Econ 92, 228 – 245.
66. Gaby AR (2005) Adverse effects of dietary fructose. Altern
Med Rev 10, 294.
67. Parker K, Salas M & Nwosu VC (2010) High fructose
corn syrup: production, uses and public health concerns. Biotechnol Mol Biol Rev 5, 71 – 78.
68. Havel PJ (2008) Dietary fructose: implications for
dys-regulation of energy homeostasis and lipid/carbohydrate metabolism. Nutr Rev 63, 133 – 157.
69. Hallfrisch J (1990) Metabolic effects of dietary fructose.
FASEB J 4, 2652 – 2660.
70. Vos MB, Kimmons JE, Gillespie C, et al. (2008) Dietary
fructose consumption among US children and adults: the Third National Health and Nutrition Examination Survey. Medscape J Med 10, 160.
71. Mayes PA (1993) Intermediary metabolism of fructose. Am J
Clin Nutr 58, 754S – 765S.
72. Shimomura I, Matsuda M, Hammer RE, et al. (2000)
Decreased IRS-2 and increased SREBP-1c lead to mixed insulin resistance and sensitivity in livers of lipodystrophic and ob/ob mice. Mol Cell 6, 77 – 86.
73. Rizkalla SW, Luo J, Guilhem I, et al. (1992) Comparative
effects of 6 week fructose, dextrose and starch feeding on fat-cell lipolysis in normal rats: effects of isoproterenol, theophylline and insulin. Mol Cell Biochem 109, 127 – 132.
74. Havel PJ (1997) Glucose but not fructose infusion increases
circulating leptin in proportion to adipose stores in rhesus monkeys. Exp Clin Endocrinol Diabetes 105, 37 – 38.
75. Puigserver P & Spiegelman BM (2003) Peroxisome
pro-liferator-activated receptor-g coactivator 1a (PGC-1a): transcriptional coactivator and metabolic regulator. Endocr Rev 24, 78 – 90.
76. McDevitt RM, Bott SJ, Harding M, et al. (2001) De novo
lipogenesis during controlled overfeeding with sucrose or glucose in lean and obese women. Am J Clin Nutr 74, 737 – 746.
77. Teff KL, Grudziak J, Townsend RR, et al. (2009) Endocrine
and metabolic effects of consuming fructose- and glucose-sweetened beverages with meals in obese men and women: influence of insulin resistance on plasma triglycer-ide responses. J Clin Endocrinol Metab 94, 1562 – 1569.
78. Vuorinen-Markkola H & Yki-Ja¨rvinen H (1994)
Hyperurice-mia and insulin resistance. J Clin Endocrinol Metab 78, 25 – 29.
79. Nakagawa T, Hu H, Zharikov S, et al. (2006) A causal role
for uric acid in fructose-induced metabolic syndrome. Am J Physiol 290, F625 – F631.
80. Lanaspa MA, Sanchez-Lozada LG, Cicerchi C, et al. (2012)
Uric acid stimulates fructokinase and accelerates fructose
metabolism in the development of fatty liver. PLOS ONE 7, e47948.
81. Abdelmalek MF, Suzuki A, Guy C, et al. (2010) Increased
fructose consumption is associated with fibrosis severity in patients with nonalcoholic fatty liver disease. Hepatology 51, 1961 – 1971.
82. Togashi N, Ura N, Higashiura K, et al. (2000) The
contri-bution of skeletal muscle tumor necrosis factor-a to insulin resistance and hypertension in fructose-fed rats. J Hypertens 18, 1605 – 1610.
83. Bezerra RM, Ueno M, Silva MS, et al. (2000) A high fructose
diet affects the early steps of insulin action in muscle and liver of rats. J Nutr 130, 1531 – 1535.
84. Babsky NE, Toribio JL & Lozano JE (1986) Influence of
storage on the composition of clarified apple juice concen-trate. J Food Sci 51, 564 – 567.
85. Ventura EE, Davis JN & Goran MI (2010) Sugar content
of popular sweetened beverages based on objective laboratory analysis: focus on fructose content. Obesity 19, 868 – 874.
86. Fung TT, Malik V, Rexrode KM, et al. (2009) Sweetened
beverage consumption and risk of coronary heart disease in women. Am J Clin Nutr 89, 1037 – 1042.
87. Chen L, Caballero B, Mitchell DC, et al. (2010)
Reducing consumption of sugar-sweetened beverages is associated with reduced blood pressure a prospective study among United States adults. Circulation 121, 2398 – 2406.
88. Dhingra R, Sullivan L, Jacques PF, et al. (2007) Soft drink
consumption and risk of developing cardiometabolic risk factors and the metabolic syndrome in middle-aged adults in the community. Circulation 116, 480 – 488.
89. Meyer KA, Kushi LH, Jacobs DR, et al. (2000)
Carbo-hydrates, dietary fiber, and incident type 2 diabetes in older women. Am J Clin Nutr 71, 921 – 930.
90. Janket S-J, Manson JE, Sesso H, et al. (2003) A prospective
study of sugar intake and risk of type 2 diabetes in women. Diabetes Care 26, 1008 – 1015.
91. Abdelmalek MF, Lazo M, Horska A, et al. (2012) Higher
dietary fructose is associated with impaired hepatic adeno-sine triphosphate homeostasis in obese individuals with type 2 diabetes. Hepatology 56, 952 – 960.
92. Paynter NP, Yeh H-C, Voutilainen S, et al. (2006) Coffee
and sweetened beverage consumption and the risk of type 2 diabetes mellitus. Am J Epidemiol 164, 1075 – 1084.
93. Forshee RA, Anderson PA & Storey ML (2008)
Sugar-sweetened beverages and body mass index in children and adolescents: a meta-analysis. Am J Clin Nutr 87, 1662 – 1671.
94. Duffey KJ & Popkin BM (2008) High-fructose corn
syrup: is this what’s for dinner? Am J Clin Nutr 88, 1722S – 1732S.
95. de Koning L, Malik VS, Rimm EB, et al. (2011)
Sugar-sweetened and artificially Sugar-sweetened beverage consump-tion and risk of type 2 diabetes in men. Am J Clin Nutr 93, 1321 – 1327.
96. Goran MI, Ulijaszek SJ & Ventura EE (2012) High fructose
corn syrup and diabetes prevalence: a global perspective. Glob Public Health 8, 55 – 64.
97. Kmietowicz Z (2012) Countries that use large amounts
of high fructose corn syrup have higher rates of type 2 diabetes. BMJ 345, e7994.
98. European Commission (2012) Production data of
HFCS (isoglucose) in the EU [database on the Internet]. http://ec.europa.eu/agriculture/sugar/balance-sheets/balance-sheet_en.pdf (accessed 27 March 2013)
99. Gustavsson J, Cederberg C, Sonesson U, et al (2011) Global
Food Losses and Food Waste. Rome: UNFAO.
100. Basu S, Yoffe P, Hills N, et al. (2013) The relationship of
sugar to population-level diabetes prevalence: an econo-metric analysis of repeated cross-sectional data. PLOS ONE 8, e57873.
101. Strom S (2012) U.S. cuts estimate of sugar intake. New York
Times, 27 October 2012, section B1. http://www.nytimes. com/2012/10/27/business/us-cuts-estimate-of-sugar-intake-of-typical-american.html?_r¼0 (accessed February 2014).
102. Muth MK (2011) Consumer-Level Food Loss Estimates and
Their Use in the ERS Loss-Adjusted Food Availability Data. Darby, PA: Diane Publishing.
103. Leˆ K-A, Ith M, Kreis R, et al. (2009) Fructose
overconsump-tion causes dyslipidemia and ectopic lipid deposioverconsump-tion in healthy subjects with and without a family history of type 2 diabetes. Am J Clin Nutr 89, 1760 – 1765.
104. Faeh D, Minehira K, Schwarz J-M, et al. (2005) Effect of
fructose overfeeding and fish oil administration on hepatic de novo lipogenesis and insulin sensitivity in healthy men. Diabetes 54, 1907 – 1913.
105. Hamburg NM, McMackin CJ, Huang AL, et al. (2007)
Physi-cal inactivity rapidly induces insulin resistance and micro-vascular dysfunction in healthy volunteers. Arterioscler Thromb Vasc Biol 27, 2650 – 2656.
106. Egli L, Lecoultre V, Theytaz F, et al. (2013) Exercise prevents
fructose-induced hypertriglyceridemia in healthy young subjects. Diabetes 62, 2259 – 2265.
107. Koutsari C, Karpe F, Humphreys SM, et al. (2001) Exercise
prevents the accumulation of triglyceride-rich
lipo-proteins and their remnants seen when changing to a high-carbohydrate diet. Arterioscler Thromb Vasc Biol 21, 1520 – 1525.
108. Elliott SS, Keim NL, Stern JS, et al. (2002) Fructose, weight
gain, and the insulin resistance syndrome. Am J Clin Nutr 76, 911 – 922.
109. Bantle JP, Raatz SK, Thomas W, et al. (2000) Effects of
diet-ary fructose on plasma lipids in healthy subjects. Am J Clin Nutr 72, 1128 – 1134.
110. Couchepin C, Leˆ K-A, Bortolotti M, et al. (2008) Markedly
blunted metabolic effects of fructose in healthy young female subjects compared with male subjects. Diabetes Care 31, 1254 – 1256.
111. Tran C, Jacot-Descombes D, Lecoultre V, et al. (2010) Sex
differences in lipid and glucose kinetics after ingestion of an acute oral fructose load. Br J Nutr 104, 1139 – 1147.
112. Daly M (2003) Sugars, insulin sensitivity, and the
postpran-dial state. Am J Clin Nutr 78, 865S – 872S.
113. Lakhan SE (2013) Kirchgessner A The emerging role of
dietary fructose in obesity and cognitive decline. Nutr J 12, 114.
114. Klurfeld D, Foreyt J, Angelopoulos T, et al. (2013) Lack of
evidence for high fructose corn syrup as the cause of the obesity epidemic. Int J Obes 37, 771 – 773.
115. DiMeglio DP & Mattes RD (2000) Liquid versus solid
carbo-hydrate: effects on food intake and body weight. Int J Obes 24, 794 – 800.
116. Melanson KJ, Zukley L, Lowndes J, et al. (2007) Effects
of high-fructose corn syrup and sucrose consumption on circulating glucose, insulin, leptin, and ghrelin and on appetite in normal-weight women. Nutrition 23, 103 – 112.
117. Mærsk M, Belza A, Holst JJ, et al. (2012) Satiety scores and
satiety hormone response after sucrose-sweetened soft drink compared with isocaloric semi-skimmed milk and with non-caloric soft drink: a controlled trial. Eur J Clin Nutr 66, 523 – 529.
118. Soenen S & Westerterp-Plantenga MS (2007) No differences in satiety or energy intake after high-fructose corn syrup, sucrose, or milk preloads. Am J Clin Nutr 86, 1586 – 1594.
119. Reid M, Hammersley R, Duffy M, et al. (2014) Effects on
obese women of the sugar sucrose added to the diet over 28 d: a quasi-randomised, single-blind, controlled trial. Br J Nutr 111, 563 – 570.
120. Allison DB (2014) Liquid calories, energy compensation
and weight: what we know and what we still need to learn. Br J Nutr 111, 384 – 386.
121. Welsh JA, Sharma A, Cunningham SA, et al. (2011)
Con-sumption of added sugars and indicators of cardiovascular disease risk among US adolescents: clinical perspective. Circulation 123, 249 – 257.
122. Rodin J (1990) Comparative effects of fructose, aspartame,
glucose, and water preloads on calorie and macronutrient intake. Am J Clin Nutr 51, 428 – 435.
123. Rodin J, Reed D & Jamner L (1988) Metabolic effects of
fructose and glucose: implications for food intake. Am J Clin Nutr 47, 683 – 689.
124. Te Morenga L, Mallard S & Mann J (2013) Dietary sugars
and body weight: systematic review and meta-analyses of randomised controlled trials and cohort studies. BMJ 346, e7492.
125. Moran TH (2009) Fructose and satiety. J Nutr 139,
1253S – 1256S.
126. Sievenpiper JL, de Souza RJ & Jenkins DJ (2012) Sugar: fruit
fructose is still healthy. Nature 482, 470.
127. Slavin J (2012) Beverages and body weight: challenges in
the evidence-based review process of the Carbohydrate Subcommittee from the 2010 Dietary Guidelines Advisory Committee. Nutr Rev 70, S111 – S120.
128. Page KA, Chan O, Arora J, et al. (2013) Effects of fructose vs
glucose on regional cerebral blood flow in brain regions involved with appetite and reward pathways fructose con-sumption and weight gain. JAMA 309, 63 – 70.
129. Chong MF, Fielding BA & Frayn KN (2007) Mechanisms for
the acute effect of fructose on postprandial lipemia. Am J Clin Nutr 85, 1511 – 1520.
130. Hellerstein MK, Schwarz J-M & Neese RA (1996) Regulation
of hepatic de novo lipogenesis in humans. Annu Rev Nutr 16, 523 – 557.
131. Acheson K, Schutz Y, Bessard T, et al. (1988) Glycogen
storage capacity and de novo lipogenesis during massive carbohydrate overfeeding in man. Am J Clin Nutr 48, 240 – 247.
132. Sun SZ & Empie MW (2012) Fructose metabolism in
humans - what isotopic tracer studies tell us. Nutr Metab 9, 89.
133. Johnson RJ, Perez-Pozo SE, Sautin YY, et al. (2009)
Hypo-thesis: could excessive fructose intake and uric acid cause type 2 diabetes? Endocr Rev 30, 96 – 116.
134. Feig DI, Kang D-H & Johnson RJ (2008) Uric acid and
cardiovascular risk. N Engl J Med 359, 1811 – 1821.
135. Sa´nchez-Lozada LG, Mu W, Roncal C, et al. (2010)
Com-parison of free fructose and glucose to sucrose in the ability to cause fatty liver. Eur J Nutr 49, 1 – 9.
136. Oberhaensli R, Taylor D, Rajagopalan B, et al. (1987) Study
of hereditary fructose intolerance by use of 31P magnetic resonance spectroscopy. Lancet 330, 931 – 934.
137. Lecoultre V, Egli L, Theytaz F, et al. (2013) Fructose-induced
hyperuricemia is associated with a decreased renal uric acid excretion in humans. Diabetes Care 36, e149 – e150.
138. Lin W, Huang H, Huang M, et al. (2012) Effects on uric acid,
body mass index and blood pressure in adolescents of consuming beverages sweetened with high-fructose corn syrup. Int J Obes 37, 532 – 539.
139. Dodd KW, Guenther PM, Freedman LS, et al. (2006)
Statisti-cal methods for estimating usual intake of nutrients and foods: a review of the theory. J Am Diet Assoc 106, 1640 – 1650.
140. Angelopoulos TJ, Lowndes J, Zukley L, et al. (2009) The
effect of high-fructose corn syrup consumption on trigly-cerides and uric acid. J Nutr 139, 1242S – 1245S.
141. Akhavan T & Anderson GH (2007) Effects of
glucose-to-fructose ratios in solutions on subjective satiety, food intake, and satiety hormones in young men. Am J Clin Nutr 86, 1354 – 1363.
142. Buemann B, Toubro S, Holst JJ, et al. (2000) d-Tagatose,
a stereoisomer of d-fructose, increases blood uric acid concentration. Metabolism 49, 969 – 976.
143. Wang DD, Sievenpiper JL, de Souza RJ, et al. (2012) The
effects of fructose intake on serum uric acid vary among controlled dietary trials. J Nutr 142, 916 – 923.
144. Zgaga L, Theodoratou E, Kyle J, et al. (2012) The
association of dietary intake of purine-rich vegetables, sugar-sweetened beverages and dairy with plasma urate, in a cross-sectional study. PLOS ONE 7, e38123.
145. Sun SZ, Flickinger BD, Williamson-Hughes PS, et al. (2010)
Lack of association between dietary fructose and hyper-uricemia risk in adults. Nutr Metab (Lond) 7, 16.
146. Livesey G & Taylor R (2008) Fructose consumption
and consequences for glycation, plasma triacylglycerol, and body weight: meta-analyses and meta-regression models of intervention studies. Am J Clin Nutr 88, 1419 – 1437.
147. Livesey G (2013) Is there really a link between diabetes and
the ingestion of fructose? Nutr Bull 38, 337 – 343.
148. Gibson S (2008) Sugar-sweetened soft drinks and obesity:
a systematic review of the evidence from observational studies and interventions. Nutr Res Rev 21, 134 – 147.
149. Ebbeling CB, Feldman HA, Osganian SK, et al. (2006)
Effects of decreasing sugar-sweetened beverage consump-tion on body weight in adolescents: a randomized, con-trolled pilot study. Pediatrics 117, 673 – 680.
150. Pollock NK, Bundy V, Kanto W, et al. (2012) Greater
fruc-tose consumption is associated with cardiometabolic risk markers and visceral adiposity in adolescents. J Nutr 142, 251 – 257.
151. Cullen KW, Ash DM, Warneke C, et al. (2002) Intake of soft
drinks, fruit-flavored beverages, and fruits and vegetables by children in grades 4 through 6. Am J Public Health 92, 1475 – 1477.
152. Livesey G (2009) Fructose ingestion: dose-dependent
responses in health research. J Nutr 139, 1246S – 1252S.
153. Sievenpiper JL & de Souza RJ (2013) Are sugar-sweetened
beverages the whole story? Am J Clin Nutr 98, 261 – 263.
154. Tappy L & Mittendorfer B (2012) Fructose toxicity: is the
science ready for public health actions? Curr Opin Clin Nutr Metab Care 15, 357 – 361.