Ethnic Fractionalisation and Aid
Effectiveness
Roland Hodlera,b,c,* and David S. Knightb
aDepartment of Economics, University of Lucerne, CH-6002 Lucerne, Switzerland bDepartment of Economics, University of Melbourne, VIC 3110, Australia cStudy Center Gerzensee, CH-3115 Gerzensee, Switzerland
* Corresponding author: Roland Hodler. Telephone:+41 41 229 57 22. Fax: +41 41 229 55 01. E-mail: [email protected]
Abstract
We test the hypothesis that the effect of foreign aid on economic growth is positive in ethnically homogenous countries, but decreasing in ethnic frac-tionalisation. Using panel data covering 114 aid-recipient countries over the period 1962 to 2001, and employing two-stage least squares and GMM estimation techniques, we find a strong support for this hypothesis. Our estimates suggest that foreign aid promotes growth in ethnically homogenous countries, while being ineffective or even harmful in many Sub-Saharan African countries and some ethnically fractionalised countries elsewhere.
JEL classification: C23, F35, F43, O11
1. Introduction
Economists and political activists from Jeffrey Sachs to Bono have long argued that foreign aid has various positive effects on economic develop-ment (Sachs, 2005). Recent contributions scrutinising the voluminous aid-effectiveness literature however find no robust evidence for a positive effect of foreign aid on economic growth (Doucouliagos and Paldam, 2008;Rajan and Subramanian, 2008). In at least some recipient countries, #The author 2011. Published by Oxford University Press on behalf of the Centre for the Study of African Economies. All rights reserved. For permissions, please email: [email protected]
foreign aid must thus have indirect negative effects on economic growth that offset any positive growth effects.
Svensson (2000)andHodler (2006)present theoretical models in which rivalling ethnic groups can divert time and resources away from productive to rent-seeking activities. These rent-seeking activities are socially wasteful, but help to channel aid inflows or other public funds towards one’s own group.1They may include bribery and corruption, lobbying and political campaigning, distorted policies as well as intimidation or even violence and civil warfare. Focusing on the best equilibrium that can be sustained by trigger strategies in a repeated game, Svensson (2000) shows that an increase in aid inflows induces all groups to engage in more rent seeking to ensure that deviations remain unprofitable. His model thus predicts that there are ‘surprisingly small or in fact even contractible effects on welfare and public project provision following increased inflows of foreign aid’ (Svensson, 2000, p. 445) in heterogeneous societies. Consistent with his model’s predictions, he finds evidence that foreign aid tends to raise corruption in ethnically fractionalised, but not in ethni-cally homogenous countries.2
Hodler (2006) adds the assumption that property rights on produced output are endogenous and their quality decreasing in the share of aggre-gate resources devoted to rent-seeking activities. Focusing on the one-shot version of the game, he finds that foreign aid has a direct positive effect on economic development and an indirect negative effect as foreign aid increases rent seeking and erodes property rights, thereby making pro-ductive activities even less attractive. The magnitude of the direct positive effect is independent of the number of rivalling groups, but the indirect negative effect becomes larger as the the number of rivalling groups increases. The reason is that the increase in aggregate rent seeking that follows higher aid inflows is the larger, the more rivalling groups there are. As a consequence, the model predicts that the net effect of foreign aid on economic development is positive if the number of rivalling
1Hodler (2006)focuses on natural resource rents rather than foreign aid. However,
wind-fall gains in the forms of resource rents and (unconditional) aid inflows are likely to have similar effects on a country’s economy, its institutions and the political situation, as argued by Acemoglu et al. (2004), Hodler (2006), Dalgaard and Olsson (2008) and many others. For dynamic models of rent seeking and windfall gains, see Lane and Tornell (1996),Tornell and Lane (1999)andHodler (2007).
2Knack (2001),Alesina and Weder (2002),Bra¨utigam and Knack (2004)andDjankov et al. (2008)provide further evidence that foreign aid can foster corruption and undermine the quality of institutions and governance.
groups is low, but decreases in the number of rivalling groups and becomes negative if this number gets sufficiently large.
The models ofSvensson (2000)andHodler (2006)predict that the effect of foreign aid on economic development should be clearly positive in eth-nically homogenous countries, but smaller or even negative in countries with many rivalling ethnic groups.3In this paper, we test this hypothesis using panel data covering 114 aid recipient countries over the period 1962 to 2001. We are interested in the growth effects of both foreign aid and its interaction with the index of ethnic fractionalisation, which serves as our proxy for the number of rivalling ethnic groups. Employing two-stage least squares and generalised method of moments (GMM) estimation techniques, we find a positive coefficient on foreign aid and a negative coefficient on the interaction term. These findings, which survive various robustness exercises, support our hypothesis. Our estimates suggest that foreign aid is effective in promoting economic growth in relatively ethnically homogenous countries, but that many Sub-Saharan African countries (and a few countries in Latin America and elsewhere) are so ethnically fractionalised that foreign aid is likely to be ineffective or even harmful.
This latter implication is reconcilable with the political reality in various Sub-Saharan African countries. In Kenya, for example, there has long been fierce political competition along ethnic lines, and numerous members of the Kalenjin-dominated government around Daniel arap Moi, who was president from 1978 to 2002, and the Kikuyu-dominated government around Mwai Kibaki, who has been president ever since, have extracted foreign aid and other public funds on a large scale (Wrong, 2009).
Our paper contributes to the aid effectiveness literature, in particular its newer branch, the so-called conditional aid effectiveness literature (Doucouliagos and Paldam, 2010), which studies the conditions under which foreign aid is effective (rather than whether or not foreign aid is effective in an average country). Despite some doubts about the robustness of their findings,Burnside and Dollar (2000)must be credited for initiat-ing the conditional aid effectiveness literature.4Major contributions to this
3 WhileSvensson (2000)andHodler (2006)both focus on rivalling groups divided along
ethnic lines in their empirical applications, their theoretical models can also represent situations in which rivalling groups differ in some other characteristics. We however choose to follow Svensson (2000)and Hodler (2006) in focusing on rivalling ethnic groups.
4 Studies questioning the robustness of theBurnside and Dollar (2000)findings include Hansen and Tarp (2000, 2001), Dalgaard and Hansen (2001), Lensink and White
literature includeHansen and Tarp (2000,2001),Dalgaard et al. (2004)and
Angeles and Neanidis (2009).5Hansen and Tarp find diminishing returns to foreign aid, i.e., a negative coefficient on aid squared.6Dalgaard and his co-authors find that aid is more effective outside the tropics than within. In particular, they find a positive coefficient on aid, but a negative coefficient on the interaction term between aid and the fraction of a country’s area located in the tropics. Angeles and Neanidis hypothesise that aid effective-ness depends on the size of the local elite, which they proxy by the share of colonial settlers.7 They indeed find a positive coefficient on aid, but a negative coefficient on the interaction term between aid and the share of colonial settlers.
We compare our results to these findings. We find that the interaction term between aid and ethnic fractionalisation tends to be more robust than an aid-squared term and the interaction term between aid and the fraction of a country’s area located in the tropics. We also find evidence that ethnic fractionalisation and the share of colonial settlers both lower aid effectiveness. Inspired by Caselli and Coleman (2006), we argue that this latter finding may suggest that rent-seeking contests for aid inflows do not only get more detrimental as the number of ethnic groups raises, but also as the differences in physical appearance across the major ethnic groups grow larger.
Our paper also relates to the literature on the consequences of ethnic diversity for economic development.Easterly and Levine (1997)find that ethnic fractionalisation may be responsible for Sub-Saharan Africa’s poor growth performance by causing rent seeking, poor policies and weak institutions.8 We also find that ethnic fractionalisation has a significantly
(2001), Easterly et al. (2004),Roodman (2004, 2007), Jensen and Paldam (2006)and Doucouliagos and Paldam (2010).
5Doucouliagos and Paldam (2010) and Roodman (2004, 2007) discuss various
contri-butions to the conditional aid effectiveness literature. Roodman’s robustness exercises suggest that the findings ofHansen and Tarp (2001)andDalgaard et al. (2004)tend to be more robust than other findings in this literature. These robustness exercises do however not include the most recent contributions, e.g., Angeles and Neanidis (2009) and also not all of the earlier contributions, e.g.,Ovaska (2003).
6See alsoDalgaard and Hansen (2001)andLensink and White (2001).
7Bjørnskov (2009)studies in what circumstances foreign aid benefits the local elite. 8La Porta et al. (1999)andAlesina et al. (2003)also find that ethnic fractionalisation leads
to poor policy outcomes and bad governance; andMiguel and Guerty (2005)illustrate the negative effect of ethnic divisions on the provision of local public goods in rural Kenya.
negative effect on economic growth in specifications in which we exclude the interaction term of foreign aid and ethnic fractionalisation. But when-ever we include this interaction term, ethnic fractionalisation by itself becomes insignificant. Hence, our results suggest that ethnic heterogeneity is not in and of itself detrimental to economic growth, but lowers the effec-tiveness of foreign aid.
The remainder of this paper is structured as follows: Section 2 discusses our empirical methodology and the data. Section 3 presents our main results and various robustness exercises. Section 4 concludes.
2. Methodology and data
We employ panel data covering 114 aid-recipient countries over the period 1962 to 2001.9We use four-year averages of our measures of foreign aid and economic growth. To test whether the aid – growth relationship varies systematically with ethnic fractionalisation, we estimate the follow-ing model:
GROWTHit= a + b1AIDit+ b2ETHNICi+ b3(AIDit× ETHNICi)
+ X′
itL+ 1it,
where GROWTHit is the average growth rate of real per capita GDP in
country i from year t to year t+ 3, AIDita measure of average yearly aid
inflows in this period, ETHNICi an index of ethnic fractionalisation and
Xit a vector of other control variables.
We are mainly interested in the effect of a change in AIDit on
GROWTHit. The point estimate of this effect is b1+ b2ETHNICi. Our
hypothesis suggests that b1 should be significantly positive and b2
should be significantly negative. The point estimates would then imply that GROWTHitis increasing in AIDitif ETHNICi is below the threshold
of 2b1/b2, but decreasing in AIDitotherwise.
We use the measures of GROWTHitand AIDitfrom the extensive data
set compiled byRoodman (2004).10This data set contains three measures of aid inflows: Effective development assistance (EDA) relative to real GDP, net overseas development assistance (ODA) relative to real GDP and ODA relative to exchange rate GDP, i.e., GDP converted to US dollars using market exchange rates rather than purchasing power parities (PPP). The
9 Due to data limitations, the panel is unbalanced and not all specifications cover exactly
114 countries.
EDA data correct for a number of short-comings in the ODA data and should therefore be conceptually superior in measuring the true aid element of grants and loans (Chang et al., 1998). We follow the recent lit-erature by using EDA-to-real GDP (AIDit) in our baseline specifications,
and ODA-to-real GDP (ODAitR) as well as ODA-to-exchange rate GDP
(ODAitX) to check the robustness of our results.
We use the index of ethnic fractionalisation (ETHNICi) byAlesina et al.
(2003) to proxy for the number of rivalling ethnic groups. This index measures the probability that two randomly selected individuals of a par-ticular country belong to different ethno-linguistic groups. Hence, higher scores indicate a more fractionalised country. This index is only available as a cross section, but we are not concerned by this because the ethnic com-position of countries tends to be very slow moving (Alesina et al., 2003). We also use the similarly constructed indices of linguistic and religious fractionalisation (LANGUAGEi and RELIGIONi). Table 1 provides
summary statistics for our three main variables — GROWTHit, AIDit
and ETHNICi — based on all observations used in our baseline
specifications.
Following the literature, our control variables include ‘initial’ real PPP-adjusted GDP per capita in year t (GDPit), and a dummy variable
for the fast-growing East Asian countries.11 Over the period 1962 to 2001, the average growth rate in these countries was close with 5% com-pared with 1% in the rest of the sample.
Many studies in the aid effectiveness literature further add control vari-ables that proxy for fiscal, monetary and trade policies, institutional quality, political stability and governance. We refrain from adding such control variables. The models of Svensson (2000) and Hodler (2006)
suggest that the rent-seeking activities caused by aid inflows into ethnically diverse countries go hand-in-hand with poor policies and may lead to a
Table 1: Summary Statistics Variable Number of observations Mean Standard deviation Minimum Maximum GROWTHit 763 0.013 0.042 20.425 0.165 AIDit 763 0.014 0.024 20.005 0.237 ETHNICi 114 0.492 0.261 0.000 0.930
11This dummy, which is also taken fromRoodman (2004), is equal to one for China,
Indonesia, South Korea, Malaysia, Philippines, Singapore and Thailand.
deterioration in institutional quality. The resulting rent-seeking contestsare also likely to be associated with political instability and bad governance. These models therefore predict that, in fractionalised countries, foreign aid has an indirect negative effect on economic growth, which may well work via rent seeking, poor policies, bad governance, political instability and weak institutions. We can therefore only test our hypothesis whether we exclude these variables. Otherwise, we would be testing whether ethnic fractionalisation impacts upon the aid – growth relationship through some channel unrelated to policies, governance, political stability and institutional quality.
For similar reasons, we follow the literature in not controlling for invest-ment in our main specification. Investinvest-ment is a very proximate cause of economic growth (e.g., Rodrik, 2003). When controlling for investment, one would test whether ethnic fractionalisation impacts upon the aid – growth relationship through some channel that leaves investment unaf-fected. However, we would like to test whether ethnic fractionalisation impacts upon the aid – growth relationship in general, i.e., including through all the channels that affect investment. We can only test this latter hypothesis when we exclude investment from our main specification. We however return to the role of investment below.
To reduce the possibility of omitted variables biasing the relationship between aid and growth, we add year dummies to account for time varying common shocks, and regional dummies to control for regional fixed effects (both of which are omitted in most other contributions to the aid effectiveness literature).12 The instrumental variables approach that we adopt will also help to identify the causal relationship between aid and growth.
As a positive side-effect of excluding policy, governance and institutional variables, our sample contains a larger cross section of countries than pre-vious studies. Our baseline specifications are based on 763 observations from 114 countries, while the baseline specification is based on, for example, 275 observations from 56 countries in Burnside and Dollar (2000), and 449 observations from 67 countries in Angeles and Neanidis (2009). As policy, governance and institutional variables tend to be missing more often for countries with poor policies, bad governance,
12 The regions are East Asia and the Pacific, Eastern Europe and Central Asia, Latin America
and the Caribbean, the Middle East and North Africa, South Asia and Sub-Saharan Africa. Given that we follow the literature by including a dummy for the fast-growing East Asian countries (see above), we are in fact dividing East Asia and the Pacific into two groups: the fast-growing East Asian countries and the rest.
weak institutions and low growth rates, we expect our results to be less prone to sample selection bias than those of previous studies.
The potential endogeneity of foreign aid has been the main challenge in the empirical aid effectiveness literature. We follow the literature in choos-ing estimation techniques that help to address this potential endogeneity. The first technique that we use is two-stage least squares (2SLS). Following the literature (e.g., Boone, 1996; Burnside and Dollar, 2000;
Hansen and Tarp, 2001; Dalgaard et al., 2004; Angeles and Neanidis, 2009), we use as instruments for AIDit a dummy for the Franc zone
(FRZi), a dummy for Central American countries (CAMi), a dummy for
Egypt (EGYi), arms imports divided by GDP (ARMSit) and log population
size (POPit). These instruments are inspired by various studies, showing
that strategic and cultural ties are important determinants of aid flows. Countries in the Franc zone and Central America receive more aid from France and the USA, respectively, for cultural reasons unrelated to econ-omic performance, while Egypt receives more aid for geopolitical reasons. Donors also tend to give more aid per capita to small countries as well as to countries that have arms deals with them, again for reasons unrelated to economic performance. We deviate from most of the literature by not using lagged aid as an instrument in our 2SLS estimates, as average growth in, say, the period from 1998 to 2001 may well depend on aid inflows in, say, 1997, which would violate the instrument exogeneity requirement. To ensure that our set of instruments is sufficiently strong despite dropping lagged aid, we add quadratics of ARMSit and POPit.13
Since, we need to instrument for AIDit as well as its interaction with
ETHNICi, we also add ARMSit× ETHNICi and POPit× ETHNICi to
our set of instruments.14
We further address the potential endogeneity of foreign aid also by using the generalised method of moments GMM panel estimators of Arellano and Bond (1991) and Blundell and Bond (1998). These estimators have become increasingly popular in the aid effectiveness literature (e.g.,
Hansen and Tarp, 2001; Dalgaard et al., 2004; Roodman, 2004; Rajan and Subramanian, 2008;Angeles and Neanidis, 2009). They make use of standard instruments, such as those discussed above, but expand the instrument set to improve the efficiency of the first-stage regression. The
13Dividing arms imports by GDP rather than total imports also helps to avoid weak
instrument problems.
14Further adding ARMS
it
2× ETHNIC
iand POPit2× ETHNICito our set of instruments
does not lead to any noticeable change in our results.
Arellano – Bond estimator converts endogenous variables into first differ-ences and uses lagged levels of the endogenous variables to instrument for these differences, which is why it is commonly referred to as the difference-GMM estimator. The Blundell – Bond estimator adds the levels of the endogenous variables to the system to be instrumented and uses the lagged first differences as additional instruments. This is known as the system-GMM estimator.15 We apply these GMM estimators using a two-step estimation process, which tends to be more efficient than a one-step process, and the Windmeijer (2005) finite-sample correction to adjust the standard errors. To avoid dynamic panel bias, we treat AIDit
and AIDit× ETHNICias well as GDPitas endogenous variables.16
Besides addressing the potential endogeneity of aid, these GMM estima-tors have the added advantage that they ‘incorporate (implicitly) fixed effects’ (Rajan and Subramanian, 2008, p. 644). The possibility to control for unobserved country-specific heterogeneity is particularly valu-able in our study, in which we cannot control for policy and governance variables because of the hypothesized channels through which ethnic frac-tionalisation impacts upon aid effectiveness.
When employing these GMM panel estimators, we use only endogenous variables that are lagged at least twice as instruments. When the number of lags of the endogenous variables used as instruments is otherwise unrest-ricted, GMM panel estimators may create numerous instruments that ‘can overfit the instrumented variables’ (Roodman, 2004, p. 25). Therefore, we mostly use only the second and third lags of the endogenous variables as instruments, but we also report the results when using all endogenous variables lagged at least twice, and when collapsing the set of instruments using the method proposed by Roodman (2009).
3. Findings
Table2presents our main results using pooled OLS and, more importantly, 2SLS. In Columns 1 and 2 we look at the effects of AIDitand ETHNICion
GROWTHit in the absence of the interaction term AIDit× ETHNICi. We
find that the effect of AIDit is not significantly different from zero, while
ETHNICi has a significant negative effect. The former result suggests 15 These estimators both have their limitations. The difference-GMM estimator often leads
to a weak instruments problem, while the system-GMM is only valid if the lagged differ-ences are orthogonal to the fixed effects.
Table 2: Main results (OLS and 2SLS)
Dependent variable (1) (2) (3) (4) (5) (6) (7)
OLS 2SLS OLS 2SLS 2SLS 2SLS 2SLS
GROWTHit GROWTHit GROWTHit GROWTHit GROWTHit GROWTHit INVit
AIDit 20.170 0.223 0.507 1.399 1.249 2.000 6.125 (0.465) (0.202) (0.176) (0.034) (0.044) (0.028) (0.030) ETHNICi 20.031 20.031 20.016 20.005 20.007 0.004 0.035 (0.000) (0.000) (0.158) (0.750) (0.635) (0.841) (0.588) AIDit*ETHNICi 21.066 21.874 21.822 22.636 26.771 (0.139) (0.053) (0.058) (0.051) (0.081) GDPit 20.001 0.004 20.002 0.003 20.001 0.002 0.047 (0.836) (0.369) (0.750) (0.554) (0.896) (0.632) (0.004)
Year dummies YES YES YES YES YES YES YES
Regional dummies YES YES YES YES YES YES YES
Implied threshold 2b1/b3 (0.48) 0.75 0.69 0.76 0.90
Countries 114 114 114 114 114 92 114
Observations 763 763 763 763 752 626 763
R2 0.158 0.200 0.176 0.209 0.239 0.188 0.199
Hansen J-test (p-value) — 0.244 — 0.342 0.484 0.321 0.798
Omitted observations Statistical outliers Countries with low
or high ETHNICi
Notes: p-values in parentheses are based on robust and clustered standard errors. In all 2SLS regressions, exogenous variables used as instruments include FRZi, CAMi, EGYi, POPit, POPit2, ARMSitand ARMSit2. In addition, POPit*ETHNICiand ARMSit*ETHNICiare used in Columns
4 – 7. In Column 5, outliers are removed using theHadi (1992)procedure (see footnote 21 for details). The outliers are GAB 1974– 1977; GNB 1974– 1977, 1982– 1985, 1986–1989; IRQ 1990–1993; JOR 1974–1977, 1978– 1981, 1982– 1985; LBR 1990– 1993, 1998–2001 and SOM 1974– 1977. In Column 6, countries with ETHNICibelow the 10th or above the 90th percentile are omitted.
74
|
R oland Hodler and Davi d S . Knightthat foreign aid has no effect in an average aid-recipient country, which is consistent with the findings of various recent contributions to the aid effec-tiveness literature (Doucouliagos and Paldam, 2008; Rajan and Subramanian, 2008); and the latter result is consistent with the findings of Easterly and Levine (1997), who argue that ethnic divisions may be responsible for Sub-Saharan Africa’s poor growth performance. In addition, the effect of GDPitis also insignificant.17
In Column 3, we use pooled OLS to estimate our baseline specification, which includes the interaction term AIDit× ETHNICi. The coefficients on
AIDitand the interaction term have the predicted signs, but are statistically
insignificant. In Column 4, we address the potential endogeneity of AIDit
and AIDit× ETHNICiusing 2SLS with the set of instruments discussed in
the previous section. The Hansen J-test is often used to assess the validity of the instruments. We cannot reject the null hypothesis that the excluded instruments are uncorrelated with the error term and, therefore, exogen-ous.18We find that the coefficient on AIDitis positive and statistically
sig-nificant (with a p-value of 0.034), while the coefficient on AIDit×
ETHNICi is negative and statistically significant (with a p-value of
0.053). These results support our hypothesis. In particular, the former result suggests that the effect of AIDit on GROWTHi is unambiguously
positive in ethnically homogenous countries (where ETHNICi¼ 0),
while the later result suggests that the effect of AIDit on GROWTHit
decreases in ETHNICi. In Figure 1, following Brambor et al. (2006), we
present the effect of AIDiton GROWTHitas well as the associated standard
errors for all possible levels of ETHNICi. The effect of AIDiton GROWTHit
is significantly positive for low levels of ETHNICi, but becomes
insignifi-cant for high levels of ETHNICi. The point estimates suggest that this
effect turns negative once ETHNICi exceeds the threshold level of 0.75.
This is the case in 21 of the 114 countries in our baseline sample, including 20 of the 43 Sub-Saharan African countries. In these countries, the positive
17 In all OLS and 2SLS estimates presented in the paper, the coefficients on the dummies for
the first four 4-year periods tend to be higher than the dummies for the six later 4-year periods. Moreover, when omitting the dummy for Sub-Saharan African countries, then the dummy for the fast-growing East Asian countries is positive and highly significant, and the South Asia dummy is also positive and significant in most specifications, while all other regional dummies are insignificant.
18 Also the Anderson canonical correlations LR test is sometimes used to assess the
relevance of the instruments. In all 2SLS estimates presented in this paper, the null hypothesis can be easily rejected, which suggests that the models are identified and the instruments relevant.
effects of foreign aid are presumably offset by the negative consequences of the provoked rent-seeking contests among rivalling ethnic groups.
To get an idea how sizeable the effect of ethnic fractionalisation on aid effectiveness is, let us first consider the case of Uganda. Uganda is the most ethnically fractionalised country in the world with ETHNICUGA¼
0.930. Over the period 1998 to 2001, it received EDA equal to only 1.2% of its GDP, and its average yearly growth rate was 2.5%. Our point estimates suggest that the contribution of these aid inflows to its growth rate was 20.4%, i.e., that Uganda would have grown at a rate of 2.9% in the absence of foreign aid. However, the contribution of these aid inflows to its growth rate would have been 0.6% if Uganda were about as ethnically fractionalised as the average country in our sample (such as Nicaragua or Venezuela), and even 1.7% if Uganda were perfectly ethnically hom-ogenous (such as Comoros).19
Sierra Leone is another highly fractionalised country with ETHNICSLE¼ 0.820. In the 1980s, Sierra Leone was a country strongly
influenced by tribal and power politics, where corruption and rent seeking were allegedly rife (Reno, 1995). In the period 1986 to 1989, EDA inflows averaged 1.5% of GDP. Over this period, real GDP on average declined by 1.6% a year. According to our estimates, these aid inflows may have contributed to declining GDP by adding to the incentives to engage in rent-seeking activities, with aid inflows estimated to have
Figure 1: Aid Effectiveness and Ethnic Fractionalisation (2SLS Estimates)
19These contributions are calculated as follows: (1.399 – 1.874× 0.930)0.012 ¼ 20.004,
(1.399 – 1.874× 0.492)0.012 ¼ 0.006, and 1.399 × 0.012 ¼ 0.017.
contributed 20.2% a year to growth. In comparison, if Sierra Leone had been as ethnically fractionalised as the average country, aid would have raised the growth by 0.7% a year, and even by 2.1% with perfect ethnic homogeneity.20 These counterfactuals highlight that the effect of ethnic fractionalisation on aid effectiveness is not only statistically, but also econ-omically significant.
While we are mainly interested in the effects of AIDit and AIDit×
ETHNICi on GROWTHit, it is also noteworthy that ETHNICi becomes
insignificant whenever the interaction term AIDit× ETHNICiis included.
This result suggests that ethnic heterogeneity in and of itself does not have a negative effect on economic growth, but acts to lower the effectiveness of foreign aid.
In Column 5, we account for the possibility that outliers may drive our results by using theHadi (1992)procedure to identify and remove outliers. In the absence of outliers, the coefficients of interest are of similar magni-tude and statistical significance as and when the full sample is used.21In Column 6, we omit the 10% least and the 10% most ethnically fractiona-lised countries from our sample. We again find that the coefficients of interest remain significant, and they become even somewhat larger in magnitude.
As investment is generally seen as a very proximate determinant of econ-omic growth, we expect AIDitand AIDit× ETHNICito have qualitatively
similar effects on investment (INVit) as they have on economic growth.
This is confirmed by the results in Column 7, where the dependent variable is INVitrather than GROWTHit.
Table3presents our main results using GMM estimation techniques to address the potential endogeneity of foreign aid as well as to account for country-specific unobserved heterogeneity. In Columns 1 and 2, we employ the system-GMM estimator using only the second and third lags of the endogenous variables as instruments. The Hansen J-test suggests in both cases that the exogeneity of the instruments cannot be rejected;
20 These contributions are calculated as follows: (1.399 – 1.874× 0.820)0.015= 2 0.002,
(1.399 – 1.874× 0.492)0.015 ¼ 0.007 and 1.399 × 0.015 ¼ 0.021.
21 TheHadi (1992)procedure is used by, e.g.,Roodman (2004)andAngeles and Neanidis (2009). We use a 5% significance level to remove outliers to the partial scatter plot of GROWTHitagainst the predicted values of AIDit× ETHNICiafter projection onto the
instruments. The countries with most outliers are Guinea-Bissau and Jordan (as noted in Table2). Our results also survive if we only exclude any or both of these two countries, or if we use other standard tests for outliers based on Cook’s Distance, DFITS and the standardized residuals.
Table 3: Main Results (GMM)
Dependent variable (1) (2) (3) (4) (5) (6) (7)
GMM (SYS) GMM (SYS) GMM (SYS) GMM (SYS) GMM (SYS) GMM (DIFF) GMM (SYS) GROWTHit GROWTHit GROWTHit GROWTHit GROWTHit GROWTHit INVit
AIDit 20.036 0.776 0.697 0.718 1.395 1.658 2.111 (0.765) (0.005) (0.036) (0.009) (0.000) (0.105) (0.004) AIDit*ETHNICi 21.577 21.220 21.407 22.212 23.111 23.730 (0.001) (0.009) (0.005) (0.002) (0.072) (0.011) GDPit 0.002 20.002 20.003 20.002 0.001 20.020 0.053 (0.637) (0.524) (0.371) (0.603) (0.915) (0.111) (0.000)
Year dummies YES YES YES YES YES YES YES
Regional dummies NO NO NO NO NO NO NO
Implied threshold 2b1/b2 0.49 0.57 0.51 0.63 (0.53) 0.57
Countries 114 114 92 114 114 107 114
Observations 763 763 626 763 763 649 763
Hansen J-test (p-value) 0.245 0.470 0.572 0.495 0.117 0.333 0.488
AR(2) test (p-value) 0.930 0.833 0.975 0.855 0.753 0.517 0.021
GMM instrument count 36 56 56 76 34 58 56 Lags of endogenous variables used as instruments Two and three lags Two and three lags Two and three lags Unrestricted starting with two lags Unrestricted starting with two lags and collapsed set
Unrestricted starting with two lags
Two and three lags
Omitted observations Countries
with low or high ETHNICi
Notes: p-values in parentheses are based on robust standard errors and theWindmeijer (2005)finite-sample correction. In all columns, exogenous variables used as instruments include FRZi, CAMi, EGYi, POPit, POP2it, ARMSitand ARMSit2. In addition, POPit*ETHNICiand
ARMSit*ETHNICiare used in Columns 2 –7. In Column 3, countries with ETHNICibelow the 10th or above the 90th percentile are omitted.
78
|
R oland Hodler and Davi d S . Knightand the Arellano – Bond test for AR(2) fails to reject the null hypothesis of no autocorrelation.22In Column 1, we again find that AIDithas no
signifi-cant effect on GROWTHiton average, i.e., when excluding the interaction
term. Our main GMM specification in Column 2 suggests again that the effect of AIDit on GROWTHit is significant in ethnically homogenous
countries, but decreases as countries become more ethnically fractiona-lised. Figure 2 presents the implied effect of AIDit on GROWTHit and
the associated standard errors for all possible levels of ETHNICi. Like
our 2SLS estimates, our GMM estimates suggest that the effect of AIDit
on GROWTHit is significantly positive at low levels of ETHNICi. But
unlike our 2SLS estimates, our GMM estimates further suggest that this effect is significantly negative at high levels of ETHNICi. They also imply
somewhat lower threshold levels of ETHNICi. In particular, the point
esti-mates suggest that the indirect negative effects of foreign aid may offset its direct positive effects in considerably more than half of the countries in Sub-Saharan Africa as well as in some fractionalised countries in Latin America and elsewhere.23
In Column 3, we again exclude the 10% least and the 10% most ethni-cally fractionalised countries from our samples. In Column 4, we employ
Figure 2: Aid Effectiveness and Ethnic Fractionalisation (GMM Estimates)
22 The appropriate null hypothesis is absence of second-order autocorrelation because
first-differencing of endogenous variables directly induces first-order autocorrelation.
23 The point estimates in Column 2 suggest a threshold level of 0.51. ETHNIC
iexceeds 0.51
in 58 of the 114 countries in our baseline sample, including 34 Sub-Saharan African and 10 Latin American countries.
all possible lags of the endogenous variables as instruments starting from the second lag. In Column 5, we collapse the set of instruments using the method proposed byRoodman (2009). In all instances, the coefficients of interest show the predicted signs and remain highly significant. In Column 6, we show that the coefficients of interest have the predicted signs and are close to being significant even when using the difference-GMM estimator. In addition, we again show in Column 7, that AIDit and AIDit× ETHNICi have similar effects on investment as
they have on economic growth.
In the remainder of this section we present further robustness exercises based on the 2SLS regression of Column 4 of Table2, and the system-GMM regression of Column 2 of Table3. We have argued before that our bare-boned baseline specification is appropriate to test how ethnic fractionalisa-tion impacts upon aid effectiveness through all possible channels. Nevertheless, we look whether our results are robust to the addition of further control variables. We start by adding a measure of trade openness (TRADEit) to our baseline specification in all columns of Table4, as a
con-siderable share of aid inflows is typically used to finance imports. We then add geographical variables, namely distance from the equator (LATITUDEi) and the fraction of a country’s area located in the tropics
(TROPICSi). As a next step, we further control for institutional quality
by adding the indices of political rights (POLITICALit) and civil liberties
(CIVILit) from Freedom House, which are both inverse measures of
insti-tutional quality. In a further step, we include investment (INVit), which is a
particularly close determinant of economic growth. Finally, we add govern-ment expenditures (GOVit) as a measure of fiscal policies. We find that the
coefficients on AIDitand the interaction term still show the predicted signs
and remain statistically significant at least at the 10% level, while all control variables other than investment are generally insignificant.24
In Table5, we test whether our results are robust to the use of alternative measures of foreign aid. We replace AIDit by the two ODA-based aid
measures ODAitR and ODAitX in our baseline 2SLS and GMM regressions.
We note that the coefficients on these aid measures and their interactions with ETHNICihave the predicted signs and are statistically significant in all
four regressions, except that ODAitX× ETHNICiis marginally insignificant
in Column 3.
24Not surprisingly, the GMM results also continue to hold when controlling for the
time-invariant geographical variables LATITUDEiand TROPICSi.
2SLS 2SLS 2SLS 2SLS 2SLS GMM GMM GMM GMM AIDit 1.204 2.894 2.775 2.771 2.676 0.693 0.524 0.453 0.541 (0.060) (0.050) (0.030) (0.029) (0.063) (0.018) (0.075) (0.102) (0.058) ETHNICi 20.007 0.025 0.028 0.027 0.026 (0.604) (0.316) (0.253) (0.257) (0.330) AIDit*ETHNICi 21.655 23.819 23.657 23.678 23.472 21.508 21.293 21.137 21.172 (0.076) (0.058) (0.033) (0.030) (0.062) (0.002) (0.006) (0.013) (0.009) TRADEit 0.002 20.003 20.004 20.006 20.004 0.007 0.011 0.006 0.005 (0.482) (0.652) (0.597) (0.377) (0.557) (0.196) (0.041) (0.196) (0.285) LATITUDEi 0.000 0.001 0.000 0.000 (0.513) (0.428) (0.541) (0.510) TROPICSi 20.003 20.002 20.001 20.003 (0.829) (0.924) (0.933) (0.853) POLITICALit 20.002 20.002 20.002 20.003 20.002 20.002 (0.499) (0.455) (0.427) (0.157) (0.210) (0.229) CIVILit 0.002 0.002 0.002 0.002 0.002 0.002 (0.603) (0.523) (0.504) (0.530) (0.389) (0.471) INVit 0.047 0.045 0.091 0.092 (0.112) (0.134) (0.001) (0.001) GOVit 20.039 20.032 (0.249) (0.162)
GDPit YES YES YES YES YES YES YES YES YES
Year dummies YES YES YES YES YES YES YES YES YES
Regional dummies YES YES YES YES YES NO NO NO NO
Implied threshold 2b1/b3 0.73 0.76 0.76 0.75 0.77 0.46 0.41 (0.40) 0.46
(continued on next page)
Ethnic Fra ctionali satio n and Aid Effectiv eness
|
81Table 4: Continued (1) (2) (3) (4) (5) (6) (7) (8) (9) 2SLS 2SLS 2SLS 2SLS 2SLS GMM GMM GMM GMM Countries 763 696 591 591 591 763 656 656 656 Observations 114 93 93 93 93 114 114 114 114 R2 0.222 0.173 0.161 0.169 0.174 — — — —
Hansen J-test (p-value) 0.242 0.370 0.282 0.174 0.114 0.467 0.489 0.495 0.436
AR(2) test (p-value) — — — – — — 0.531 0.754 0.834 0.851
GMM instrument count — — — — 57 57 58 59
Notes: Dependent variable is GROWTHit. p-values in parentheses are based on robust and clustered standard errors in 2SLS regressions, and on
robust standard errors and theWindmeijer (2005)finite-sample correction in GMM regressions. In GMM regressions, system-GMM is used with the second and third lags of the endogenous variables as instruments. In all columns, exogenous variables used as instruments are FRZi, CAMi,
EGYi, POPit, POPit2, POPit*ETHNICi, ARMSit, ARMSit2and ARMSit*ETHNICi.
82
|
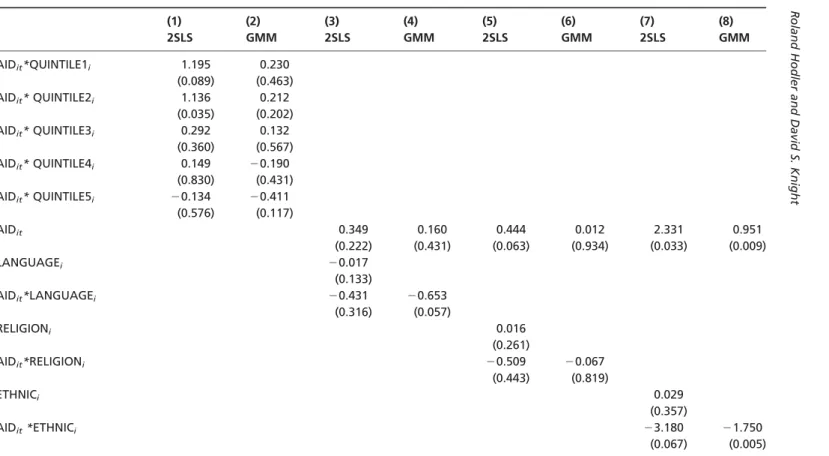
R oland Hodler and Davi d S . KnightIn Table6, we test whether our results are robust to the use of alternative measures of diversity and fractionalisation, as well as when addressing the potential endogeneity of ethnic fractionalisation. Our baseline specifica-tion assumes that the effect of ethnic fracspecifica-tionalisaspecifica-tion on aid effectiveness is linear. We test for potential non-linearities by using a set of dummy vari-ables indicating the quintiles of the distribution of ETHNICi. We construct
the dummy variables QUINTILEki for k ¼ 1, 2, 3, 4, 5, where
QUINTILEki¼ 1 if and only if ETHNICi belongs to the kth quintile of
ETHNICi. In Columns 1 and 2, we use these dummy variables and their
interactions with AIDit. The 2SLS and GMM point estimates suggest that
the effect of ethnic fractionalisation on aid effectiveness is indeed linear
Table 5: Alternative Measures of Aid
(1) (2) (3) (4) 2SLS GMM 2SLS GMM ODAR it 0.771 0.450 (0.037) (0.003) ODAX it 0.354 0.162 (0.063) (0.015) ETHNICi 20.006 20.002 (0.659) (0.897) ODAR it*ETHNICi 20.938 20.994 (0.068) (0.001) ODAX it*ETHNICi 20.444 20.193 (0.103) (0.019)
GDPit YES YES YES YES
Year dummies YES YES YES YES
Regional dummies YES NO YES NO
Implied threshold 2b1/b3 0.82 0.45 (0.80) 0.84
Countries 114 114 114 114
Observations 763 763 748 748
R2 0.215 — 0.208 —
Hansen J-test (p-value) 0.341 0.389 0.330 0.489
AR(2) test (p-value) — 0.924 — 0.596
GMM instrument count — 66 — 66
Notes: Dependent variable is GROWTHit. p-values in parentheses are based on robust and clustered standard errors in 2SLS regressions, and on robust standard errors and the
Windmeijer (2005)finite-sample correction in GMM regressions. In GMM regressions, system-GMM is used with the second and third lags of the endogenous variables as instruments. In all columns, exogenous variables used as instruments are FRZi, CAMi, EGYi, POPit, POPit2, POPit*ETHNICi, ARMSit, ARMSit2and ARMSit*ETHNICi.
Table 6: Alternative Measures and Instruments for Fractionalisation (1) (2) (3) (4) (5) (6) (7) (8) 2SLS GMM 2SLS GMM 2SLS GMM 2SLS GMM AIDit*QUINTILE1i 1.195 0.230 (0.089) (0.463) AIDit* QUINTILE2i 1.136 0.212 (0.035) (0.202) AIDit* QUINTILE3i 0.292 0.132 (0.360) (0.567) AIDit* QUINTILE4i 0.149 20.190 (0.830) (0.431) AIDit* QUINTILE5i 20.134 20.411 (0.576) (0.117) AIDit 0.349 0.160 0.444 0.012 2.331 0.951 (0.222) (0.431) (0.063) (0.934) (0.033) (0.009) LANGUAGEi 20.017 (0.133) AIDit*LANGUAGEi 20.431 20.653 (0.316) (0.057) RELIGIONi 0.016 (0.261) AIDit*RELIGIONi 20.509 20.067 (0.443) (0.819) ETHNICi 0.029 (0.357) AIDit*ETHNICi 23.180 21.750 (0.067) (0.005) 84
|
R oland Hodler and Davi d S . KnightQuintile dummies YES NO NO NO NO NO NO NO
Implied threshold 2b1/b3 — — (0.81) (0.25) (0.87) (0.18) 0.73 0.54
Countries 114 114 108 108 114 114 93 93
Observations 763 763 736 736 763 763 681 681
R2 0.177 — 0.223 — 0.172 — 0.263 —
Hansen J-test (p-value) 0.117 0.517 0.478 0.738 0.255 0.301 0.408 0.475
AR(2) test (p-value) — 0.940 — 0.964 — 0.937 0.840
GMM instrument count — 116 — 56 — 56 56
Notes: Dependent variable is GROWTHit. p-values in parentheses are based on robust and clustered standard errors in 2SLS regressions, and on
robust standard errors and theWindmeijer (2005)finite-sample correction in GMM regressions. In GMM regressions, system-GMM is used with the second and third lags of the endogenous variables as instruments. In all columns, exogenous variables used as instruments include FRZi,
CAMi, EGYi, POPit2and ARMSit2. In addition, the interactions of POPitand ARMSitwith each of the quintile dummies are used in Columns 1 –2;
POPit, POPit*LANGUAGEi, ARMSitand ARMSit*LANGUAGEiare used in Columns 3 –4; POPit, POPit*RELIGIONi, ARMSitand ARMSit*RELIGIONi
are used in Columns 5 –6; and ORIGTIMEi, STATEHISTi, POPit, POPit*ORIGTIMEi, POPit*STATEHISTi, ARMSit, ARMSit*ORIGTIMEiand
ARMSit*STATEHISTiare used in Columns 7 –8.
Ethnic Fra ctionali satio n and Aid Effectiv eness
|
85or, at least, monotonic.25While most of the interaction terms are statisti-cally insignificant, the difference between AIDit× QUINTILE1i and
AIDit× QUINTILE5i is statistically significant at the 10% level in both
columns. This significant difference suggests that foreign aid is indeed more effective in promoting economic growth in the ethnically least frac-tionalised countries than in the ethnically most fracfrac-tionalised countries.
In Columns 3 to 6, we replace ETHNICiby the indices of linguistic and
religious fractionalisation (LANGUAGEi and RELIGIONi). The
coeffi-cients on AIDit and its interaction with these indices still show the
pre-dicted signs, but most of them are relatively close to zero and statistically insignificant. These results suggest that the hypothesised rent-seeking con-tests for aid inflows mainly occur along ethnic lines rather than religious or purely linguistic lines.26 Caselli and Coleman (2006) provide a plausible explanation for such a pattern. They present a model in which conflicts over resources, say aid inflows, emerge if winners can easily identify losers and prevent them from infiltration when it comes to sharing the spoils of victory. They argue that not all distinctions are equally effective ways of ensuring that group members can be identified, with differences in physical appearance being more infiltration-proof than linguistic or reli-gious differences.
While the empirical literature has so far assumed ethnic diversity to be exogenous,Ahlerup and Olsson (2011)show that ethnic fractionalisation is systematically related to the duration of human settlement since prehistoric times (ORIGTIMEi), and to Putterman’s (2007) State Antiquity Index
(STATEHISTi). This index measures the extent to which a political entity
above the tribal level existed in the state’s present territory in the years 1 to 1950 C.E. In Columns 7 and 8, we therefore address the potential endo-geneity of ethnic fractionalisation by employing ORIGTIMEi and
STATEHISTiand their interactions with ARMSitand POPitas instruments
for ETHNICiand its interaction with AIDit. The coefficients of interest still
show the predicted signs and retain their statistical significance.27
25That is, the coefficient on AID
it× QUINTILEmiis strictly higher than the coefficient on
AIDit× QUINTILEniif and only if m, n.
26As mentioned in footnote 3, the theoretical models of Svensson (2000) and Hodler (2006) are in principle silent about the relevant dividing lines between rivalling groups. The insignificant results in Columns 3– 6 of Table 6, however, support their emphasis on rivalling groups that are separated along ethnic lines.
27When adding ORIGTIME
i and STATEHISTi and their interactions with AIDit as
additional control variables in the second-stage regression (while taking ETHNICi as
exogenous), our coefficients of interest still show the expected signs, but become
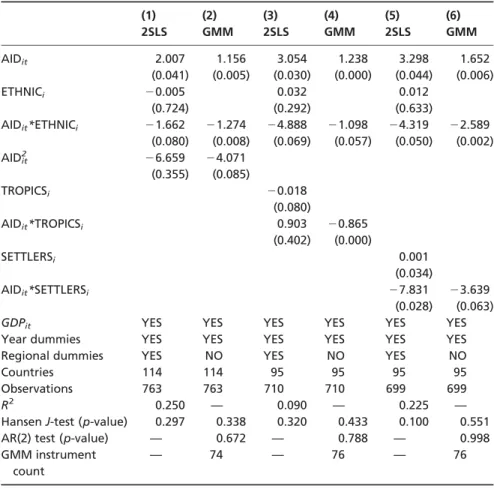
In Table7, we compare our hypothesis to other findings and hypotheses advanced in the conditional aid effectiveness literature. We thereby focus on the finding ofHansen and Tarp (2000,2001) that there are decreasing returns to aid; the finding ofDalgaard et al. (2004)that aid is more effec-tive outside the tropics; and the finding of Angeles and Neanidis (2009)
that aid is more effective in countries with few colonial settlers and, there-fore, no overly strong elite. In Columns 1 and 2, we add aid squared (AIDit2)
to our baseline 2SLS and GMM regressions. We note that the coefficients on AIDitand AIDit× ETHNICiretain the predicted signs and their
statisti-cal significance, while the coefficient on AIDit2 is significant in Column 2,
but not in Column 1. These results provide further support for our hypothesis. They moreover suggest that earlier studies may have found robust evidence for the hypothesis of decreasing returns to aid partly because more fractionalised countries (paradoxically) tend to receive more aid (with the correlation between AIDitand ETHNICibeing 0.25).
To compare our hypothesis to the finding ofDalgaard et al. (2004), we add the interaction term AIDit× TROPICSiin Columns 3 and 4. Since we
need to instrument also for this interaction term, we add ARMSit×
TROPICSi and POPit× TROPICSi to the set of our instruments. Again,
the coefficients on AIDit and AIDit× ETHNICi retain the predicted
signs and their statistical significance at the 10% level. The interaction term AIDit× TROPICSihas the expected sign and is statistically significant
in column (4), but not in Column 3. While the high correlation between TROPICSi and ETHNICi, 0.53, tends to inflate the standard errors of
our estimates; these results still allow us to conclude that we are not just picking up an effect of TROPICSi on aid effectiveness, but a robust and
independent effect of ETHNICion aid effectiveness.
We finally compare our hypothesis to the findings of Angeles and Neanidis (2009). In Columns 5 and 6, we add an interaction term between AIDit and the share of colonial settlers (SETTLERSi), i.e., the
share of the population that was of European origin in colonial times, to our baseline 2SLS and GMM regressions, and we adjust the set of instru-ments accordingly. We find that the coefficients on AIDit, AIDit×
ETHNICiand AIDit× SETTLERSiall have the predicted signs and are
stat-istically significant. These results provide further support for our hypoth-esis as well as for the hypothhypoth-esis of Angeles and Neanidis. Hence, foreign
statistically insignificant. This, however, is hardly surprising as the high correlation between ETHNICiand ORIGTIMEi, which is 0.55, tends to inflate the standard errors.
aid becomes less effective when there are many rivalling groups as well as when there exists a strong elite of colonial settlers. These results are consist-ent with the idea that rconsist-ent-seeking contests caused by aid inflows get more detrimental when the number of ethnic groups rises, as well as when the
Table 7: Alternative Determinants of Aid Effectiveness
(1) (2) (3) (4) (5) (6) 2SLS GMM 2SLS GMM 2SLS GMM AIDit 2.007 1.156 3.054 1.238 3.298 1.652 (0.041) (0.005) (0.030) (0.000) (0.044) (0.006) ETHNICi 20.005 0.032 0.012 (0.724) (0.292) (0.633) AIDit*ETHNICi 21.662 21.274 24.888 21.098 24.319 22.589 (0.080) (0.008) (0.069) (0.057) (0.050) (0.002) AIDit2 26.659 24.071 (0.355) (0.085) TROPICSi 20.018 (0.080) AIDit*TROPICSi 0.903 20.865 (0.402) (0.000) SETTLERSi 0.001 (0.034) AIDit*SETTLERSi 27.831 23.639 (0.028) (0.063)
GDPit YES YES YES YES YES YES
Year dummies YES YES YES YES YES YES
Regional dummies YES NO YES NO YES NO
Countries 114 114 95 95 95 95
Observations 763 763 710 710 699 699
R2 0.250 — 0.090 — 0.225 —
Hansen J-test (p-value) 0.297 0.338 0.320 0.433 0.100 0.551
AR(2) test (p-value) — 0.672 — 0.788 — 0.998
GMM instrument count
— 74 — 76 — 76
Notes: Dependent variable is GROWTHit. p-values in parentheses are based on robust and clustered standard errors in 2SLS regressions, and on robust standard errors and the
Windmeijer (2005)finite-sample correction in GMM regressions. In GMM regressions, system-GMM is used with the second and third lags of the endogenous variables as instruments. In all columns, exogenous variables used as instruments include FRZi, CAMi, EGYi, POPit, POPit2, POPit*ETHNICi, ARMSit, ARMSit2and ARMSit*ETHNICi. In addition, POPit*TROPICSiand ARMSit*TROPICSiare used in Columns 3 –4; and POPit*SETTLERSiand ARMSit*SETTLERSiare used in Columns 5– 6.
differences in physical appearance across the major ethnic groups grow larger.
4. Conclusions
Using panel data covering 114 aid-recipient countries over the period 1962 to 2001, we find that foreign aid is effective in promoting economic growth in ethnically homogenous countries and that higher ethnic fractionalisa-tion reduces aid effectiveness. Our estimates suggest that foreign aid may be ineffective or even harmful in many fractionalized countries, most of which are located in Sub-Saharan Africa. These findings are consistent with the hypothesis that there is a direct positive effect of foreign aid on economic growth, which is offset in fractionalised countries in which aid inflows may provoke detrimental rent-seeking contests.
Our findings have important implications for future foreign aid policy. They suggest that more focus should be placed on the degree of integration of distinct groups in a country. If a country is starkly fractionalised, fungi-ble aid flows without conditions and close oversight may do more harm than good. A clearer view on practical methods that are effective in coun-teracting the negative side effects of aid in fractionalised countries would certainly benefit from further research on a more microeconomic level.
Funding
This study was support by the Department of Economics at the University of Melbourne.
Acknowledgements
We would like to thank Chris Doucouliagos, Manisha Shah and two anon-ymous referees for helpful comments, and Luis Angeles and Kyriakos Neanidis for sharing their data.
References
Acemoglu, D., J. A. Robinson and T. Verdier (2004) ‘Kleptocracy and Divide-and-rule: A Model of Personal Rule’, Journal of the European Economic Association, 2(2 – 3): 162 – 92.
Ahlerup, P. and O. Olsson (2011) ‘The Roots of Ethnic Diversity’, Journal of Economic Growth, forthcoming.
Alesina, A., A. Devleeschauwer, W. Easterly and S. Kurlat (2003) ‘Fractionalization’, Journal of Economic Growth, 8(2): 155 – 94.
Alesina, A. and B. Weder (2002) ‘Do Corrupt Governments Receive Less Foreign Aid?’, American Economic Review, 92(4): 1126 – 37.
Angeles, L. and C. Neanidis (2009) ‘Aid Effectiveness: The Role of the Local Elite’, Journal of Development Economics, 90(1): 120 – 34.
Arellano, M. and S. Bond (1991) ‘Some Tests of Specification for Panel Data: Monte Carlo Evidence and an Application to Employment Equations’, Review of Economic Studies, 58(194): 277 – 97.
Bjørnskov, C. (2009) ‘Do Elites Benefit from Democracy and Foreign Aid in Developing Countries?’, Journal of Development Economics, 92(2): 115 – 24. Blundell, R. and S. Bond (1998) ‘Initial Conditions and Moment Restrictions in
Dynamic Panel Data Models’, Journal of Econometrics, 87(1): 115 – 43.
Boone, P. (1996) ‘Politics and the Effectiveness of Foreign Aid’, European Economic Review, 40(2): 289 – 329.
Brambor, T., W. S. Clark and M. Golder (2006) ‘Understanding Interaction Models: Improving Empirical Analyses’, Political Analysis, 14: 63 – 82.
Bra¨utigam, D. A. and S. Knack (2004) ‘Foreign Aid, Institutions, and Governance in Sub-Saharan Africa’, Economic Development and Cultural Change, 52(2): 255 – 85.
Burnside, C. and D. Dollar (2000) ‘Aid, Policies, and Growth’, American Economic Review, 90(4): 847 – 68.
Caselli, F. and J. W. Coleman II (2006) On the Theory of Ethnic Conflict, NBER Working Paper No. 12125. Cambridge, MA: National Bureau of Economic Research.
Chang, C. C., E. Fernandez-Arias and L. Serven (1998) Measuring Aid Flows: A New Approach, World Bank Policy Research Paper No. 387. Washington, D.C.: World Bank.
Dalgaard, C. J. and H. Hansen (2001) ‘On Aid, Growth and Good Policies’, Journal of Development Studies, 37(6): 17 – 41.
Dalgaard, C. J., H. Hansen and F. Tarp (2004) ‘On the Empirics of Foreign Aid and Growth’, Economic Journal, 114(496): F191 – F216.
Dalgaard, C. J. and O. Olsson (2008) ‘Windfall Gains, Political Economy and Economic Development’, Journal of African Economies, 17(1): 72 – 109. Djankov, S., J. G. Montalvo and M. Reynal-Querol (2008) ‘The Curse of Aid’,
Journal of Economic Growth, 13(3): 169 – 94.
Doucouliagos, H. and M. Paldam (2008) ‘Aid Effectiveness on Growth: A Meta Study’, European Journal of Political Economy, 24(1): 1 – 24.
Doucouliagos, H. and M. Paldam (2010) ‘Conditional Aid Effectiveness: A Meta-study’, Journal of International Development, 22(4): 391 – 410.
Easterly, W. and R. Levine (1997) ‘Africa’s Growth Tragedy: Policies and Ethnic Divisions’, Quarterly Journal of Economics, 112(4): 1203 – 50.
Easterly, W., R. Levine and D. Roodman (2004) ‘Aid, Policies and Growth: Comment’, American Economic Review, 94(3): 774 – 80.
Gallup, J., J. Sachs and D. Mellinger (1999) ‘Geography and Economic Development’, International Regional Science Review, 22(2): 179 – 232.
Hadi, A. (1992) ‘Identifying Multiple Outliers in Multivariate Data’, Journal of the Royal Statistical Society, B(54): 761 – 77.
Hansen, H. and F. Tarp (2000) ‘Aid Effectiveness Disputed’, Journal of International Development, 12(3): 375 – 98.
Hansen, H. and F. Tarp (2001) ‘Aid and Growth Regressions’, Journal of Development Economics, 64(2): 547 – 70.
Hodler, R. (2006) ‘The Curse of Natural Resources in Fractionalized Countries’, European Economic Review, 50(6): 1367 – 86.
Hodler, R. (2007) ‘Rent Seeking and Aid Effectiveness’, International Tax and Public Finance, 14(5): 525 – 41.
Jensen, P. S. and M. Paldam (2006) ‘Can the Two New Aid – Growth Models Be Replicated?’, Public Choice, 127(1 – 2): 147 – 75.
Knack, S. (2001) ‘Aid Dependence and the Quality of Governance: Cross-country Empirical Tests’, Southern Economic Journal, 68(2): 310 – 29.
La Porta, R., F. Lopez-de-Silanes, A. Shleifer and R. Vishny (1999) ‘The Quality of Government’, Journal of Law, Economics and Organisation, 15(1): 222 – 79. Lane, P. R. and A. Tornell (1996) ‘Power, Growth and the Voracity Effect’, Journal of
Economic Growth, 1(2): 213 – 41.
Lensink, R. and H. White (2001) ‘Are There Negative Returns to Aid?’ Journal of Development Studies, 37(6): 42 – 65.
Miguel, E. and M. K. Guerty (2005) ‘Ethnic Diversity, Social Sanctions, and Public Goods in Kenya’, Journal of Public Economics, 89(11 – 12): 2325 – 68.
Ovaska, T. (2003) ‘The Failure of Development Aid’, Cato Journal, 23(2): 175 – 88. Putterman, L. (2007) ‘State Antiquity Index (Statehist)’,http://www.econ.brown.
edu/fac/Louis\_Putterman.
Rajan, R. G. and A. Subramanian (2008) ‘Aid and Growth: What Does the Cross-country Evidence Really Show?’ Review of Economics and Statistics, 90(4): 643 – 65.
Reno, W. (1995) Corruption and State Politics in Sierra Leone. Cambridge: Cambridge University Press.
Rodrik, D. (2003) In Search of Prosperity. Princeton: Princeton University Press. Roodman, D. (2004) The Anarchy of Numbers: Aid, Development, and
Cross-country Empirics, Center for Global Development Working Paper 32. Washington, D.C.: Center for Global Development.
Roodman, D. (2007) ‘The Anarchy of Numbers: Aid, Development, and Cross-country Empirics’, World Bank Economic Review, 21(2): 255 – 77.
Roodman, D. (2009) ‘How to Do xtabond2: An Introduction to Difference and System GMM in Stata’, Stata Journal, 9(1): 86 – 136.
Sachs, J. (2005) The End of Poverty: Economic Possibilities for Our Time. New York: Penguin Books.
Svensson, J., 2000. ‘Foreign Aid and Rent-seeking’, Journal of International Economics, 51(2): 437 – 61.
Tornell, A. and P. R. Lane (1999) ‘The Voracity Effect’, American Economic Review, 89(1): 22 – 46.
Windmeijer, F. (2005) ‘A Finite Sample Correction for the Variance of Linear Efficient Two-step GMM Estimators’, Journal of Econometrics, 126(1): 25 – 51. Wrong, M. (2009) It’s Our Turn to Eat: The Story of a Kenyan Whistle-Blower.
London: Fourth Estate.
Appendix A: Data description
AIDit: Constant price effective development assistance relative to constant
price PPP-adjusted GDP, averaged over the years t to t+ 3. Source:
Roodman (2004)
ARMSit: Arms imports in US$ divided by current-price PPP-adjusted
GDP, averaged over the years t to t+ 3. Source: SIPRI Arms Transfers Database and Penn World Tables
CAMi: Dummy variable equal to 1 for Central American countries.
Source:Roodman (2004)
CIVILit: Index of civil liberties, ranging from 1 to 7, with higher values
indicating less liberties, averaged over the years t to t+ 3. Source: Freedom House
EGYPTi: Dummy variable equal to 1 for Egypt. Source:Roodman (2004)
ETHNICi: Index of ethnic fractionalization. Source:Alesina et al. (2003)
FRZi: Dummy variable equal to 1 for member countries of the Franc
Zone. Source:Roodman (2004)
GDPit: Constant price PPP-adjusted per capita GDP in year t. Source:
Roodman (2004)
GOVit: Constant price PPP-adjusted government expenditures as a share
of GDP, averaged over the years t to t+ 3. Source: Penn World Table 6.3 GROWTHit: Growth rate of constant price PPP-adjusted per capita GDP,
averaged over the years t to t+ 3. Source:Roodman (2004)
INVit: Constant price PPP-adjusted investment as a share of GDP,
aver-aged over the years t to t+ 3. Source: Penn World Table 6.3
LANGUAGEi: Index of linguistic fractionalization. Source:Alesina et al.
(2003)
LATITUDEi: Absolute latitude. Source:Gallup et al. (1999)
ODAitR: Constant price net overseas development assistance relative to
constant price PPP-adjusted GDP, averaged over the years t to t+ 3. Source:Roodman (2004)
ODAitX: Constant price net overseas development assistance relative to
constant price GDP converted to US$ on an exchange rate basis, averaged over the years t to t+ 3. Source:Roodman (2004)
ORIGTIMEi: Duration of human settlement. Source: Ahlerup and
Olsson (2011)
POLITICALit: Index of political rights, ranging from 1 to 7, with higher
values indicating less rights, averaged over the years t to t+ 3. Source: Freedom House
POPit: Natural logarithm of population, averaged over the years t to t+ 3.
Source:Roodman (2004)
RELIGIONi: Index of religious fractionalization. Source: Alesina et al.
(2003)
SETTLERSi: Share of population of European origin in colonial times.
Source:Angeles and Neanidis (2009)
STATEHISTi: State Antiquity Index, which measures the extent to which
a political entity above the tribal level existed in the state’s present territory in the years 1 to 1950. Source:Putterman (2007)
TRADEit: Total trade relative to GDP in constant price PPP-adjusted
terms, averaged over the years t to t+ 3. Source: Penn World Tables 6.3 TROPICSi: Fraction of a country’s area located in the tropics. Source: