Printed in Great Britain
Experimental methods for investigating
protein adsorption kinetics at surfaces
JEREMY J. RAMSDEN
Department of Biophysical Chemistry, Biocentre of the University, CH-4036 Basle, Switzerland
1. INTRODUCTION 42
1.1 Formalism of an adsorbed protein adlayer 44
2. SOLUTION DEPLETION TECHNIQUES 46
2.1 The well-mixed vessel 46 2.2 The packed bed 50
3. GRAVIMETRIC METHODS 50
3.1 The quartz crystal microbalance (QCM) 50 3.2 Surface acoustic wave (SAW) devices 52
4. HYDRODYNAMIC METHODS 53
4.1 The diffusivity of colloidal spheres 53 4.2 Capillarity 56 5. ELECTRICAL METHODS 57 5.1 Impedance measurements 60 5.2 Electrokinetic methods 66 6. OPTICAL METHODS 67 6.1 Ellipsometry 70
6.2 Scanning angle reflectometry (SAR) 72 6.3 Integrated optics (10) 73
6.4 Total internal reflexion spectroscopy (TIRS) 77 6.5 Surface plasmon resonance (SPR) 78
6.6 Evanescent wave light scattering (EWLS) 79
7. LABELLING TECHNIQUES 79
7.1 Radiolabelling 80
7.2 Enzyme-linked immunoassay (ELISA) 80
7.3 Total internal reflexion fluorescence microscopy (TIRFM) 82 7.4 Resonance energy transfer (RET) 83
8. EVALUATION OF KINETIC PARAMETERS 84 9. COMPARISON OF TECHNIQUES 87
10. THE NATURE OF THE ADSORBED PROTEIN LAYER 91 11. ACKNOWLEDGMENT 94
42 J. J. Ramsden 12. REFERENCES 94
APPENDIX LIST OF PRINCIPAL SYMBOLS IO2
I. INTRODUCTION
The adsorption of proteins at the solid-liquid interface is a process of fundamental importance in nature. Extensive reviews (MacRitchie, 1978; Andrade & Hlady, 1986; Norde, 1986) testify to the strong interest which has been shown in the problem during the past few decades. Norde & Lyklema (1978) have rightly pointed out that protein adsorption is scientifically intriguing; the phenomenology is complicated and includes many presently apparently irreconcilable observations. The very variety among proteins makes the field complex; it need hardly be said that 'measurements with well-defined model systems carried out under well-controlled conditions' (Norde & Lyklema, 1978) are an essential precondition to progress in understanding the underlying mechanisms. One of the most valuable approaches to elucidating the mechanism of complicated phenomena is of course to study their kinetics. Yet' the dynamic aspects of protein adsorption at solid-liquid interfaces have not been studied extensively and only a few papers are available in this area of research' (Sarkar & Chattoraj, 1992). Since many protein adsorption processes are partly or wholly irreversible, kinetic as opposed to equilibrium measurements assume a particular importance.
One reason for the poverty of results has been the dearth of suitable (reliable, convenient, etc.) experimental techniques. For many decades there was a clear division between techniques such as radioactive tracer labelling which were capable of yielding an accurate figure for the number of protein molecules adsorbed at a surface, but which were too cumbersome to apply to kinetic measurements, and techniques which did allow kinetics to be measured continuously or quasicontinuously, but which involved many untestable assumptions and which even then could often only yield a relative number of adsorbed molecules. Techniques in both categories usually required the adsorbing molecules to be labelled with a radioactive, fluorescent or other type of marker, an often laborious (or expensive) procedure with unknown effects on the transport properties, conformation etc. of the molecule. Over long periods there is also a risk that the labels may become detached.
Theoretical treatment of the problem remained stagnant without the stimulus of usable data. For example, it is only rather recently that it has been realized that the widely used Langmuir adsorption isotherm is not appropriate for the problem (Mura-Galelli et al. 1991; Ramsden, 19936). With the advent of modern, accurate experimental techniques, theoreticians are beginning to realize that the field offers a very rich phenomenology with which the most sophisticated description of adsorption processes can be challenged.
This review will be devoted essentially to the experimental techniques available for characterizing these process. For providing precise, reliable data on the number of molecules at the interface, modern optical methods appear to be the most promising (§6). On the other hand, some of the older methods take on a new significance when used in conjunction with accurate adsorption data provided by
the optical techniques, for yielding complementary information about the electrostatics of the process, etc. All major techniques which have appeared in the literature are dealt with in this review, although some borderline methods have been omitted.1 Emphasis is placed on how the desired results are obtained, i.e. the working equations for each technique, and on what assumptions are needed in order to obtain the desired information.
The areas of research for which a detailed knowledge of protein adsorption is necessary fall into two broad classes. One is the investigation of fundamental biochemical mechanisms of processes such as blood clotting (which involves surface-induced thrombosis, platelet aggregation, etc.) and molecular recognition. Proteins are a special, highly complex, and important case of particles adsorbing at surfaces, a field which is enjoying a strong renaissance among theoreticians (Bartelt & Privman, 1991), whose current work is concentrated on hard disks, spheres and ellipsoids; it is to be expected that once reliable experimental kinetic results from proteins become available, many new theoretical challenges will be presented. The other class is heuristic: questions to be asked are initially of the type 'how long do I have to leave my microtitre plate exposed to this protein solution in order for a certain surface density of protein to be adsorbed?' The answers will naturally involve, at a deeper level, results from the first class. Examples abound. The kinetics of formation of basement membranes is a rather new field of investigation (Ramsden, 1993 a); associated with it is the spreading and proliferation of cells on membranes constituted from various kinds of extracellular matrix molecules (Masuda-Nakagawa & Wiedemann, 1992), for which it is important to be able to prepare basement membranes in vitro of a definite thickness and packing density. The first step in solid-phase immunoassays (Porstmann & Kiessig, 1992) is the adsorption of antigens or antibodies to a solid surface; although hitherto this step has not usually been carried out very quantitatively, the future development of such assays will certainly demand it. The subsequent binding of analyte to the capture layer can be quantitatively investigated by many of the techniques to be discussed here. The deposition of proteins on electron microscope grids, and the screening of materials for affinity chromatography (Kopaciewicz, 1983; Place et al. 1991), are further fields in which a quantitative knowledge of the kinetics of protein adsorption is indispensible for obtaining deeper insight; others are biocompatibility in medicine, which, with the growing use of artificial implants, internal organs and in vivo sensors is growing in importance, and the fouling of filters used in ultrafiltration and other techniques of protein purification (van den Oetelaar et al. 1989).
The criteria for the methods of choice are: the desired information (number of molecules per unit area of surface) to be obtained as directly as possible from the measurements; the measurements to be on-line, i.e. continuous or quasi-continuous (to permit accurate kinetics to be obtained); the surface and other conditions to be well-defined; no labelling or other modifications of the proteins to be necessary. Only a few of the available methods will be seen to meet these
1
Of course, it will always be possible to devise new techniques. As an example of an exotic method, the quantum yield of latent image formation in *'1'""',h?1Hp rryitnlliff could be measured, for it is dependent on layers of protein such as gelatin at the crystaljitwfiiNfac3ibl I
44 J- J- Ramsden 03 0-2 01 no
-r
^ H l l l l l l l l l l l n i l l l l t 1 1 a -HH< ' " l . l M K + c \ 1000 2000 f/sFig. i. Adsorption of apotransferrin on a SiTiO2 surface, which was a planar optical
waveguide. Measurement of the velocities of two guided modes allowed the calculation of F (See §§6, 6.3 for discussion). The protein was dissolved at a concentration of 100/tg/cm3 in tris-HCl buffer, pH 8-o, at concentrations of 2 mM (curve a) and 10 mM (curves b-d), with NaCl added (curves c, o-i M; curve d, 0-5 M). The protein solution flowed across the waveguide surface at a mean velocity of 0-14 mm/s. Full details are given in Ramsden & Prenosil (1993).
criteria satisfactorily, but others may be useful for providing complementary information on specific aspects of the adsorption process. As mentioned above, the
emphasis will be on the working equations and how the desired information is obtained from the measurements. There will be practically no discussion on specific instrumentation, which is extensively documented in the literature. Techniques dealing exclusively with the air-water interface are excluded.
Figure 1 shows an example of data obtained using an integrated optics technique (§6.3). The protein adsorption is taking place under conditions of differing ionic strength. The figure demonstrates that extraordinarily small and subtle changes in deposition behaviour can readily be detected.
Further examples of adsorption kinetics will be given during the discussion of individual methods. Practically no truly comparative measurements using two or more techniques have been carried out on the same system (i.e. identical protein, surface, solution conditions, etc.); given the variety of protein behaviour encountered, the few comparisons which have been reported scarcely suffice as a basis from which to generalize. One does not necessarily expect the same numbers to come out from measurements carried out using different methods. The surface excess Fof adsorbed proteins is, in fact, only the first stage of knowledge. It is one of the objects of this review to show that different techniques yield insight into different aspects of the problem, such as the conformation and orientation of proteins in monolayers, and the packing density of proteins in multilayers.
1.1 Formalism of an adsorbed protein adlayer
Before embarking upon a discussion of individual techniques, we shall establish the basic terminology and definitions to be used throughout. Fig. za shows the
o
© w
O CXDOOO m
Fig. 2. (a) Schematic drawing of a formalized interface, showing the cover layer C,
containing the freely suspended protein molecules (shaded circles) at a volume concentration c6, the adlayer A of adsorbed protein molecules, characterized by a surface excess F, and the
solid substrate F (Festkorper) at the surface of which adsorption takes place. Inset: coordinate system used throughout this review. The adsorbing surface lies in the x, v plane.
(b) Concentration profile of the idealized adlayer.
cross section of an idealized interface. The most intuitively direct way of observing it is by means of microscopy. Light microscopes do not have adequate resolving power for proteins; electron microscopy is not easily applicable to kinetic measurements.2 Its power lies in the possibility of direct investigation of the conformation of individual molecules and their lateral distribution (Nygren & It is possible to prepare a sequence of grids, each grid having been exposed to a protein solution for a different length of time (Nygren & Stenberg, 1990a). Since a separate substrate must be used for each exposure, and the preparation of identical substrates is one of the most difficult problems in the investigation of adsorption problems, this method cannot be used for obtaining very precise kinetic curves.
46 J. y. Ramsden
Stenberg, 1990a, b; Nygren, 1992; Nygren & Karlsson, 1992). In this respect it is truly complementary to the kinetic methods described in later sections, in which an area of the surface containing hundreds or thousands of molecules is integrated; in these methods, lateral interaction must be inferred from the kinetics, if they are precise enough!
For many purposes, it is precisely knowledge of the average properties which is sought. The primary quantity of interest is F, the mean mass or number of molecules per unit area, which is related to the fractional surface coverage 6 according to
r=dm/a, (1)
where m is the mass per molecule (when F denotes the number of molecules per unit area, m = 1) and a the area per molecule. Some of the methods to be discussed yield primarily F, whereas others give 6 directly; provided the ratio a/m is known, one may always be converted into the other. Fig. zb shows the concentration profile of the idealized interface. According to the Gibbs convention,
=
r
Jor
Jo
where c denotes protein concentration (subscript b = bulk); for the idealized profile shown in Fig. 26, which is applicable to protein monolayers, this becomes:
F=(cA-cb)dA, (3)
and for cA > cb, we have simply
2. SOLUTION DEPLETION TECHNIQUES 2.1 The well-mixed vessel
This is an extremely simple method. The material on which adsorption is to take place is put, in highly comminuted form in order to maximize its surface area A, in a vessel equipped with some means of agitating its contents. A known amount of dissolved protein (concentration c0) is added, and immediately well stirred (mixing is assumed to be instantaneous). After a desired interval t, the particles are separated from the supernatant - usually by gravity, which may call for centrifugation if the particles are small - and the concentration of protein cb in the bulk supernatant measured. Clearly
F=(co-cb)V/A, • (5)
where V is the total volume of liquid in the vessel. The method has the advantages of almost unlimited flexibility regarding the nature of the solid adsorbent, and of the way used to determine the concentration of protein in the supernatant (ultraviolet-visible, circular dichroism, photoluminescence spectroscopies, etc.). On the other hand it possesses the obvious disadvantage of being intermittent, and is therefore only useful for slow kinetics, for the adsorption process must be
Fig. 3. The adsorption of human serum albumin to hydroxyapatite powder (specific surface 45 m!/g) at 27 °C measured using a solution depletion technique. The protein was labelled with 125I to make detection more sensitive. Initially, sufficient protein solution was added to 50 mg powder in 13-3 cm3 buffer (50 mm tris-HCl, pH 7-35, plus 0-15 M-NaCl) to ensure that the final dissolved protein concentration lay in the range 150-300 /ig/cm3 (Mura-Galelli
et al. 1991).
interrupted in order to measure cb. Fig. 3 shows an example of kinetics obtained with the technique. Sometimes, if the adsorption kinetics are being determined in conjunction with some other property of the protein, e.g. enzymatic activity, which must also be determined intermittently, this is not a great disadvantage (e.g. Veselova et al. 1987). More severe problems are: the often ill-defined nature of the surface, for the comminution process - crushing, milling or grinding - may introduce numerous defects into the surface;3 the difficulty of precisely measuring the area A available for adsorption; and the difficulty of ensuring that mixing really is close to instantaneous. The solutions of these problems impose conflicting requirements. The smaller the particles, the larger is A and hence the difference
c0 — cb for a given mass of adsorbing substance, and hence the precision of the determination of F, but the less the particles will resemble 'bulk surface' (Sinanoglu, 1981), and the harder it is to separate the particles from the supernatant (centrifugation at high g may disturb the surface-solution
3
The particles may also be produced by nucleation and growth, which can result in well-defined, homogeneous populations of particles with the same crystal structure as that of bulk material (Ramsden, 1985, 1987), but the growth procedure has to be determined separately for each material. Inevitably high proportion of the surface atoms of the crystallites are at edge or corner sites, for which the adsorption energies are usually different from those of atoms in an infinite plane. Latices can be prepared as small smooth spheres, but then the adsorbing surface is no longer planar, but highly curved, which may change the energy of adsorption, since the surface tension of the solid is curvature-dependent (Vogelsberger & Mar.\, 1976); the radius of curvature of the solid phase may even be comparable to the linear dimensions of the adsorbed molecules and hence affect the adsorption process directly.
48 J. J. Ramsden
c
o
I
1
'•b• Filter
Fig. 4. The continuous solution depletion technique (CSD). A protein solution at a
concentration c0 flows with rate 3? into the vessel of volume V containing particles with a
total surface area A. Mixing is assumed to be instantaneous. Fluid is pumped out with the same rate 2F, and the outflowing concentration cb (i.e. the bulk solution concentration in the
vessel) monitored continuously downstream.
equilibrium). The hydrodynamics is extremely ill-defined; at the moment of adding the protein solution some particles will be in the presence of a very high protein concentration, while others will only ever see a highly depleted solution. The method is not useful for detailed mechanistic investigations; it can straightforwardly answer the question 'how much protein has adsorbed on one gram of this powder ?' when the powder is to be used for another part of the experiment.
Some of the difficulties are overcome by converting the technique into a continuous one. In the method of flow dialysis (Colowick & Womack, 1969, Laane
et al. 1981), one wall of the vessel in which adsorption is taking place ('upper
chamber') is made into a semipermeable membrane, through which free molecules, but not the particles to which they can and do adsorb, can diffuse. The same solvent as in the upper chamber is continuously pumped over the other side of the membrane ('lower chamber'). Free molecules diffuse across the membrane at rates proportional to their concentration in the upper chamber; their concentrations in the flowing liquid can be determined downstream. Mass balance gives the following equation:
dv/dt = cbKc- vSPJB, (6)
where Kc is a cell constant depending on the permeability of the membrane and
v is the number of free molecules in the lower chamber, whose volume is B. Kc can be determined in a control experiment in which adsorbent particles are absent from the upper chamber. Under steady-state conditions dv/dt«o, and measurement of the downstream concentration c2 affords v ( = c2 B) and hence cb. Problems arise with kinetic determinations if the time taken to reach steady state is long, i.e. comparable to the characteristic duration of the adsorption reaction. If this is not the case 7"can be determined from cb using equation (5). Steady state can be achieved quickly by making the volume B of the lower chamber very small (Feldman, 1978).
Fig. 5. Application of the CSD technique. The protein is fibrinogen, of which ca. 4% has been labelled with 125I to aid detection, dissolved at a concentration c0 of 95 /tg/cm3. The
vessel has a volume V — 14-6 cm3, flow rate !F = 2-5 mm3/s. The substrate is soda lime glass beads, diameter 41 +1 fim, with a total area of 1030 cm3. The curious shift of the start of adsorption along the time axis is due to a dead volume of ca. 1*5 cm3 (Cornelius et al. 1992).
Another way (Fig. 4) of effectively sampling the supernatant concentration is to pump protein solution continuously with rate 3F into the vessel containing the adsorbing particles, and pump supernatant out at the same rate, a suitable filter preventing the removal of the solid particles (Aptel et al. 1988; Cornelius et al.
1992). Mass balance with respect to protein gives the following equation:
^c0 = ^cb-\- Vdcb/dt + A dF/dt. (7)
This equation can be solved provided another equation linking F with cb can be found. Aptel et al. (1988) used the Langmuir isotherm and solved the resulting second-order nonlinear differential equation numerically. Clearly this procedure is unsuitable if the form of the adsorption isotherm is not known a priori; Aptel
et al. circumvented the problem by dividing the measured kinetics into several
sections, each of which were assumed individually to follow the Langmuir isotherm, with their own distinct parameters. Cornelius et al. (1992) integrated each term in equation (7) with respect to time; rearranging, one obtains
F =
Fig. 5 shows data obtained using the method with equation (70). Clearly, an excellent time resolution is obtainable.
50 J. J. Ramsden 2.2 The packed bed
This technique, in which small particles are packed into a column through which the solution containing the protein is forced, has received a great deal of attention because of its industrial importance in separation and other processes. The protein concentration in solution is not constant but decreases towards the downstream end of the column as protein adsorbs on the particles, and in practice the particles are porous. Both these factors complicate the analysis, in which mass balance is considered in an element of the packed bed (Lee & Weber, 1969), or in an element of the moving liquid (Leaver et al. 1992), and the measured breakthrough curves simulated. They depend upon various parameters, including adsorption and desorption rate constants characteristic of the material out of which the packed bed is made and the protein, prevailing salt concentration, pH, etc. The simulations allow parameters determined from well-defined, planar systems to be used to predict operating parameters of packed bed separators. The inverse problem, to determine the intrinsic adsorption parameters from the breakthrough curves, is a complicated numerical problem which does not seem to have been attempted.
3. GRAVIMETRIC METHODS
Twenty of the 21 classes of crystals which lack a centre of symmetry are piezo-electric; that is, the crystals become polarized under the influence of external stresses (Curie & Curie, 1880). Conversely, an electric field applied to a piezo-electric crystal induces a stress. The application of an alternating piezo-electric field produces an alternating stress resulting in acoustic standing waves in the crystal (Cady, 1946). These vibrations occur at a characteristic resonant frequency/. Fig.
6 a shows their equivalent circuit. The figure of merit Q of such crystals can be as
high as I O4- I O5, and they are widely used in frequency control and other electronic applications. As in the case of the familiar clock pendulum, the resonant frequency is inversely proportional to the square root of the oscillating mass. This principle is used in a family of gravimetric methods, in which adsorption is allowed to occur on the surface of a vibrating quartz crystal (Ward & Buttry, 1990; Schumacher, 1990), thus diminishing its resonant frequency. Various modes of vibration are possible, of which two, dealt with below, have found application in gravimetric sensors.
3.1 The quartz crystal microbalance (QCM)
The electric field is applied between two metallic electrodes (of area A) evaporated onto the surface of the crystal (Fig. 6b). The vibration mode is thickness shear, and the resonant frequency given by (Cady, 1946; Sauerbrey, 1959):
(a) (b) Adsorption Resonant circuit (d) Broadband
oscillator counterFrequency
Adsorption
Crystal
In
rl.
OutFig. 6. (a) Equivalent circuit of the quartz crystal resonator (Cady, 1946). The inductance
Lq represents the inertial mass of the crystal and the reciprocal capacitance i/C, its shear
modulus. C is the electrical capacitance of the crystal; typically CJC « io~3. The resonant frequency of the crystal is 1/(277 VC-L,C,)). The resistance R represents various losses; the figure of merit Q is ^/{LJC^/R. (b) Side view of the quartz crystal microbalance
undergoing thickness shear vibrations. The thickened lines represent metal electrodes evaporated onto the crystal surface, (c) General scheme for measuring the resonant frequency of QCM or SAW devices, (d) Plan of a surface acoustic wave device. The heavy lines represent the interdigitated metal electrodes which are normally used to excite and receive the waves.
where m is the mode number of the vibration, /tF the shear modulus of the crystal, pF its density and dF its thickness. For the commonly used AT-cut quartz of millimetre or submillimetre thickness, / is typically a few MHz, and can readily be determined to an extremely high accuracy by making the crystal part of a resonant circuit (Sauerbrey, 1959). If proteins are deposited at the antinode of the standing wave propagating across the thickness of the crystal, a frequency change Af occurs as if the thickness of the crystal increased by an amount
(Sauerbrey, 1959), i.e.
d
A =
f
pF dr
F (9)This equation is exact for infinitely thin films with the same acoustic impedance as that of quartz. An accuracy of Afff of ~ io~7 corresponds to a mass resolution of a few ng/cm2 for a plate 01 mm thick, and would take 10 s to determine. It is important to remember that equations (8-9) represent a limiting case (perfectly
52 J.J. Ramsden
elastic and nonviscous materials) of a more general equation which would include the viscosity and shear modulus of the adsorbed protein layer, but in general these attributes of the adlayer are not known. They may be inferred from the complete impedance spectrum of the device.
For use in protein adsorption experiments, the crystal must be immersed in an (aqueous) protein solution. The QCM thereby loses some of its simplicity, for the elastic shear waves in the crystal are now coupled to viscous shear waves in the liquid, which die away exponentially with a characteristic length S =
\Z[27ic/{2nfpc)] (typically ~ 250 nm for aqueous solutions). In fact, the vibrating quartz crystal was first used to specifically study the elastic properties of liquids (Mason et al. 1949). The presence of the liquid causes a shift Sf in the resonant frequency of a crystal; if one side of the crystal is in contact with a liquid of absolute viscosity fjc and density pc, then by matching the shear waves in the two
media at their interface (Kanazawa & Gordon, 1985):
Sf = - / I V [pc Vc/(nPF M'F)] . (1 °)
where f0 is the frequency in the absence of liquid. This expression assumes that
TJC is independent of frequency, which is not necessarily the case (Mason et al. 1949). The mass sensitivity of the crystal immersed in liquid is then the same as in air, i.e. equation (9) may be used to determine F from Af. The figure of merit
Q in the presence of liquid may only be ~ io3, however; hence the determination of the resonant frequency may no longer be so precise. If the vibrating surface is rough, liquid confined in surface cavities will be dragged along with the crystal (Schumacher, 1990), behaving as an adsorbed adlayer of a thickness equal to the characteristic radius of the rugosity. Where the adlayer under investigation consists of randomly adsorbed protein molecules, the surface is necessarily rugose with a characteristic radius djz, and this could lead to large errors, of order F, in the determination of F.
3.2 Surface acoustic wave (SAW) devices
In contrast to thickness shear vibration, Rayleigh surface acoustic waves are transmitted parallel to the solution-surface interface across a region of the crystal on which deposition is taking place (White, 1970; Roederer & Bastiaans, 1983). Typical frequencies are in the same range as for the QCM, i.e. ~ 10 MHz, with wavelengths A ~ 300 /tm. Transmitter and receiver electrodes - typically identical, interdigitated, structures - are deposited on the same face of the crystal (Fig. 6d). The Sauerbrey equations (8-9) can again be used to determine /'from
Af. SAW devices have been successfully applied to applications involving contact
with a liquid (Calabrese et al. 1987), albeit with the same reservations as with the QCM regarding the variation of TJC with frequency. If the substrate is thick (i.e.
dF > 5A), attenuation of the Rayleigh (surface) modes makes the device insensitive. For dF < 5A, the devices have been shown to work successfully, although the
dominant mode of energy propagation is not quite clear (Calabrese et al. 1987; see table 1 of that paper).
4. HYDRODYNAMIC METHODS
These techniques rely on the friction engendered between solid and liquid phases in relative motion to each other. After an initial period of acceleration under a constant applied force, a steady state is reached and the characteristic velocity of particles or liquid is observed. The accumulation of proteins at the solid-liquid interface increases the frictional coefficient, and from this increase the amount of adsorbed material can be calculated.
4.1 The diffusivity of colloidal spheres
The adsorbent is a collection of monodisperse spheres of known size and structure. According to the Stokes—Einstein relation,
D = kT/(6nsVc), ( n )
where D is the translational diffusion coefficient, s the radius of the sphere, and 7/c
the absolute viscosity of the solution. A layer of adsorbed proteins causes the diameter to increase by dA (Fig. 7a), hence the diffusivity decreases by AD:
67T7)C
from which dA may be obtained. This idea has been used by Duckworth et al.
(1978) to determine the thickness of adsorbed polymer layers on small latex spheres. There are three main problems: (i) since it is a difference method it is liable to inaccuracies; (ii) as will be discussed below, equation (12) fails to take into account hydrodynamic interactions between adsorbed proteins; (iii) without knowing the density of protein packing, there is no definite connexion between the measured dA and F.
Bloomfield et al. (1967) and McCammon et al. (1975) have obtained numerical and analytical results respectively for the translation diffusional coefficient D of a sphere to which discrete particles (' subunits') are attached. The simple equation (11) can still be used provided that the radius s is replaced by the equivalent hydrodynamic radius of the assembly s', given by:
s' = (s + dA)[i-i/(ytanh2y)], (13)
where
(14)
These equations are valid for dA <? 5 (McCammon et al. 1975). By substituting s'
for 5 in (11) it can be seen that above 6 « 0 5 , D does not change very much with
6, as had already been found by Bloomfield et al. (1967). Therefore hydrodynamic
measurements are not very sensitive at high #.4
Equations (13) and (14) show that the measured D or AD is a function of two
parameters characterizing the adlayer, dA and 6, and hence without an
4
54 jf- J- Ramsden C
Fig. 7. (a) Spherical colloidal particle (radius s) undergoing diffusive or directed motion in medium C. Shaded circles represent adsorbed protein molecules forming an adlayer of thickness dA. (b) A capillary of radius R bored through medium F and filled with medium
C. Protein molecules adsorbed on the inner walls diminish the capillary radius by adlayer thickness d..
Fig. 8. Light (wave vector k,) incident upon the scattering volume is scattered; the scattered light (wave vector k,) is measured at an angle 6 from the incident beam. An arbitrarily chosen reference particle is situated at O, and a second particle at P.
independent determination of dA (which may, however, be available from a knowledge of the protein structure), 6 cannot be uniquely deduced from the diffusivity of colloidal spheres.
A convenient way of determining D is through quasi-elastic light scattering (QELS), otherwise known as light-beating spectroscopy, optical mixing spectroscopy, photon correlation spectroscopy, etc. (Cummins & Swinney, 1970; Cummins & Pike, 1974; Chu, 1974; Berne & Pecora, 1975). In this method, a small volume of a suspension of identical (and spherically symmetrical) colloidal particles containing v particles is illuminated by a collimated beam of coherent (laser) light (with wave vector k(), and the intensity of scattered light (with wave vector ks) measured at a certain angle 8 (Fig. 8). By way of illustration, let us take just one pair of particles whose relative position is given by the vector r}. Defining
angle of light scattered from the pair of particles is K r;. Considering now the assembly of v randomly placed particles in the scattering volume, the total scattered field is simply the sum of the fields scattered by the individual particles, namely
Es= S ^ e x p t - i K - r , ) , (15)
s
1-1
where A is the amplitude scattered by a single particle. The average total intensity
Is = (\Es\2y = t><|^4|2>, angular brackets denoting the average over time. Since the particles are in constant motion (Brown, 1828), the r} and hence Es are time dependent; the measured signal cannot change infinitely quickly, however, but with a characteristic correlation or coherence time TC, whose magnitude is determined by the motion of the particles and hence by D. Let us measure5 Es beginning at some arbitrary epoch t and continuing for an interval ST, and repeat the measurements over m = \,z,...,Jt successive consecutive discrete intervals all of duration ST. The normalized discrete autocorrelation function # of the random signal Es is
tf(T) = <E,(t)£jr(t + T)/(£t(O £.*(«))>, (16) where T is the interval between the epoch t and the mth discrete measuring interval.6 *<?(T) equals the product of the phase and amplitude auto-correlation functions. Since the mean square value of Es does not change with time, the amplitude autocorrelation function simply equals A2, and we obtain for the phase
autocorrelation function:
« ( T ) = - S <exp(iK.[r,(t + T)-r,(O])>. (17) For scatterers undergoing translational diffusion (Brownian motion) characterized by their diffusivity D, carrying out ensemble average and sum (Cummins & Swinney, 1970) yields:
<&{T) = exp{-DKh). (18)
A plot of the logarithm of the autocorrelation function against T therefore yields a straight line of slope DK2, which is the reciprocal of the coherence time TC. For measuring D of small colloidal particles a million channels of duration o-i ms would be typical measurement parameters.
Uzgiris & Fromageot (1976) have pointed out that the thickness dA which is required in order to be able to determine 8 or F from D (equations 11-14) can be obtained from the way the scattered light intensity /s changes as a film is adsorbed onto the particle surface. Provided that s <£ A, the polarizability aF of the naked sphere is, according to the Rayleigh approximation,
aF = 53(nF - n%)Hn% + zn%). (19)
5 For details of how the measurements are carried out, namely, how the photons in the scattered field are
converted to a train of photoelectrons via a photomultiplier tube, see Cummins & Swinney (1970).
6 One may also measure the optical power spectrum, which is just the Fourier transform of the desired
56 J.J.Ramsden
If AIS is the change in scattered intensity due to the adsorption of an adlayer, then (Uzgiris & Fromageot, 1976)
AI. _ aFA - a | _ 6(nA - „«) (ng + 2*A) dA
-n%) s ' ( 2 O )
where ocFA is the polarizability of the sphere plus adlayer. This equation is valid for dA <£ s. It will be noticed that there is a contradiction between the condition s <^ A used in obtaining equations (19-20), and the condition dA -4 s. The first implies that the colloidal particles should have a radius less than A/20 ~ 30 nm, which is not much bigger than the value of dA expected from proteins ~ 10 nm in diameter (and which, moreover, may lead to the complications in the adsorption behaviour referred to earlier3). For larger particles the full Mie theory should be used to obtain equations corresponding to equations (19) to (20); numerical simulations show, however, that the error introduced through using equation (19) may be less than typical experimental errors (Uzgiris & Fromageot, 1976).
Sedimentation. In this classic method, the motion of particles moving in a strong
gravitational field g is observed. Once steady state (velocity v) has been reached, equating the gravitational force with the frictional force yields:7
vF = 2s3(pF-pc)g/(97i). (21)
From the difference vFA — vF, the increase dA in particle radius can be deduced, provided that pFA is known, e.g. from allowing the particles to equilibrate in a density gradient.
4.2 Capillarity
According to the well-known Poiseuille's law, the product of flow rate J* and viscosity rj of a Newtonian liquid flowing through a capillary of radius R is proportional to R*. When proteins are deposited on the walls of the capillary, R obviously decreases and, provided that R is suitably chosen, a large change in flow may result (Fig. jb). The working equation is
V
'^\\R-dr
where \\R\\ is the root mean fourth average denned by:
WRV-jjXRt, (23)
7]'c the viscosity of the protein solution, and SF^ the flow rate in the presence of an adlayer. In practice, not a single capillary but a sintered disk containing N capillaries is used (Rowland & Eirich, 1966 a). There are a number of practical difficulties associated with the evaluation of dA from J<\ For example, the ' This equation is a simplification of the exact expressions of Alexandrowicz & Daniel (1963); moreover the work of these authors preceded the refinement of the simple Stokes-Einstein expression for the friction due to adlayers formed from discrete subunits (see above, equations 13—14).capillaries will usually be characterized by a distribution of radii R. Nevertheless, useful results could be obtained with polymers by Rowland & Eirich (19666). They compared the isotherms obtained by the capillarity technique with others obtained by the simple solution depletion method (§2) to determine both density and thickness of the adsorbed layers. The method was later applied to protein adsorption by de Baillou et al. (1984).
5. ELECTRICAL METHODS
When a protein dissolves in an aqueous solution the ionizable amino acids (to which the solution is accessible) in the peptide chain will either lose or acquire a proton and the molecule will become charged. An average globular protein may have dozens of such groups.8 The adsorption of proteins at an interface therefore implies the accumulation of charge there; the methods discussed in this section aim to measure this charge. If the total accumulated charge were proportional to the number of proteins, then, knowing the net charge per protein molecule, F or 6 could immediately be calculated. Therein lie both the difficulties and advantages of electrical methods. In the case of mass the correspondence between the measured attribute (total adsorbed mass) and /"is exact; however, in the case of charge the correspondence is more complicated. The solid-solution interface is notoriously complex, and hundreds of monographs have been devoted to this topic alone. The value of electrical methods is that they may be used, in conjunction with other techniques providing an independent estimate of /*, in order to yield detailed information about the electrostatics of the adsorption process. Another advantage arises from the requirement that adsorption takes place on electrodes: redox operations on proteins and their prosthetic groups can be carried out in situ, and the resultant changes in absorption kinetics, conformation, packing density etc. can be observed directly (Lecompte et al. 1984).9 Electrostatic interactions are important because many of the surfaces to which proteins are adsorbed are, like the proteins, ionized in contact with aqueous solutions (Healy & White, 1978). Even non-ionizable surfaces may acquire a charge through the adsorption of small ions from solution. Electrostatic forces may, therefore, play a key role in protein transport to and adhesion at surfaces.
Two basic strategies have been applied to electrical methods. In the first, the * There is of course enormous variety between different proteins; this figure is only mentioned to give an order-of magnitude idea; large extracellular matrix proteins with molecular weights approaching a million may have hundreds of charged groups. At the isoelectric point the net charge qp will be zero, but there
are usually patches of oppositely signed charge on the protein's surface. Elsewhere, at all but extremes of pH, Z|2j J> E^j = qfl where zs is the charge of thej'th residue. This may have dramatic consequences on the
shape of the molecule (e.g. Rocco et al. 1987). Unfortunately data on the charge of proteins over the physiologically interesting pH range is rather sparse. Far fewer have been characterized electrically than structurally; often only the isoelectric point is known (Righetti et al. 1981). Various formulae have been proposed to predict the net charge of a protein at any given pH from the pKos of the constituent amino acids
(see the discussion by Kuramitsu & Hamaguchi, 1980), although it is uncertain how generally reliable such procedures are. As far as the interactions between a protein molecule and the electrical double layer are concerned, in the following discussion the protein will be considered to be a point polyion, rather than a small spheroid with its own surface and possessing itself an electrical double layer. The latter case has been adequately handled in the sphere of colloid chemistry (Verwey & Overbeek, 1948).
58 J.y. Ramsden
perturbation of the charge distribution at the interface due to adsorbed proteins is analysed empirically. In the second, the accumulated charge at the solid surface
QA per unit area is measured and the surface excess deduced from
r=QJqp, (24)
where qp is the net charge per protein. The second approach is the simpler; however, if small ions are concomitantly taken up by the interface when the protein is adsorbed, as seems to be a fairly general feature (Norde & Lyklema, 1979; van Dulm et al. 1981), the simple equation (24) will no longer hold, and the first strategy must be followed. It is probably an understatement to remark that difficulties will attend this approach.
Basic properties of an electrified interface. If some of the groups on the surface
(supposed to be planar) of the solid are ionized, or ions of one sign are preferentially adsorbed from the electrolyte solution, the surface (subscript o) will be characterized by a charge density cr0 and potential \jrQ. Specifically, in the case of metal and semi-conductor oxides, which become hydroxides in water, the charge usually arises through ionization of the —OH groups, i.e. through the equilibria (Healy & White, 1978):
and (25)
where M = Si, Ti, Ta, Al, etc. Protons are thus the potential determining ions of oxides, as well as of phospholipid membranes.
The requirement of overall electrical neutrality ensures that counterions are present, and, were thermal agitation absent, they would arrange themselves in a plane parallel to and at a distance de from the surface, de being of the order of the size of the ions, the system thus forming a parallel plane condenser. In the absence of specific counterion association with the surface, however, thermal agitation disperses the mobile counterions into a diffuse layer (Fig. 9). Using the Poisson-Boltzmann equation Gouy (1910) and Chapman (1913) derived the relationship between i/r0 and <r0:
cr0 = V(ekTcb) 2 sinh (efo/(2kT)), (26)
where cb here refers to the bulk ion concentration. This relation is valid for 1:1 electrolytes. The decrease of potential perpendicular to the surface is given by: tanh(e^*)/(4*T)) = t a n h ( ^0/ (4* r ) ) e x p ( - * / W ^ ) ; (27) the measure of the decrease is the Debye screening length Wddl, given by
Zqjc,). (28)
It is this quantity, rather than the Bjerrum length e2/(4.nekT), which gives the
characteristic length of electrostatic phenomena in the presence of mobile ions. In a decimolar solution, the surface potential is screened within less than 1 nm
c ddl (i) Cox Oi) :ec4 (iii) (a) (b)
Fig. 9. (a) Potential distribution perpendicular to the solid-liquid interface. The bulk potential (z -» 00) is zero. The potential at the surface of F is ^0 and at the surface of the
adlayer, f,. £ is the potential at the so-called slipping plane dividing the moving from the stationary liquid, (b) (i) Equivalent circuit of the diffuse double layer, (ii) Equivalent circuit of a protein adlayer on a layer of insulating oxide coating a'metal electrode, (iii) As (ii), taking account of the discontinuity of the protein film.
(Gouy, 1910). Thus Wddl may be comparable to, or smaller than, the characteristic
size of a protein molecule, dA. While this is explicitly taken account of in the z
direction, it means that the lateral distribution of charged species is electrically non-uniform, which can result in discrepancies between experimental results and predictions made on the basis of uniformity (see e.g. Cohen & Radke, 1991). This constitutes an important difference between electrical and optical methods, for which the characteristic length is the wavelength of light(see §6), i.e. A £> dK.
Once the potential distribution f{z) is known the concentration of ions at any point in the solution can be found using a Boltzmann expression:
c{z) = e6exp( — q>lr(z)/(kT)), (2Q)
\ 7/
where q is the charge of whatever species we are considering. This equation has an important implication for the pH at surfaces for which protons are potential determining ions. Let us define a surface pH, pH0, as - Iog10/z0, where h denotes
proton activity. According to (29),
PHQ = ~^ogl0(hbexp ( — ei/ro/(kT)). (30)
The point of zero charge of SiO2 is around pH 2, and of TiO2, pH 5-6 (Hunter,
•981). These and similar oxide surfaces are therefore expected to be negatively charged at physiological pH. Equation (30) shows that the surface pH of both oxides and other biologically relevant surfaces (e.g. lipids) may be a couple of units below bulk solution pH.
60 J. y. Ramsden
The capacity Cddl of the diffuse double layer is ao/i/ro. If e\]r0 <^ zkT, the hyperbolic function in (26) can be linearized to yield
Cadl = crlf0 = e/Wdil, (31)
i.e. charge and potential are proportional to each other and the double layer can be represented as a parallel plate condenser, one plate of which is the solid electrode and the other the diffuse portion of the double layer, represented by a plane at distance z = Wddl from the solid-liquid interface.
Although the Gouy-Chapman formalism has many apparent shortcomings (such as neglect of the size of the ions, and of the variation of e near the surface) it works remarkably well, for the liquid mercury electrode in particular. The presence of a layer of specifically adsorbed counterions (Stern-Hamburg, 1924; Ermakov, 1990), layers of ordered water (Bockris et al. 1963), etc. complicate the description of the interface. These and other complications can be explicitly taken into account, but usually not without the introduction of parameters whose values cannot be independently determined, and the resulting systems of equations are no longer convenient to handle.
5.1 Impedance measurements
An electrochemical cell is set up consisting of a working electrode on which adsorption is to take place, a reference electrode, and a counter electrode. The working electrode should be ideally polarizable so that no faradaic currents flow, and its impedance should be much greater than that of the counter electrode. The potential difference between the working and counter electrodes is adjusted such that the potential difference between the reference and the working electrodes remains constant. Under these conditions the impedance of the cell, which can be measured using standard methods (Bard & Faulkner, 1980), is that of the working electrode at an absolute electrochemical potential i/r0. It has been found that the adsorption of proteins on its surface causes the capacity to decrease (Lecompte et
al. 1984). If an empirical Frumkin-type equation is used:
c = c
o(i-d)+dc
lt(
3 2)
where Co is the capacity of the bare electrode, and Cx the capacity after saturating the surface with protein, 6 can be determined. This method can only be considered approximate. The range of validity of the assumptions that C1 corresponds to 8 = 1, and that C, presumably corresponding to Cddl (equation 31) varies linearly with 6, are generally unknown. However, it may be the best we can do, for the explicit relationship in equation (26) between i/r0 and cr0 is only valid for the liquid mercury electrode (equivalent circuit shown in Fig. <)b(i)).
Liquid mercury has only limited interest as a substrate on which to adsorb proteins. Solid metals can also be used but impurities and unevenness of the surface complicate the impedance (Stoner & Srinavasan, 1970), apart from the fact that most metals are not ideally polarizable and the standard treatment of the interface does not apply, although this will not necessarily affect the use of an
empirical adsorption isotherm. The use of a rotating disk electrode (Bernabeu et
al. 1989) is an important extension which allows experiments to be carried out
under precisely defined and controllable hydrodynamic conditions (Levich, 1962). A slightly more elaborate setup has been investigated by Gebbert et al. (1992). The working electrode (tantalum) was covered by a thin, but insulating, layer of tantalum oxide10 (to which specific protein ligands (antibodies) were attached). The capacitance C0I of the insulating oxide layer (~ 1 /iF/cm2) is much smaller than Cddl (~ 40 /(F/cm2) and the latter can hence be neglected. The formation of a layer
A of adsorbed protein is supposed to result in a capacitance CA in series with Cox
(Fig. 9&(ii)). The measured cell capacitance is then
C = C0XCJ(C0X + CA). (33)
Knowing Cox from prior measurement on the clean electrode, CA may then be
determined from C. There is, however, no explicit equation connecting CA with F or 6, although one might guess at a relation of the type
CA = eA/dA. (34)
Unless the protein forms a homogeneous, insulating layer, however, the electrolyte solution establishes an equipotential surface in contact with the oxide layer everywhere except where a protein molecule is adsorbed. Fig. gb{n) must be replaced by the equivalent circuit in Fig. 96(iii), and equation (33) by the corresponding measured cell capacitance:
C = (i-d)Cox + 6CoxCA/(CBX + CA). (35)
This equation has two unknowns, 6 and CA, which may be determined by
measuring the impedance of protein adsorbed on oxide layers of two different thicknesses in order to evaluate both 6 and CA (Stenberg et al. 1979). These
workers found, using such a technique, that CA was roughly proportional to 6,
although the proportionality may depend on the particular protein, pH, and salt conditions used. Therefore, use of the simpler equation (33) appears to be justified, and could be employed to determine 6; it may be speculated that dA oc 6. Semiconductor electrodes. The use of semiconductor electrodes in principle
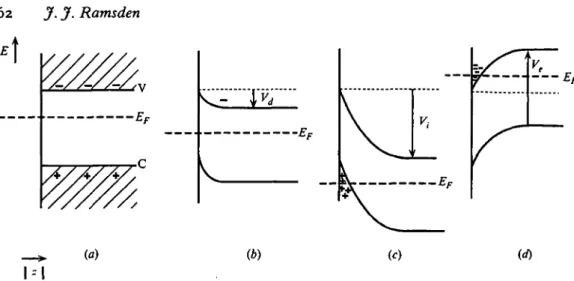
allows more information to be obtained from impedance measurements than is possible with metallic electrodes. Fig. 10a shows, for a moderately doped n-type semiconductor, the energy bands when the surface and bulk electrochemical potentials are equal. The surface potential is supposed to be the same as the electrochemical potential of the bulk electrolyte, which is determined by the potential difference between the counter and working electrodes, or by a suitable redox buffer (Reinders & de Minjer, 1938). If this surface ( = bulk electrolyte) potential is lowered slightly by an amount Vd, equilibrium must be reestablished
by electron exchange between the solution-surface domain and the semiconductor. Conduction band electrons will move out of the bulk semiconductor until the electrochemical potentials are again equal. The situation
10
Stelzle and Sackmann (1989) have carried out a similar experiment using a lipid bilayer in place of the oxide.
62 J. jf. Ramsden
v
(a) (b) (d)
I-I
Fig. 10. Energy bands in an n-type semiconductor, (a) At equilibrium. The electrochemical potential of the electrolyte equals that of the electrons in the semiconductor (the Fermi level, EF. V and C denote respectively the valence and conduction bands of the
semiconductor. (6) Bands bent by the application of a potential difference Vd between the
surface and the bulk of the semiconductor. The reequilibration of the electrochemical potentials within and without the semiconductor requires electrons to flow from the bulk of the semiconductor to the electrolyte and hence a depletion layer is created (region of band bending), (c) The application of a potential | V,\ > | Vd\ results in such severe band bending
that positive holes (defect electrons) accumulate at the surface. The surface conductivity of the semiconductor thus depends on the minority carriers, (d) Application of a potential of opposite sign to that of Vd creates an enrichment zone of majority carriers at the surface.
is analogous to the metal-semiconductor contact (Schottky, 1942). These electrons must come from donors, which are ionized and form stationary positive charges, resulting in a space charge region adjacent to the surface in which the conduction band is heavily depleted of electrons, with width:11
Vd/(e2ND)]. (36)
This equation may be compared with (28). Analogously to the diffuse double layer in the electrolyte (equation 31), the capacitance per unit area is given by
Csc = eJWsc. (37)
Typically Csc ~ 1 /iF/cm2 and the equivalent circuit of the electrochemical cell reduces to a single condenser (Fig. n i ) as in Fig. o6(i). If the surface potential is changed by the adsorption of charged proteins, Vd must be replaced by Vd + Vp, where Vp, the potential due to adsorbed proteins, is given by:
v, = QJC
A- (38)Knowing the charge qp per protein, the measurement of the change in impedance of the semiconductor space charge allows T^to be determined from equation (24). If neutral proteins bearing a dipole moment /ip are adsorbed, then
11
Here and in the following, the equations have been somewhat simplified. The full treatment can be found in standard textbooks, e.g. Myamlin & Pleskov, 1967; Pleskov & Gurevich, 1986).
(39) A difficulty is that C\ is not necessarily known, and indeed, as mentioned above, may be proportional to F. Moreover, CA « Csc, and therefore the additional
capacitance CA should be added in series with Csc. Impedance measurements on
two electrodes differing only in their doping density ND would allow CA and Csc
to be determined, and hence F. Fig. 11 a shows schematically the measuring set-up. The application of such measurements to protein adsorption does not, however; appear to have been reported. A general problem is that the real equivalent circuit of a semiconductor electrode is vastly more complicated than is suggested by Fig. 11 b (Gobrecht & Meinhart, 1963; Harten, 1964; Boddy, 1965; Myamlin & Pleskov, 1967; Pleskov & Gurevich, 1986), even with judicious choices of measurement frequency and Vd. The determination of the parameters
from an impedance spectrum can be made by fitting to equivalent circuits of arbitrary complexity, but unless there is an independent physical basis for the chosen circuit, the procedure evidently has little value.
The effect of accumulation of charge from adsorbed proteins at the surface of a semiconductor electrode is exploited in another kind of device, the field effect transistor or FET (Sze, 1981), in which the lateral current between two electrodes embedded in the semiconductor surface is measured (Fig. 11 c). The conductivity
Ksubs of the subsurface layer is
-Ksubs = enfi, (40) where /* is the carrier mobility and n the concentration of carriers in the subsurface layer, which in turn is given by
n = ni + NDtxp(eVd/(kT)), (41)
nt being the intrinsic carrier concentration of the undoped semiconductor. Fig. 10
shows the various possible regimes for an n-type semiconductor. In (c), the applied voltage V = Vt is sufficiently negative to drive the interface into inversion and
current is mainly carried by defect electrons (positive holes); in (d) an enrichment layer is formed by an applied potential of the opposite polarity. In the inversion region the current ID from the source to the drain at a given source-drain potential VD (Fig- 11 c) depends approximately linearly on the voltage Vp due to protein
adsorption (equation 38) and the preset gate voltage VG (Sze, 1981):
h~T^Co^Vc+VP-VT)VD, VD4(VG+Vp-VT), (42)
JLi
where VT, the threshold voltage, is given by:
(43)
(</rB is the difference between the actual and intrinsic Fermi levels) and L and W
are respectively the length and width of the channel. Therefore, Vp and hence F
can be calculated from a measurement of ID as in the impedance measurements
64 J. J. Ramsden
Fig. I I . (a) Scheme of cell for measuring the impedance of a semiconductor electrode, a, adsorbed proteins; b, bulk semiconductor; c, cover medium (electrolyte solution); e, ohmic contact; g, counterelectrode. Practical impedance measurements of semiconductor junctions are discussed by Popkirov & Tabov (1982). (b) Simplified equivalent circuit of a
semiconductor electrode in depletion (corresponding to Fig. 106). C,c is given by equations
aqueous solutions (Caras & Janata, 1988). A lot of work has been put into them because they offer the possibility of miniaturized immunoassay devices which can be interfaced directly to sophisticated, integrated circuitry, and considerable success has been achieved with ion-sensitive FETs (ISFETS). For this type of application, it is not necessary to convert ID into P. A problem with all these semiconductor devices is the chemical reactivity of the semiconductor surface in the presence of water (Gobrecht & Meinhart, 1963; Efimov & Erusalemchik, 1963), which results in the formation of hydrated oxide layers at the surface, and the response drifts with time.
Electrical measurement of adsorption on lipid membranes. Bilayer lipid membranes
are slightly compressible; compression can be induced by applying an electrical potential across the membrane. Since capacitance is inversely proportional to thickness, membrane capacitance is a function of transmembrane potential (Alvarez & Latorre, 1978):
(44)
assuming here that the membrane potential arises solely through the adsorption of proteins on one side of a symmetric bilayer. CM 0 is the capacitance in the absence of a transmembrane potential. If a sinusoidally varying potential is now applied to the bilayer lipid membrane the current response will show second order harmonics whose magnitude is proportional to Vp due to the nonlinearity of the impedance (Cherny et al. 1980). Measurement of the amplitude of the second harmonic (or, better, the applied potential — Vp required to make it disappear) is a sensitive way of determining Vp. The technique is then called the inner field
compensation method (IFCM). F is calculated from Vp using equations (38) and (24).12 If Vp is determined using the null balance technique, it is not necessary to know the constant a; otherwise a could be determined by measuring Vp for a series of asymmetric membranes incorporating small numbers of ionizable lipids (e.g. a mixture of phosphatidylcholine and phosphatidylglycerol) on one side. The method was successfully applied to measure the kinetics of the adsorption of synthetic polyions to phosphatidylcholine membranes (Ermakov et al. 1985), and there-appears to be no reason for not applying it to protein adsorption problems, although no results have to date been reported.
into account at low measuring frequencies, (c) Insulated gate (metal oxide) field effect transistor (MOSFET) adapted to measuring adsorption from solution, a, adsorbed proteins; b, bulk semiconductor (conducting channel); c, cover medium (electrolyte solution); d, drain electrode; g, counterelectrode; ox, oxide insulating layer; s, source electrode, n, p, and np refer to the doping of the various regions of the bulk semiconductor. VG is the potential
applied between the oxide surface and the semiconductor bulk. Fj is the source-drain potential. The drain current ID is measured across the load resistance RL.
1! In principle, the same technique can be applied to the semiconductor electrode - with or without a
lipid membrane - which is preferably biased before the addition of protein to the system such that no higher harmonics appear, a condition which, it may be added, is almost impossible to achieve because additional nonlinear impedances such as surface states are also present. An attempt has, nevertheless, been made to apply the method to study the kinetics of protein adsorption onto a platinum electrode (Nakata et al. 1992), without it having been possible to evaluate F, however.
66 Jf. J. Ramsden 5.2 Electrokinetic methods
In the cells we have considered in the preceding section, no special attention has been paid to motion of the liquid phase relative to that of the solid. If such motion is caused to occur, then the relative velocity will increase continuously from zero at the interface to a maximum value far from it. In treating the electrostatics of the problem, the approximation is usually made that from z = o to d^ the velocity is zero, and for z > d^ it has its greatest velocity. The solid thus behaves as a body with a potential £ relative to the bulk liquid phase (Fig. 9); the problem of electrokinetics is firstly to measure f and secondly to calculate i/r0 from £ (Hunter, 1981). If a potential difference E is applied parallel to the interface, a force Fj =
<xE appears, where cr = £e/d and d is the distance separating the two phases, which
tends to displace one phase relative to the other with velocity u. This force is opposed by a frictional force F2 = — if du/dA, where r/ is the kinematic viscosity of the liquid, and A the thickness of the liquid layer in which the velocity is changing. After a short time a steady state is reached, i.e. Fj = — F2, and supposing du/dA = u/A and A = d, we obtain
u = e£E/ri (45) the Helmholtz-Smoluchowski equation, the basic equation underlying all electrokinetic phenomena.13
Electrophoresis. The solid phase is in the form of uniform colloidal spheres or
Hposomes, suspended in a liquid, and accelerated by an applied electric field. The steady state velocity is observed either through a microscope or via quasi-electric light scattering.14 Various corrections have been applied to equation 45 (Wiersema
et al. 1966; O'Brien & White, 1978; Mangelsdorf & White, 1990). Electrophoresis
alone is not suitable for measuring F because the electrophoretic mobility u / E depends on both the friction coefficient, which changes with dA (equations 12-14), and on £, which changes with QA (equation 26), and a unique solution for F is not possible.
Streaming potential. The liquid phase is driven by pressure P along a conduit,
which we suppose to have the cross section of a rectangular prism of height H much smaller than its width and length. As a result, a streaming potential Vstr is measured, which is related to £ according to (van Wagenen & Andrade, 1980):
£ = {K
b+ 2KJH)
4m,
cV
str/(Pe), (46)
where the K are bulk (subscript b) and surface (subscript o) conductances. Van Wagenen & Andrade (1980) maintain that Ko is negligible, and the other parameters can be determined independently. Therefore, £ can be converted to ifr0, using equation (29), ifr0 after adsorption subtracted from i/r0 before adsorption to
13
Either the solid or the liquid may be stationary, and either £ engendered by an applied force or the velocity engendered by an applied electric field may be measured.
14
See §4.1. The phase auto-correlation function (equation 18) then equals exp(iK.ur) Cummins & Swinney, 1970). This possibility is of particular interest, because initially the hydrodynamic radius of the colloidal substrate can be determined in the absence of an applied electric field and in the absence of protein. As adsorption proceeds, the autocorrelation functions in the absence and presence of an applied electric field can then be recorded, to allow the relationship between dA and QA to be examined in detail.
yield Vp, and Vp converted to F using equations (38) and (24). Absolute
determinations of F{t) have not, however, been reported; in practice too few of the necessary parameters are known independently to make the calculation reliable. Norde & Rouwendal (1990) first measured the adsorption isotherm using a solution depletion technique, obtained an empirical relation between £ and 6 by measuring the electrophoretic mobility of the adsorbent particles, and then used the streaming potential measurement to determine 6 in real time.
6. OPTICAL METHODS
Elements of catoptrics. When a ray of light is incident upon the plane separating
two media of different refractive indices,15 the ratios of the reflected and incident amplitudes are given by the well-known Fresnel equations:16
<%s = ArJAt.s = - sin (d - 0')/(sin (0 + 0')) (4 7)
and
^ = ArJAUp = tan(0-0')/(tan(0 + 0')) (48)
for light polarized perpendicularly (subscript s, senkrecht) and parallel (subscript
p) to the plane of reflexion. Q is the angle between the incident light and the normal
to the planar boundary separating the two materials, and 6' the corresponding angle of the refracted beam. The reflected beam makes an angle d with the normal (Fig. 12). 6' can be eliminated from these equations by using Snell's law:
sin 6' - (nF/nj) sin 6, (49)
and, defining two quantities corresponding respectively to the components of the reflected beam parallel and perpendicular to the interface:
(50) and
kF = knFcosd = k\/(nF — N2), (51)
where k = zn/A is the modulus of the wave vector for light of wavelength A, and a third quantity
kj = kV{n*-N*), (52)
the Fresnel coefficients can be written as:
^ = (*F-*j)/(*F + *j) (S3) and
* / V S / 4 + *J/«J)- (54)
As 6 increases from o, at a certain angle given by arcsin (wj/«F), sin 6' will equal
unity and further increase in 6 results in an imaginary 6'. This is the regimen of 15 Here and in what follows F denotes the optically denser medium in which the beam of light originates.
The rarer medium is denoted by J.
" These equations can be found in standard texts on optics, such as Jenkins & White (1950).
68 J. J. Ramsden
Fig. 12. Path of a totally internally reflected light beam at the F, C interface between two dielectrics. A is a thin adlayer of adsorbed proteins (its thickness is greatly exaggerated with respect to Azr c). An ellipsometer measures the polarizations of the incident (/,) and
reflected (/r) beams. Inset: refractive index profile of the interface.
total internal reflexion. The Fresnel coefficients are now complex, with modulus unity since all the energy is reflected, but the phase of the light changes by 0, i.e.
RT j = exp (i<PFfJ). (55)
The attributes of the reflected light are altered by the presence of a layer of adsorbed molecules at the F, J interface. Let the adsorbed layer form a uniform, isotropic layer A characterized by a geometrical thickness dA and a concentration within the layer cA (Fig. 2b). Since dA <^ A, this interfacial or surface layer constitutes an effective medium with a refractive index profile shown on the extreme right of Fig. 12. The refractive index is related linearly to cA according to the relation (de Feijter et al. 1978):
nA = dn/dc (56)
which has empirically been shown to hold for homogeneous solutions of proteins up to concentrations of at least 4oomg/cm3 ( = F= 0-4/ig/cm2). cA can be eliminated between equations (56) and (4) to obtain the working equation
r = dA(nA-nc)/(dn/dc). (57)
When the light coming from J first meets the F, A plane, it is partly reflected and partly refracted. The refracted beam undergoes multiple partial reflexions at the A, C and A, F interfaces, and the resulting wave reflected back into F is the sum of the partial plane waves:
^ A exp ( - 41