Trace Analysis on Capillary Columns. Selected
Practical Applications: Insecticides in Raw Butter
Extract; Aroma Head Space from Liquors;
Auto Exhaust Gas
by K. Grob and G. Grob, Department of Organic Chemistry, University of Zurich, Switzerland
Abstract
Trace analysis on capillary columns becomes feasible provided appropriate injection techniques without stream splitting are used. To demonstrate potentialities and limita-tions of the methods, we investigated practical applicalimita-tions, the conditions of which were as dissimilar as possible. In-secticides in dairy products can be estimated by direct analysis of the raw petrol ether extract, without previous purification by column chromatography. 2-4 91 of extract are injected without splitting en a short inlet capillary fitted in a separate injection bloc. The inlet capillary is then connected to the capillary column mounted in the column oven with electron capture detector. Analysis is started by rapid heating to a constant temperature or by temperature programming resp. Head space analysis is another case in which trace components are important. Whereas several workers reported trapping of head space vapors in capillaries at low temperatures, we emphasize avoiding candensation, e.g. of water vapor, in the capillary. Al] sampling is done, therefore, near the original temperature of the head space material, i.e. at room temperature. In the case of coqnac aroma analysis in which most of the water and ethanol vapor are vented through the inlet capillary, the influences of most sampling variables—gas volume, length of inlet capillary—are studied. In the analysis of auto exhaust gas, again, bypassing of water is an important detail. In addi-tien to hydrocarbons originating directly from the fuel as investigated by several authors, we found many combustion and conversion products, primarily naphthaline derivatives and phenols.
Introduction
It has long been common opinion that the special ability of capillary columns was high separation effi-ciency, whereas, due to their geometrical structure, analyses of large and highly diluted samples were out of their competente. In a previous paper (1) we studied the concentration effect occuring, when during injection the temperature of the column is held at least ca. 50' below normal analysis temperature. We showed that to obtain concentration on the column with optimum re-sult of the subsequent analysis, it is not necessary to freeze the injected sample in a small portion of the column.
The coneentration effect allows the sample size and, in parallel, the injection time, to be drastically increased without locs of separation. In addition to making stream splitting dispensable, this allows the
corresponding drastic increase of sample dilution thus bringing about the conditions of trace analysis.
To check the applicability of our methods we selected analytical problems with completely differ-ent sample types. Not being experts in either of the corresponding specialized areas we wish to emphasize that we present our procedures and results without trying to compare their practical value with that of actually used methods.
General Considerations
Liquid sample size; handling of solvent
In contrast to the concentration conditions with freezing we adjust the injection conditions in such a way that the solvent is not strongly retained. Thus even large amounts of solvents do not harm the column since no plugging of the capillary at the concentration point is possible and, furthermore, no rapid heating of the frozen sample with corresponding formation of a very concentrated zone of gaseous solvent is needed.
Therefore, the sample size for direct injection is only limited by the need of resolving the most volatile sample components from the solvent. Excessive amounts of solvent will be eluted as very braad peaks obscuring the earlier sample peaks. A less of ten observed limita-tion may derive from special detectors such as the ECD which may be heavily disequilibrated by large amounts of solvent vapors.
A substantial increase of sample size beyond these limits is practicable using the solvent bypassing tech-nique. If there is sufficient volatility differente between the solvent and the most volatile sample component the solvent can be bypassed completely. In the other cases the optimum compromise must be chosen. As a rough rule applying to capillaries with .3-.35 mm, i.d., we use direct splitless injection up to 2-3 µl and solvent by-passing for larger sample sizes.
Inlet capillaries for solvent bypassing
We were interested to know within what limits the inlet capillary has to be of identical dimensions and
1. Grob, K., and Grob, G., J. Chromatog. Sci. 7, 587
(1969).
coating as the main column. The results were the following:
To avoid losses in separation efficiency the i.d. as well as the thickness of the liquid film should remain within ca. ± 10% of the figures for the main column. On the other hand, the choice of the liquid phase is completely free, i.e. we did not observe any significant change in efficiency when, instead of identical coatings, we combined a nonpolar column with an inlet capillary coated with a liquid phase of high polarity and vice versa. To facilitate solvent bypassing the polarity of the inlet capillary should, as a rule, differ as much as possible from that of the solvent.
Gaseous samples
Trace components in gaseous mixtures have been concentrated on capillaries by several authors (2-6) . Their normal procedure was to cool a short piece of capillary with dry ice or liquid nitrogen. The sample size becomes strongly limited especially when large amounts of condensable vapors such as water are pres-ent. To avoid plugging of the capillary it would seem helpful to raise the concentration temperature to a point where condensation without freezing occurs. With glass capillaries it is easy to observe that every con-densed droplet having attained a critical size starts moving with the flowing gas and destroys the coating film along its way while, at the former position, a new drop is built up. A similar effect is normally observed even with freezing. Upon heating the cooled section, the condensed material, fust after melting, is blown away before being vaporized.
The only way to overcome this trouble is to avoid condensation. For example, with gases almost saturated with water or ethanol, this means that during sampling, the capillary must be held at the temperature of the gas mixture. The concentration capacity of the method is limited by the possible loss of volatile material being vented at the end of the inlet capillary. In many in-stances partial venting, e.g. of water vapor, is desired. To some extent this bypassing of sample components can be made selective by properly choosing the polarity of the coating for the inlet capillary.
If the concentration effect is stilt insufficient, fur-ther concentration of trace substances can be accom-plished by using the method described by Janak and coworkers (7) based on frontal analysis. We shaIl discuss the application of Janak's technique in a sep-arate paper.
Appiications with Liquid Injection
"Semi-Volatiles" of tobacco smolre
In this instance a very dilute solution, the bulk of which is volatile, must be analyzed. The relatively high dilution derives from the aseed of dissolving antagonis-tic substances, such as long chain paraffins with glycols, in the same solvent system and from the danger of secondary reactions between reactive smoke compon-ents. Up , to 5 µl of smoke solution were injected without splitting on an inlet capillary using solvent bypassing. This work has been described separately
(8,9).
butter extract with added insecticides
Ald-Lmdone 36 45 DOT fi80 n9 /ml 2.o,u.1, x8
I
3 butter extract, no additiveseb
75 0
30 nq/ml G
4.0
butter extract with added insecticides
O 5 10 15 min
20' 25• prop, 6•/mn isnlfl
50' 2r°•
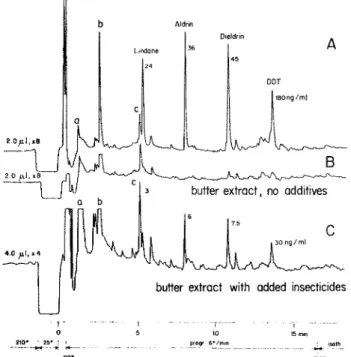
Figure 1. B. raw hexane extract from "insecticide free" but-ter; A and C: same extract with added insecticides. Glass capiilary, 20 m/0.32 mm, silicone oil SF 96. Carrier hydrogen, 0.6 atmos. (3.5 mI/min). App.: Carlo Erba, Mod. GI, ECD, 63Ni, 3.5 V DC, 350°, 65 ml nitrogen/min. Atten. 100 x 8 and 100
x 4 resp.
Insecticides in raw butter extract
Here, relatively volatile trace substances dissolved in a large amount of butter fat must be vaporized and resolved. The determination of insecticides in dairy products actually used involves a laborious purifica-tion of the hexane extract. A drastic simplificapurifica-tion is conceivable provided two conditions are fulfilled: 1.) the insecticides are quantitatively evaporated out of the raw extract without interfering evaporation of fat or other butter constituents; and 2.) the insecticides are effectively concentrated on the capillary column.
The chromatograms in Figure 1 are obtained in the following manher: a 1 m piece of glass capillary coated with silicone oil SF 96 is inserted, with most of its
2. Heins, J. T., Maarse, H., ten Noever de Brauw, M. C., and Weurman, C., J. Gas Chromatog. 4, 395 (1966). 3. Weurman, C., Proc. 2nd Internat. Congr. Food Sci.
Technol. 298
(1966).-4. Ten Noever de Brauw, M. C., and Brunnée, C., Z. Anal. Chem. 5, 321 (1967).
5. Ten Noever de Brauw, M. C., and Schuy, K. D., Proc. Internat. Symp. Chromato-Mass Spectrometry,
Mos-cow, 214 (1968).
6. Grob, K., and Grob, G., J. Chromatog. Sci, 7, 584 (1969).
7. Novak, J., Vasak, V., and Janak, J., Anal. Chem. 37, 660 (1965).
8. Grob, K., and Voellmin, J. A., Beitr, Tabakforsch. 5, 52 (1969).
9. Grob, K., and Voellmin, J. A., J. Chromatog. Sci. 8, 218 (1970).
length at room temperature, in a separate vaporizer block designed as shown by Figure 1., p. 585 in a previous paper (6) . The block has the same carrier gas supply as the vaporizer in a regular gas chromatograph but has no splitting device. A loose plug of glass wool in the vaporizer tube protects the capillary entrance from contact with sample droplets produced by rapid injection.
The injection procedure is described on p. 589 (1). The exact conditions are: flow through inlet capillary 2 mI nitrogen/min, inlet pressure .05 at block tempera-ture 210°. 60 seconds after rapid injection (to provide wide distribution of non volatile material) of 2 µl, the inlet capillary is withdrawn from the block. After con-necting its outlet end to the main column, the inlet end is fitted into the carrier gas supply. As soon as the air is eluted, i.e. when the detector indicates elution of
solvent, the column oven is closed and rapidly heated
to 110°. From 110-210° the temperature is raised 6°/min. Meanwhile the glass tube, heavily loaded with butter fat, is removed from the vaporizer block for cleaning. A clean tube is inserted and conditioned for the next run.
We used a hexane extract with 100 mg fat per ml from an "insecticide free" alp butter (chromatogram B) . The majority of the peaks, especially a,b,c, are not due to vaporized butter material but to septum bleed. A and C show chromatograms from the same extract with added insecticides whereby C is run with double sample size and half attenuation.
Table I shows the influence of the evaporation con-ditions (temperature and duration) on the peak height
for dieldrin obtained with a butter extract containing
40 ng of dieldrin per ml. It is seen that under our selected conditions, 210° and 60 sec, the insecticide is
almost fully evaporated. Further increases of both
temperature and duration are undesirable because they would increase septum bleed and contamination of the column by fatty material. Under these conditions dis-persion of the results was -t 3% mainly due to
fluctua-tions of the sample size. Injecfluctua-tions were made with
"solvent flushing" (10).
To judge the recovery of insecticides from butter fat we added equal amounts of dieldrin to butter extract and to pure hexane respectively. In repeated runs
using several independent "insecticide free" extracts
as well as different solvents for the pure solution we obtained 10-15% higher dieldrin figures from butter extracts, i.e. the contrary of what we had expected.
The minimum detectable dieldrin concentration was in the order of 1 ng/ml. We believe that using a vapor-izer design with reduction of septum bleed we shall be able to detect substantially lower concentrations.
Applications with Gaseous Sampling
Aroma head space from cognac
The specific problem of this kind of analysis is the following: traces of aromatic substances are to be esti-mated in a gas mixture in which water and ethanol are by far predominant.
In the case of concentration by freezing the limita-tion of the sample size is the main difficulty. With our procedure of splitless injection larger samples can be
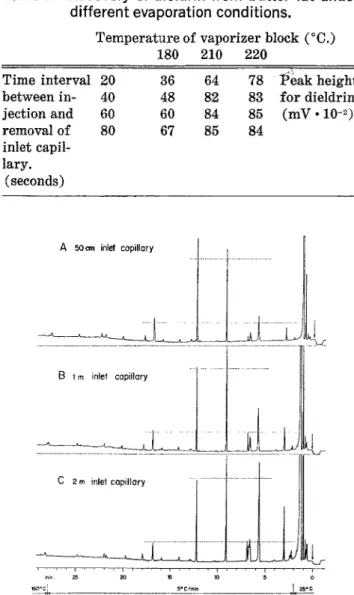
Table I. Recovery of dieldrin from butter fat under different evaporation conditions.
Temperature of vaporizer block (°C.)
180 210 220
Time interval 20 36 64 78 Peak height between in- 40 48 82 83 for dieldrin jection and 60 60 84 85 (mV • 10-2) removal of 80 67 85 84 inlet capil-lary. (seconds) A 50cm inlet copillory ^o•ci scimm j nrc
Figure 2. Cognac aroma head space. 4 mi of head space gas
introduced into inlet capillaries of different Iength. Glass capillary, 25 m/0.35 mm, Emulphor 0 alkaline. Carrier Hydro-gen, 0.3 atmos. (2.5 mi/min). App.: Carlo Erba, Mod. GI, FID.
handled. However, a very broad ethanol peak is ob-tained which tends to trouble the earlier part of the chromatogram. With solvent bypassing using a non-polar inlet capillary the bulk of water and ethanol can be vented. In this case, instead of being covered by the
ethanol peak, the same substances suffer a loss, the
extent of which is a function of their volatility.
Our sampling procedure was the following: the cylindric 250 ml flask containing 100 ml of cognac and covered with aluminum foil was held at room temperature (22°); a separate inlet capilIary was in-serted through the foil down to a distance of a few mm over the liquid; and the opposite end was connected to the water pump via a flow restrictor yielding a flow of 2 ml/min through the capillary. We used this ex-ample to study two main sampling variables.
1. Influence of length of inlet capillary: The results are shown by Figure 2. Since the sample size was
10. Kruppa, R. F., GC-Newsletters, Applied Science, Jan,
1969.
constant (4 ml, corresponding to 2 min of suction) we expected identical chromatograms for the less volatile substances. We observed, however, a slight reduction of peak heights with increasing length of inlet capillary. The effect is best demonstrated by the peaks eluted at 13 and 17 minutes respectively. The reduction is repro-ducible and affects all substances in the second half of the chromatograms. At present we have no satis-factory explanation for it.
The earlier substances, being partially vented, show the expected increase with increased inlet length. The heights of the peaks at 3 and 6 min respectively, are almost proportional to the inlet length. For these sub-stances we were prepared to obtain, from the long inlet, broadened or distorted peaks because of the distribu-tion of the respective substances over a capillary length corresponding to almost 10 seconds of carrier flow. This phenomenon was not detectable.
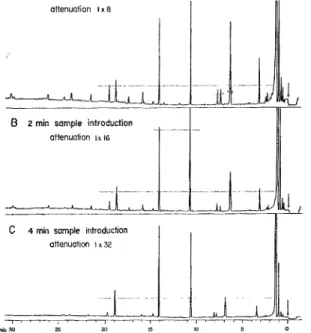
2. Influence of sample size: Sample volumes of 2, 4, and 8 ml as obtained by suction during 1, 2, and 4 min were introduced into the same inlet capillary of 1 m length. Since the variation of sample size was com-pensated by proportionally varied attenuation, identical chromatograms were to be expected with differences only for the more volatile substances that are increas-ingly vented by prolonged gas flow. We in fact observed the corresponding reductions in the first part of the chromatograms shown in Figure 3. After some nearly constant peak heights in the central region (e.g. peaks at 14 and 19 min in Figure 3.) , however, sharp decreas-es followed for which, again, we ignore the exact reason. Loss of peak height because of peak broadening is to be excluded since this effect would have primarily affected the earlier peaks. A saturation effect as it is linked with frontai analysis is excluded as well. We have some evidente that the Tosses are caused by dis-placement under the influence of the water and ethanol stream.
The inner surface of the glass capillary columns used had been modified by a series of purely inorganic treatments. This modification is very laborous and hard to reproduce. Its description would, therefore, be premature. The liquid phase (except for the inlet capillary) was Emulphor 0 with very slight alkaline reaction.
Auto exhaust gas
It seems to us that up to present the gasoline consti-tuents being present in auto exhaust gases have been investigated (11-14) with different methods and quite separately from the organic exhaust components formed only in the hot motor (15,16). This caused us to try analyze simultaneously both groups of exhaust com-ponents.
Exhaust gases are saturated with water vapor. Therefore, the gas temperature must be equal or lower than that of the inlet capillary. Formation — and migration--of droplets is observed in a capillary cooled approx. 5' below the temperature of the gas sample.
Sampling was done very simply by quickly filling a 2 1 roitnd flask without markedly warming the glass waals. The flask was covered with aluminum foil through which the inlet capillary was introduced. As we were afraid of secondary reactions in the gas sample
t min sample introduction
Figure 3. Cognac aroma head space. Different volumes of head space gas introduced into 1 m inlet capillary. Chromato-graphic conditions as for Figure 2. Atten. proportional to
sample size.
we wished to reduce the time between sampling and introducing the capillary to a minimum. We obtained, however, similar chromatograms regardless of whether this time was 30 seconds or 3 hours.
To enhance bypassing of water vapor the inlet capillaries were coated with silicone oil SF 96. The main column was of the same type as that mentioned in the preceding section. The liquid phase was Emul-phor 0 adjusted to slightly acidic reaction as needed because of the presente of phenols. For comparison purposes we used a second column coated with silicone oil SF 96. Identifications as listed in Table II are to be considered as tentative. They were done by adding pure substances to the sample and comparing the effects on both columns.
Chromatograms A and B in Figure 4 show results produced under identical sampling and chromato-graphic conditions from two motors consuming the same fuel. The gas samples were taken from the motor at low speed a few seconds after the cars had arrived from the same 5 mile drive. Chromatogram C, again
11. MeEven, D. J., Anal. Chem. 38, 1047 (1966). 12. Jacobs, E. S., Anal. Chem. 38,43 (1966).
13. Seizinger, D. E., Instr. News, The Perkin-Elmer Co. 18,11 (1967).
14. Maynard, J. B., and Sanders, W. N., J. of the Air Pollution Control Assoc. 19, 505 (1969).
15. Barber, E. D., Sawicki, E., and McPherson, S. P., Anal. Chem. 36, 2442 (1964).
16. Reckner, L. R., Scott, W. E., and Biller, W. F., Proc, 30th Meeting American Petroleum Inst. Division Re-fining, Montreal, 1965.
Table I I. Substances identified in auto exhaust gas.
1 Benzene 13 1,2,3-2 Toluene Trimethylbenzene 3 Ethylbenzene 14 Indane 4 p-Xylene 15 1,2,4,5-5 m-Xylene Tetramethylbenzene 6 o-Xylene 16 Indene 7 1-Methyl-3- 17 Acetophenon ethylbenzene 18 Naphthalene 8 Styrene 19 2-Methylnaphthalene 9 1,3,5- 20 1-Methylnaphthalene Trimethylbenzene 21 Diphenyl 10 1-Methyl-4- 22 Phenol ethylbenzene 23 o-Cresol 11 1-Methyl-2- 24 1,6-ethylbenzene Dimethylnaphthalene 12 1,2,4- 25 p-Cresol Trimethylbenzene 26 m-CresolA Auto Eahoust Gas
MaMr a Co~ wo/O3Or ..em to O
B Auto Eotmut Gas
Motor b
C Heudspoce Gas
from Gasoline
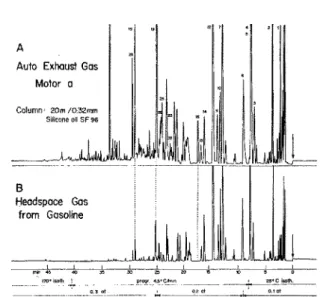
Figure 4. A and B: 2 ml of auto exhaust gas; C: 2 ml of gaso-line head space gas. Glass capillary, 50 m/0.35 mm, Emulphor acidic. Carrier hydrogen, .6 atmos. (2.5 ml/min). App.: Carlo
Erba, Mod. GI, FID, Atten. 1 x 16.
produced under the same chromatographic conditions, has been added to visualize the fundamental differente between fuel and exhaust vapors. It is seen that there is little difficulty to resolve both groups of exhaust components, those deriving from the fuel and those formed by cracking and partial oxidation, in the same run. The first significant member of the Jatter group is
indene (peak 16) that is not present in gasoline.
Whereas the naphthalenes are, in different concentra-tions, present in both fuel and exhaust the phenols clearly are not. The large peak reproducibly given off only by motor b and eluted at 48 min behaves chroma-tographically like a polycyclic aromatic hydrocarbon. Acenaphthene, acenaphthylene, and fluorene are eluted in this section but do not coincide with the mentioned
peak.
The polar nature of the cracking and combustion products is clearly demonstrated by the comparison between chromatograms B/C in Figure 4 with A/B in Figure 5. Whereas from the polar columns they emerge well after the fuel substances, both groups remain mixed on the nonpolar column.
Conciusions
From the presented trace analytical applications we deduce the supposition that many actual analytical problems could be solved by similar methods using capillary columns. We again wish to emphasize, how-ever, that, not knowing the special needs and difficul-ties in the individual working fields, we are not able to judge the actual applicability of our methods.
We are presently trying to modify for our columns Janak's (7) frontal analysis method with the aim of further increasing the concentration of trace substances from liquid as well as from gaseous mixtures.
Auto Exhaust Gas Motor a Column 20. /0:32mm Siiiconeoil SF 96 1 1 t 8 Headspace Gas trom Gasoline 1 _1 1 J_
m. uuu pas', 5'CA , x
s w
n•C iuM.
o.^ot ^^o, e.,m
Figure 5. A: 2 ml of auto exhaust gas; B: 2 ml of gasoline
head space gas. Glass capillary, 20 m/0.32 mm, silicone oil
SF 96. Carrier hydrogen, .3 atmos. (2.0 ml/min). App.: Carlo
Erba, Mod. GI, FID, Atten. 1 x 8.
Acknowledgment
The special material for insecticide analysis was kindly supplied to us by Mr. Gay of the Official Chemical Laboratory of the City of Zurich.
We gratefully acknowledge the support by F. J. Burrus & Cie., Boncourt, who generously sponsored
this work. n
Manuscript received August 24, 1970
Presented at the Sixth International Symposium on Advances
in Chromatography held in Miami Beach, Florida, June 2-5, 1970.