Prospective study of 310 patients: can early CT
predict the severity of acute pancreatitis?
A.-S. Knoepfli,
1K. Kinkel,
2T. Berney,
3P. Morel,
3C. D. Becker,
1P.-A. Poletti
1 1Department of Radiology, Geneva University Hospital, Geneva, Switzerland
2
Institut de Radiologie, Clinique des Grangettes, 7, chemin des Grangettes, 1224 Cheˆne-Bougeries, Geneva, Switzerland
3
Department of Surgery, Clinic of Visceral and Transplantation Surgery, Geneva University Hospital, Geneva, Switzerland
Abstract
Background: This study was designed to determine the most important early CT parameters predictive of acute pancreatitis severity.
Methods: Three hundred and seventy-one consecutive patients with acute abdominal pain and hyperamylas-emia were enrolled. Three hundred and ten of the 371 patients met our inclusion criteria. Acute pancreatitis severity was evaluated using the 1992 Atlanta criteria. Different CT parameters were reported from the admis-sion abdominal CT by two radiologists blinded from any clinical parameter, but the patientsÕ age and gender. These variables were fitted in a binary logistic regression model.
Results:Acute pancreatitis was mild in 80% cases, severe in 20% cases and lethal in 12.69% cases. The following CT parameters were significantly associated with the severity of acute pancreatitis: the objective size of the pancreas (P = 0.001), the peripancreatic fat abnormal-ities (P = 0.001) and the extent of necrosis (P = 0.007). Moreover, the age of the patient revealed itself a highly significant (P = 0.001) indicator of disease severity. The association of the four CT criteria eventually showed a sensitivity of 73% and a specificity of 81% to predict acute pancreatitis severity.
Conclusion: Although these criteria correlated with disease severity, our study identified that morphological CT criteria cannot be used to triage patients with severe and mild acute pancreatitis.
Key words: Predictive CT criteria—Acute pancreatitis outcome
Acute pancreatitis remains a disease of unpredictable outcome, often fatal. The mortality ranges between 10% and 15%, but can reach up to 95% in a subpopulation of severe acute pancreatitis. Its mortality has remained un-changed for the last two decades in spite of progress in understanding the underlying pathological mechanisms. The increasing incidence of acute pancreatitis varying between 5 and 80/1,000,000 inhabitants [1, 2] has pushed both academicians and practitioners to under-stand its natural course. According to criteria defined by an International consensus meeting in Atlanta in 1992 [3], 20% of acute pancreatitis is considered severe (Table1). The Atlanta system is a clinically based classi-fication that attempted to create an international basis of definitions on acute pancreatitis. It was by no means established to predict the severity of acute pancreatitis. In-deed predicting the severity of acute pancreatitis remains a cornerstone, as no simple and effective diagnostic tool is available yet. None of the present criteria allows to predict the severity of acute pancreatitis with sufficient accuracy (clinical Ranson, Acute Physiology and Chronic Health Evaluation—APACHE II, modified Glasgow and Baltha-zar radiological scores) [4–6]. In addition, no specific man-agement and therapeutical approach have emerged. Acute pancreatitis, a complex and relatively frequent disease, re-mains a poorly defined clinical identity with various clinical presentations and outcomes. Using the Atlanta severity criteria as a gold standard, the aims of our study were: 1. To identify significant demographic and CT criteria
that correlate with disease severity in our patient population.
2. To establish an algorithm which best predicts severity of acute pancreatitis using significant criteria of our analysis.
3. To assess the sensitivity and specificity of the estab-lished BalthazarÕs CT severity index (CTSI) [7], to differentiate severe from mild acute pancreatitis, in our study population.
Correspondence to: A.-S. Knoepfli; email: anne-sophie.knoepfli@ hcuge.ch
Materials and methods
Patients
We performed a prospective study in which all patients with a suspicion of acute pancreatitis underwent an early CT within 48 h of admission. We also evaluated the Balthazar radiological score on our study population. This score is based on the combined assessment of pan-creatic abnormalities and the degree of panpan-creatic necrosis. The current study was held from 20/11/1995 through 31/12/2000 in a University Hospital. Inclusion criteria were patients presenting acute abdominal pain and hyperamylasemia (>235 UI/L and from 30/11/ 1999 > 128 UI/L due to a change in the method of dosage) at the Emergency Care Unit. Patients who had been transferred from another hospital, patients read-mitted or previously enrolled in the study, patients with chronic pancreatitis and other diagnoses than acute pancreatitis at discharge were excluded. Five hundred and seventy-nine patients met our inclusion criteria. The protocol was approved by the institutional review boards of our hospital.
Study protocol
The protocol initiated upon admission consisted of a prospective collection of historical, clinical, laboratory and radiological data. These data allowed to define ret-rospectively the severity of the acute pancreatitis according to the 1992 Atlanta criteria (Table1), excluding the early CT data, subject of this study. Among the 579 patients likely to enter this study, 371 accepted study participation. Three hundred and ten of them underwent contrast-enhanced CT examination within 48 h of admission and were therefore considered as the study population. Sixty-one patients were excluded due to delayed CT (n = 18), CT not found in the records (n = 18), CT not completed (n = 14), absent iodinated iv contrast injection (n = 9), pancreas not analysed (n = 1), partial remaining pancreas due to
pancreatico-duodenectomy (n = 1). Abdominal CT consisted in a series of unenhanced images, followed by an intravenous injection of 120 mL of contrast material containing 240 mL of iodine per mL at a rate of 3 mL/s. A first spiral with a slice thickness of 5 mm began 25 s after injection of contrast material for the arterial phase imaging and at 60 s for the portal phase imaging. CT examinations were performed using a single-slice helical CT (PQ 5000, Marconi Medical System or CT/I Hi Speed, General Electric Medical System). CT predictors derived from the Balthazar radiological score or deemed to be potentially relevant as to assess the severity of acute pancreatitis were collected (Table2). The objective pan-creatic size was defined by the sum of the maximal anterior–posterior dimension in mm at the head, body and tail of the pancreas (Fig.1). In addition, the extent of necrosis was defined by the non-enhancement involving less than 30%, 30%, 50% or more than 75% of the gland. All CTs were interpreted by two radiologists unaware of the disease outcome and therefore, of the severity of the acute pancreatitis, except for the patientÕs age and sex.
Data analysis
Patients were classified into mild and severe acute pan-creatitis according to the 1992 Atlanta criteria (Table1) [3].
Statistical analysis
Fourteen key variables collected among the 310 obser-vations (patients) were analysed. The outcome corre-sponded to the binary response variable (severe vs. mild) to assess acute pancreatitis severity. The 13 potential predictor variables (11 of them were categorical variables and two were continuous variables) were analysed with regression analysis for the question of disease severity. Significant criteria were then combined in an optimal algorithm that allowed the best correlation with acute
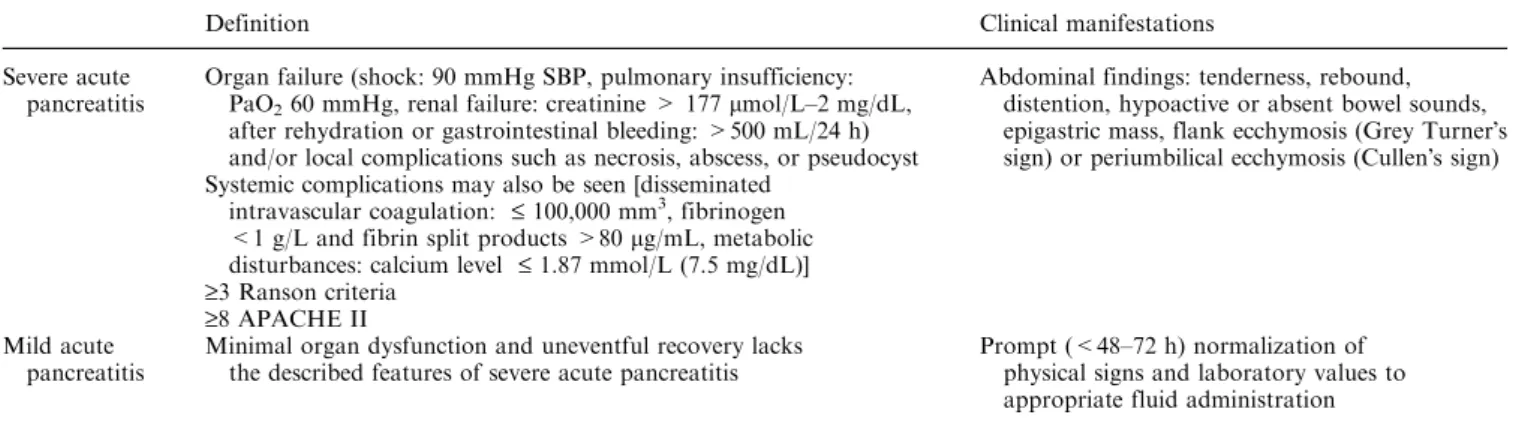
Table 1. Clinically based acute pancreatitis classification system international symposium on acute pancreatitis, Atlanta
Definition Clinical manifestations
Severe acute pancreatitis
Organ failure (shock: 90 mmHg SBP, pulmonary insufficiency: PaO260 mmHg, renal failure: creatinine > 177 lmol/L–2 mg/dL,
after rehydration or gastrointestinal bleeding: >500 mL/24 h) and/or local complications such as necrosis, abscess, or pseudocyst
Abdominal findings: tenderness, rebound, distention, hypoactive or absent bowel sounds, epigastric mass, flank ecchymosis (Grey TurnerÕs sign) or periumbilical ecchymosis (CullenÕs sign) Systemic complications may also be seen [disseminated
intravascular coagulation: £ 100,000 mm3
, fibrinogen <1 g/L and fibrin split products >80 lg/mL, metabolic disturbances: calcium level £ 1.87 mmol/L (7.5 mg/dL)] ‡3 Ranson criteria
‡8 APACHE II Mild acute
pancreatitis
Minimal organ dysfunction and uneventful recovery lacks the described features of severe acute pancreatitis
Prompt (<48–72 h) normalization of physical signs and laboratory values to appropriate fluid administration
pancreatitis severity in our patient population. Various number of points were attributed according to age, objective pancreatic size correlated to the importance of peripancreatic fat abnormalities (with an increasing number of points for increased pancreatic size based on the degree of peripancreatic fat abnormality), presence of necrosis and its extent. The severity of acute pancreatitis was scored on a logarithmic scale from 0.1 to 0.99, de-rived form the total amount of points obtained. Sensi-tivity, specificity, accuracy, positive predictive value and negative predictive value were calculated at different cutoffs used to define mild from severe acute pancreatitis (Table3). For all comparisons, the variables were con-sidered at the conventional 5% significance level. More-over, the validation and calibration of the final model used a bootstrap technique which showed that there was no significant overfitting and that the fitted model was accurate.
We also assessed BalthazarÕs CTSI score in our pa-tient population.
Results
There were 42% (130/310) women and 58% (180/310) men, aged 18–93 years, with a mean age of 55.6 years. The aetiology of acute pancreatitis was biliary tract re-lated in 48.7% (151/310), alcohol rere-lated in 31.6% (98/ 310) and miscellaneous in 19.7% (61/310) of patients. According to the 1992 Atlanta criteria, 80% (247/310) of the patients suffered from mild acute pancreatitis and 20% (63/310) from a severe one. The mortality was 12.7% (8/310), none of them in the mild group. Non-significant CT predictors were the subjective enlargement of the gland, the number and the extent of fluid collections, the anatomical site of necrosis, free fluid and venous throm-bosis. Significant CT predictors were the objective size of the pancreas (P = 0.001), abnormalities of the peripan-creatitic fat (P = 0.001), the relationship between size and peripancreatic fat abnormalities (P = 0.017) and the extent of necrosis (P = 0.007). The severity of acute pancreatitis correlated to the increasing objective pan-creatic size and peripanpan-creatic fat abnormalities. In pa-tients with normal peripancreatic fat, the objective pancreatic size correlated inversely to the severity. In patients with abnormal peripancreatic fat, the objective peripancreatic size correlated positively with severity. Moreover, the age of the patient was a highly significant (P = 0.001) indicator of disease severity.
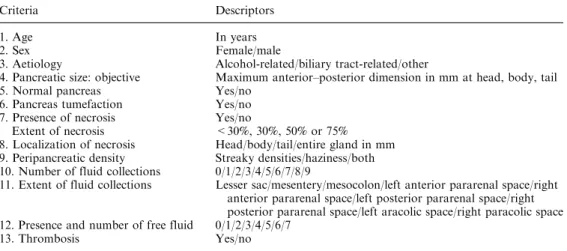
Table 2. List of 13 potential predictor variables
Criteria Descriptors
1. Age In years
2. Sex Female/male
3. Aetiology Alcohol-related/biliary tract-related/other
4. Pancreatic size: objective Maximum anterior–posterior dimension in mm at head, body, tail 5. Normal pancreas Yes/no
6. Pancreas tumefaction Yes/no 7. Presence of necrosis Yes/no
Extent of necrosis <30%, 30%, 50% or 75% 8. Localization of necrosis Head/body/tail/entire gland in mm 9. Peripancreatic density Streaky densities/haziness/both 10. Number of fluid collections 0/1/2/3/4/5/6/7/8/9
11. Extent of fluid collections Lesser sac/mesentery/mesocolon/left anterior pararenal space/right anterior pararenal space/left posterior pararenal space/right posterior pararenal space/left aracolic space/right paracolic space 12. Presence and number of free fluid 0/1/2/3/4/5/6/7
13. Thrombosis Yes/no
Fig. 1. Abdominal CT reconstruction showing the maximal anterior–posterior dimension in mm at the head, neck and tail of the pancreas.
Table 3. 48 h CT score
48 h CT score Sensitivity Specificity Accuracy PPV NPV
0.6 35 98 85 81 86 0.52 48 95 85 71 88 0.43 51 93 84 65 88 0.31 63 87 82 56 90 0.22 73 81 80 49 92 0.1 95 59 67 37 98
Severity of acute pancreatitis scored on a logarithmic scale from 0.1 to 0.99 based on our study population: 0.22 being the optimal cutoff
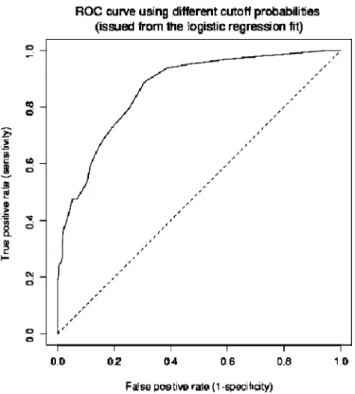
The significant criteria (age, objective pancreatic size according to peripancreatic fat abnormalities and pres-ence of necrosis and its extent) were then combined in the best achievable algorithm. The sensitivity, specificity, accuracy, positive predictive value and negative predic-tive value obtained from our 48 h CT scoring system were then calculated at different cutoffs used to define mild from severe acute pancreatitis and reported in Ta-ble3. The optimal cutoff point of 0.22 between sensi-tivity and specificity, 73% and 81%, respectively, is seen on a ROC curve (Fig.2).
To allow a comparison between our 48 h CT score and the CTSI severity index, mild and severe acute pancreatitis were defined at different cutoff points for the CTSI severity index (0–3/0–6 for mild acute pancreatitis, 4–10/7–10 for severe acute pancreatitis). This led to an optimal cutoff point between sensitivity and specificity at a threshold of 0–3/4–10 (Table4).
Discussion
The results of our investigation indicate that four pre-dictors correlate with disease severity of acute pancrea-titis. These parameters include the patientÕs age, the objective size of the pancreas, peripancreatic fat abnor-malities and pancreatic necrosis.
Our study confirmed prior results that age proved relevant to determine the severity of acute pancreatitis [8–12].
The objective but not the subjective size of the pan-creas measured at CT correlated with a severe outcome
in this study. In 1991, London et al. [13] found that a pancreatic index greater than 10 cm2 had a 83% sensi-tivity and 65% specificity to predict a severe outcome in acute pancreatitis. The pancreatic size index was calcu-lated by multiplying the maximum antero-posterior measurement of the head by the maximum antero-pos-terior measurement of the pancreatic body in cm2. Pan-creatic enlargement is part of the CTSI score but is left to subjective assessment. The CTSI score combines pan-creatic inflammation (including subjective enlargement of the pancreas) and pancreatic necrosis. Further studies are necessary to establish normal values of pancreatic size according to age.
Interestingly our study showed that the disease severity due to objective pancreatic enlargement rose with increasing peripancreatic fat abnormalities. This relationship may demonstrate a positive correlation be-tween pancreatic oedema and peripancreatic fat inflam-matory reaction possibly due to enzyme leakage.
Our study confirmed the importance of pancreatic necrosis in determining disease severity as previously reported [4,13–18]. Indeed, the risks of acute pancreatitis are most of all infectious complications that are directly linked to the presence of necrosis, a favourable envi-ronment to the development of bacteria [3,7,19–28]. The overall risk of infection does not exceed 10%, but in case of necrosis, it reaches 70%.
Currently, CT is the only reliable non-invasive tech-nique to diagnose necrosis. Our study substantiates the previously reported observations that the extent of necrosis, defined as the percentage of unenhanced pan-creatic tissue, is an essential predictor of severity. Indeed, the diagnosis of an acute necrotizing pancreatitis could lead to prophylactic antibiotic treatment.
However, the absence of necrosis is not reliable en-ough to exclude severity. Balthazar demonstrated in 2002, a correlation between the CT severity index, mortality and local and/or systemic complications [23]. The CTSI severity index seems appropriate in the management of patient with low (0–2) to high (7–10) scores. Indeed no mortality was reported in low CTSI scores whereas a 17% mortality was associated with high scores. However, the usefulness appears question-able for clinical management of patients with an inter-mediate score (3–6) that is associated with a 6% mortality rate. Indeed in our patient population, even with an optimized cutoff point, the sensitivity does not exceed 80% with a specificity of 55% (Table4). Applying our algorithm, that has been optimized and designed in our patient population, we do hardly better with a 95% sensitivity, 59% specificity and a 37% po-sitive predictive value. This means that 63% of patients with a predicted severe disease will undergo unnecessary increased surveillance. These results would probably be worse if applied prospectively in an independent study population.
Fig. 2. ROC curve using different cutoff probabilities (issued from the logistic regression fit).
The current data suggest that CT morphological cri-teria are of limited value to help clinicians to predict severity of acute pancreatitis. We believe that further studies should aim to determine the role of functional imaging (i.e., perfusion CT) to predict severity and out-come of acute pancreatitis.
Conclusion
Although objective pancreatic size, peripancreatic fat abnormalities and necrosis correlated with disease severity, our study identified that morphological CT criteria cannot be used to triage patients with severe and mild acute pancreatitis.
Acknowledgement. S. Demuylder
References
1. Neoptolemos JP, et al. (2000) Early prediction of severity in acute pancreatitis by urinary trypsinogen activation peptide: a multicen-tre study. Lancet 355(9219):1955–1960
2. Kylanpaa-Back ML, Kemppainen E, Puolakkainen P (2002) Trypsin-based laboratory methods and carboxypeptidase activa-tion peptide in acute pancreatitis. Jop 3(2):34–48
3. Bradley EL III (1993) A clinically based classification system for acute pancreatitis. Summary of the International Symposium on Acute Pancreatitis, Atlanta, GA, September 11 through 13. Arch Surg 128(5):586–590
4. Balthazar EJ (2002) Acute pancreatitis: assessment of severity with clinical and CT evaluation. Radiology 223(3):603–613
5. Anglade D, et al. (2000) Is it useful to maintain specific scores for the early determination of the severity of acute pancreatitis? Ann Chir 125(4):325–333
6. Wilson C, Heath DI, Imrie CW (1990) Prediction of outcome in acute pancreatitis: a comparative study of APACHE II, clinical assessment and multiple factor scoring systems. Br J Surg 77(11):1260–1264
7. Balthazar EJ, et al. (1990) Acute pancreatitis: value of CT in establishing prognosis. Radiology 174(2):331–336
8. Ranson JH, et al. (1974) Prognostic signs and the role of operative management in acute pancreatitis. Surg Gynecol Obstet 139(1):69– 81
9. Blamey SL, et al. (1984) Prognostic factors in acute pancreatitis. Gut 25(12):1340–1346
10. Pezzilli R, Billi P, Morselli-Labate AM (1998) Severity of acute pancreatitis: relationship with etiology, sex and age. Hepatogast-roenterology 45(23):1859–1864
11. Halonen KI, et al. (2000) Severe acute pancreatitis: prognostic factors in 270 consecutive patients. Pancreas 21(3):266–271 12. Company L, et al. (2003) Factors predicting mortality in severe
acute pancreatitis. Pancreatology 3(2):144–148
13. London NJ, et al. (1991) Rapid-bolus contrast-enhanced dynamic computed tomography in acute pancreatitis: a prospective study. Br J Surg 78(12):1452–1456
14. Clavien PA, et al. (1988) Value of contrast-enhanced computerized tomography in the early diagnosis and prognosis of acute pancrea-titis. A prospective study of 202 patients. Am J Surg 155(3):457–466 15. Vesentini S, et al. (1993) Prospective comparison of C-reactive protein level, Ranson score and contrast-enhanced computed tomography in the prediction of septic complications of acute pancreatitis. Br J Surg 80(6):755–757
16. Lankisch PG, et al. (2002) The APACHE II score is unreliable to diagnose necrotizing pancreatitis on admission to hospital. Pan-creas 24(3):217–222
17. Balthazar EJ, Freeny PC, van Sonnenberg E (1994) Imaging and intervention in acute pancreatitis. Radiology 193(2):297–306 18. Hill MC, et al. (1982) Acute pancreatitis: clinical vs. CT findings.
Am J Roentgenol 139(2):263–269
19. Kemppainen E, et al. (1996) Early localization of necrosis by contrast-enhanced computed tomography can predict outcome in severe acute pancreatitis. Br J Surg 83(7):924–929
20. Ranson JH, et al. (1985) Computed tomography and the prediction of pancreatic abscess in acute pancreatitis. Ann Surg 201(5):656–665 21. Paulson EK, et al. (1999) Acute pancreatitis complicated by gland necrosis: spectrum of findings on contrast-enhanced CT. Am J Roentgenol 172(3):609–613
22. Baron TH, Morgan DE (1999) Acute necrotizing pancreatitis. N Engl J Med 340(18):1412–1417
23. Balthazar EJ (2002) Staging of acute pancreatitis. Radiol Clin North Am 40(6):1199–1209
24. Lankisch PG, et al. (2001) Do we need a computed tomography examination in all patients with acute pancreatitis within 72 h after admission to hospital for the detection of pancreatic necrosis? Scand J Gastroenterol 36(4):432–436
25. Block S, et al. (1986) Identification of pancreas necrosis in severe acute pancreatitis: imaging procedures versus clinical staging. Gut 27(9):1035–1042
26. Rau B, et al. (1997) Surgical treatment of infected necrosis. World J Surg 21(2):155–161
27. Beger HG, et al. (1997) Natural course of acute pancreatitis. World J Surg 21(2):130–135
28. Schmid SW, et al. (1999) The role of infection in acute pancreatitis. Gut 45(2):311–316
Table 4. CT severity index (CTSI) applied to our study population
Balthazar 1990 score Sensitivity (%) Specificity (%) Accuracy (%) PPV (%) NPV (%)
0–3/4–10 79.6 55 60 41 87.5
0–6/7–10 98.7 9.5 27 66.6 81