American Journal of Plant Sciences, 2014, 5, 2354-2371
Published Online July 2014 in SciRes. http://www.scirp.org/journal/ajps http://dx.doi.org/10.4236/ajps.2014.515249
How to cite this paper: Siegenthaler, A., et al. (2014) Discrepancies in Growth Measurement Methods of Mosses: An Ex-ample from Two Keystone Species Grown under Increased CO2 and N Supply in a Restored Peatland. American Journal of Plant Sciences, 5, 2354-2371. http://dx.doi.org/10.4236/ajps.2014.515249
Discrepancies in Growth Measurement
Methods of Mosses: An Example from Two
Keystone Species Grown under Increased
CO
2
and N Supply in a Restored Peatland
Andy Siegenthaler1,2*, Alexandre Buttler1,2, Philippe Grosvernier3, Jean-Michel Gobat4,
Edward Mitchell1,2,5
1Swiss Federal Research Institute WSL, Lausanne, Switzerland
2École Polytechnique Fédérale de Lausanne (EPFL), Lausanne, Switzerland 3LIN’eco, Reconvilier, Switzerland
4Laboratory Soil & Vegetation, University of Neuchâtel, Neuchâtel, Switzerland 5Laboratory of Soil Biology, University of Neuchâtel, Neuchâtel, Switzerland Email: *[email protected]
Received 13 May 2014; revised 15 June 2014; accepted 4 July 2014 Copyright © 2014 by authors and Scientific Research Publishing Inc.
This work is licensed under the Creative Commons Attribution International License (CC BY). http://creativecommons.org/licenses/by/4.0/
Abstract
Bryophytes dominate northern peatlands. Obtaining reliable measurements of moss-growth and how it may be affected by global changes are therefore important. Several methods have been used to measure moss-growth but it is unclear how comparable they are in different conditions and this uncertainty undermines comparisons among studies. In a field experiment we measured the growth and production of Sphagnum fallax (Sphagnum) and Polytrichum strictum (Polytrichum) using two handling methods, using cut and uncut plants, and three growth-variables, height- growth, length-growth, and mass-growth. We aimed “benchmarking” a combination of six meth-odological options against exactly the same set of factorial experiments: atmospheric CO2
enrich-ment and N addition. The two handling methods produced partly different results: in half of the cases, one method revealed a significant treatment effect but the other one did not: significant negative effects on growth were only observed on uncut plants for elevated CO2 and on cut plants
for N addition. Furthermore, the correspondence between measurements made with various growth-variables depended on the species and, to a lesser extent, treatments. Sphagnum and
Poly-trichum growth was inhibited under elevated CO2, and correlated to higher ammonium values. Sphagnum was however less affected than Polytrichum and the height difference between the two
species decreased. N addition reduced the P/N ratio and probably induced P-limiting conditions. *
Sphagnum growth was more inhibited than Polytrichum and the height difference between the two
species increased. Our data show that such a problem indeed exists between the cut and uncut handling methods. Not only do the results differ in absolute terms by as much as 82% but also do their comparisons and interpretations depend on the handling method—and thus the interpreta-tion would be biased—in half of the cases. These results call for cauinterpreta-tion when comparing factorial studies based on different handling methods.
Keywords
Mosses, Growth-Measurement Methods, Elevated CO2 and N Deposition, Polytrichum, Sphagnum,
Peatland Restoration, Nutrient Availability
1. Introduction
Bryophytes play an important functional role in both natural and regenerating cutover peatlands of the temperate and boreal zones of the Northern Hemisphere. Growing peatlands represent a globally significant long-term carbon sink and Sphagnum bogs are an important component of these peatlands [1] [2]. However, large areas of these bogs have been exploited and are now either destroyed or gradually regenerating. The natural regeneration of cutover bogs is a typical example of facilitation where a keystone species, in the Jura Mountains usually ei-ther Polytrichum spp. or Eriophorum spp., creates favourable microclimatic conditions allowing Sphagnum spp. to re-establish more easily [3]. Polytrichum functions as a seed-trap for Sphagnum diaspores [4]. In a later stage,
Sphagnum outcompetes the initial coloniser and the further succession leads to typical Sphagnum bog vegetation
[5].
The sequestration of C in peatlands and the natural regeneration process of cutover bogs, may however, be modified by specific treatments such as atmospheric CO2 enrichment or enhanced N depositions. Indeed, bryo-phytes are amongst the most sensitive plant species to atmospheric pollutants. The absence of a defined root system for major nutrient uptake in terrestrial bryophytes conveys a potential dependence on the atmosphere [6] [7]. Moreover, poikilohydrous species such as mosses reach the saturation level of photosynthesis at a much higher concentration of atmospheric CO2 compared to vascular plants [8].
Given the functional importance of bryophytes in northern peatlands, it is essential to obtain reliable estimates of their growth and productivity to monitor C sequestration. Various studies have investigated Sphagnum growth and how it was affected by enhanced CO2 or N deposition [9]-[20] but much less is known concerning
Poly-trichum [21]-[23]. Comparing these and other (see also Table A1) moss growth data is difficult for two reasons: 1) two main methods were used, either by initially cutting plants or not, and 2) growth was either expressed in terms of height-, length- or mass-growths.
Now, these methods are normally used to measure different ecological responses and therefore have addi-tional value and are often chosen on purpose in most studies. We can expect these different measures not corre-lated 1:1 and comparing them without any idea of their ecological meaning in a large meta-analysis is also therefore not advisable. After making a literature review (see also Table A1) we found that various methods have been used to answer the same research questions. Various methods generated various responses that have been merged in a bigger meta-analysis using averaged conversion factors. One good example of such a merging can be found in [24], where the authors maximized the number of experiments included in their meta-analysis by converting stem growth to production using a generalised relationship between stem growth and production derived from a common subset of glasshouse and field experiments where both variables had been reported. We think that extrapolation of such relationships may be problematic and the aim of our study is to “benchmark” these methods against exactly the same set of treatment experiments.
Reference [25] first introduced the “cut plant” method and Clymo later modified it into the “capitulum correc-tion” method [26], both of which are based on the stem length increment of inserted pre-cut plants. It should be stressed that the cut methods are nowadays not used as often as in the past. The alternative to this method is simply to insert a marker that allows the growth to be measured. This “uncut” method is much simpler, and causes the minimal disturbance. Given the fragility and sensitivity to drought of bryophytes, the fact of cutting
or not the plants may affect their subsequent growth and the two methods may therefore yield different results. Surprisingly, to our best knowledge, no study has attempted to compare these two methods, although Clymo’s methodological review [26] provides hints for a possible bias under certain conditions (e.g. hygrometry).
Our aim was to apply all these growth-measurement methods in parallel to exactly the same set of global change treatments. To do so we need a double approach: 1) investigate how the growth of Sphagnum fallax (Sphagnum) and Polytrichum strictum (Polytrichum) mosses was affected by the cutting and other handling as-sociated with the well used capitulum correction method; and 2) assess the effect of elevated CO2 or enhanced N deposition on various growth-measurements of these two species.
We hypothesised that: 1) Polytrichum would be more affected than Sphagnum by the cutting and handling of the capitulum correction method because cutting Polytrichum would disconnect its internal conducting tissue and reduce its ability to re-translocate nutrients from old parts; 2) elevated CO2 would increase the source-to- sink relation, leading to a “dilution” of nutrients and shift in nutrient limitation [27], and thus favour mass- growth of plants adapted to nutrient-poor conditions such as Sphagnum [28]; and 3) N addition would increase N-nutrient availability and stimulate preferentially the growth of Polytrichum [21].
2. Materials and Methods
2.1. Study Site
The field experiment run from March 27 to November 11, 1997 in an ombrotrophic peatland in the Swiss-Jura Moutains (La Chaux-des-Breuleux, 47˚15'N, 6˚55'E, alt: 1000 m.a.s.l). The mire was drained and the peat was exploited until 1945, and then abandoned. The average daily temperature in the warmest month is 15˚C and −5˚C in the coldest month. The average annual precipitation is 1390 mm and snow covers the site 80 to 120 days yr−1. N deposition is 15 Kg·ha−1·yr−1 [29]. The vegetation is dominated by Eriophorum vaginatum, Carexnigra,
Vaccinium oxycoccus, Sphagnum fallax, Polytrichum strictum, and Aulacomnium palustre. Polytrichum and Sphagnum plants constitute a mosaic assemblage.
2.2. Experimental Setup
Two separated experiments were conducted in two adjacent ca. 400 m2 surfaces (15 m apart): 1) atmospheric CO2 enrichment experiment with treatment as elevated, 560 ppm CO2 (C+) and ambient (AIR), 360 ppm CO2; 2) mineral N addition experiment with treatment as enhanced, 30 Kg N·ha−1·yr−1 (N+) and control as ambient (N0). The first experimental site was equipped with a CO2 gas enrichment device composed of five one meter diame-ter MiniFACE rings (plot-replicates) connected to a gas inlet and compudiame-terised control system [30]. Five other rings (plot-replicates) not connected to the gas inlet represented the control rings. On the second sub-site, min-eral N was regularly applied as an aqueous 107 mM solution of NH4NO3 in six applications per growing season as a fine spray on five one meter-squared plots. Each dose was given in 2 litres of distilled water per plot. Con-trol plots received 2 litres of distilled water per plot. The treatments were randomly assigned to the plots. The two experiments have been carried out throughout the growing season until the bog had its first diurnal frosts (November 11).
2.3. Water Table and Water Chemistry
The water table depth (WTD) below the Sphagnum canopy was measured every second week in the plots’ pie-zometer and the cumulative WTD (CWTD) calculated for each point in time. This was done in parallel with the height-growth measurements described below. The surface porewater of each plot was sampled using soil mois-ture samplers (Rhizon, Eijkelkamp, Holland) placed in peat acrotelm (5 cm depth), and vacuumed bottles (−0.7 bar). The samples were taken just before N addition and were analyzed for DOC (dissolved organic C), pH, total N and P, and major cations and anions following standard protocols [31]. DOC was calculated as total C (meas-ured by NDIR following oxidation) minus inorganic C (meas(meas-ured by NDIR following mineralization by H2PO4). Nitrate was measured with an HPLC by means of separation on an ion exchange column and detection with re-fractive index. Ammonium and sulphate were measured colourimetrically. Total N, chloride, and aluminium were measured using an elemental analyzer. Sodium and potassium were measured by flame emission spectros-copy. Calcium, magnesium, and iron were measured on an atomic absorption spectrosspectros-copy.
2.4. Handling Methods: Cut and Uncut Plants
We performed the same growth-measurements on both, cut and uncut plants taken from the same plots. Firstly, for the cut plant method, a cylindrical moss carpet core was extracted from each plot using a burger cylinder (Ø = 10 cm). Plants were cut at 50 mm below the Sphagnum capitulum carpet and 60 mm below the Polytrichum apex. Twenty plants for each species were randomly taken out of the cylinder’s centre and assembled in a close to natural mosaic pattern around miniature bottlebrush (the hairy part being anchored in the moss carpet, the metallic wire sticking out) with Polytrichum tips extending 10 mm above the Sphagnum capitula, as this corre-sponded to the average height difference between the two species measured in the previous year. The assem-blage was gently tied up in a bundle with a fine visible thread and put back in the cylinder’s centre among the other plants cut at the same height. The whole cylinder was reinserted into the plots. For the uncut plants, we only introduced a bottlebrush in the moss carpet, using a narrow tube to bring the brush into place. The intro-duction of a bottlebrush helps anchoring the wire in the moss carpet and corresponds to a modified version of the cranked-wire method [21] [26]. In the text we will still refer to it as the cranked-wire method.
2.5. Growth-Measurement Variables Three growth-measurements were done in parallel:
1) Height-growth (HG): we determined it for both species five times throughout the growing season by meas-uring the length of the bottlebrush wire emerging above the mosses. The measurements were made on both cut and the uncut plants.
2) Length-growth (LG): at the end of the season, the bundle of cut plants (LG-cut) assembled around the bot-tlebrush was detached from the moss carpet. The plants were then flattened out to determine the final length- growth and subtracting the initial length (50 and 60 mm respectively for Sphagnum and Polytrichum) for each of the 20 plants.
For the uncut plants (LG-uncut), a 7-cm diameter, and 15-cm long core was taken around each bottlebrush. The cores were then cut into slices as follows. The 0 level was defined for both mosses as the top of Sphagnum capitula. i) We first cut the top centimetre of the Sphagnum mosses together with any other plants (0 - 1 cm sec-tions). Since Polytrichum mosses grew taller than Sphagnum, this section represented one centimetre for
Sphagnum, but more (1.1 - 6.6 cm) for Polytrichum. ii) We cut each core 2 cm lower (1 - 3 cm sections).
Indi-vidual plant biomass measurements represent averages over 10 plants for each core. Because the uncut plants were kept intact and without reference mark (thread or clipping), the length-growth of the uncut plants (LG-uncut) was calculated as follows:
[ ]
Length-growth mm =HG SL AL ∗ (1)
where: HG = height-growth measured as described above; SL = average length of 10 stretched moss segments measured at final harvest, and AL = actual length (un-stretched, i.e. either 1-cm or 2-cm).
3) Mass-growth (MG): for cut Sphagnum (MG-cut) plants it was measured using a capitulum correction [26] that was applied to the plants in the cranked-wire bundle. The procedure takes into account the capitulum weight variability and its relation to annual growth. The regression slope between capitulum and stem weights neces-sary to extrapolate the initial capitulum weight was determined on 200 Sphagnum plants of variable sizes sam-pled on the two experimental sites outside the plots. The mass-growth is calculated by subtracting from the final mass of the portion from the tip to clipping the initial mass extrapolated from a 2 cm long stem segment.
[ ]
f iMass-growth g =M −M (2)
where Mf = mass of final portion from the top of the capitulum to the cut; Mi = initial mass calculated from 2 cm stem segment using the regression slope between capitulum and stem weights.
Mass-growth of the uncut Sphagnum (MG-uncut) was calculated by multiplying the total length increment (LG) by the average biomass per unit length (sections 0 - 1 cm and 1 - 3 cm together) of 10 plants.
For both cut and uncut handling methods, we calculated the mass-growth of Polytrichum by multiplying the total length increment (LG) by the average biomass per unit length in the top three centimetres.
We calculated, for both handling methods, the growth difference (∆MG, ∆LG and ∆HG) between the two moss species by subtracting Sphagnum growth from Polytrichum growth, for cut and uncut plants. This was important as we expected the phenology of Polytrichum interacting with the phenology of Sphagnum.
2.6. Numerical Analyses
Distributions, homogeneity and homeoscedacity of residuals were checked using QQ-plots and scatter-plots for all statistical models. Remaining patterns in the residuals were removed by adding interactions among variables. Three ANOVA models have been used:
1) Comparisons of WTD and porewater chemistry variables between treatment sites were analysed with a one-way ANOVA after removal of three outliers based on cook distances.
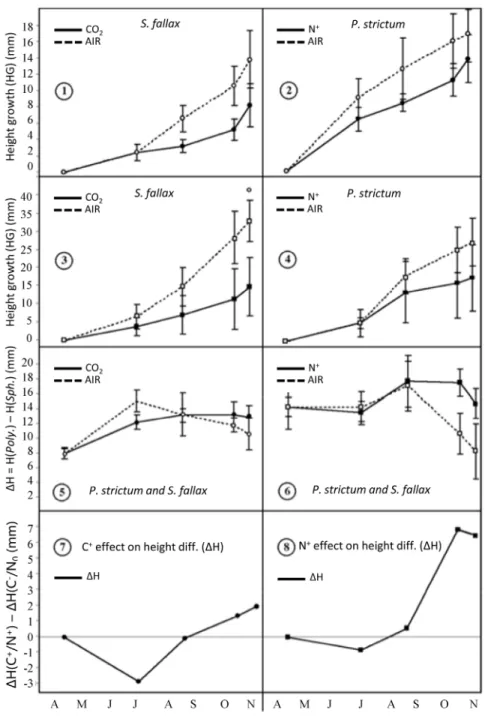
2) HG, ∆HG and growth-rates of the cut plants (Figure 1) were analysed using a two-way (treatment, time, CWTD as covariate, treatment × time) repeated measures analysis of co-variance (RM-ANCOVA, Table 2) with contrast tests for specific points in time.
Figure 1. Height-growth (HG) for both species in function of both treatments and time. The measures were done on cut plants. (1)-(4): height-growth HG, (5) (6): height-difference ∆H between Polytrichum strictum and Sphagnum fallax, (7) (8): ∆H (=∆HG) difference between treatment and control, for example ∆H (CO2) − ∆H (AIR).
3) A two-way analysis of co-variance (ANCOVA) was used for all growth-variables and for HG measured at the time of final harvest (treatment, WTD as covariate). The tests were performed using S-plus 4.5 (Insightful Corporation, Seattle, USA). The results are expressed in least square means to extract the “net” means after cor-recting for unwanted variance attributed to other factors. Because of the limited amount of replicates we could not insert handling, methods, treatments and covariates in the same analysis of variance. Instead we privileged to look at the correlations between the methods after the retrieval of the covariate effects. Additionally, the Cranked wire method enabled to make repeated measurements of the synecological growth of both species, which altogether added a lot of information as well as some complexity to our approach.
Treatment effects mentioned in the text in percent are significant (P ≤ 0.05), unless explicitly described as trends (0.05 ≤ P ≤ 0.1). The different growth-measurement methods were compared using partial pair wise cor-relations (Pearson) after retrieving the variance of the WTD in a principal component analyse (PCA) performed with the JMP/SAS software 8.0 (SAS Institute, Cary, USA).
3. Results
3.1. Water Chemistry
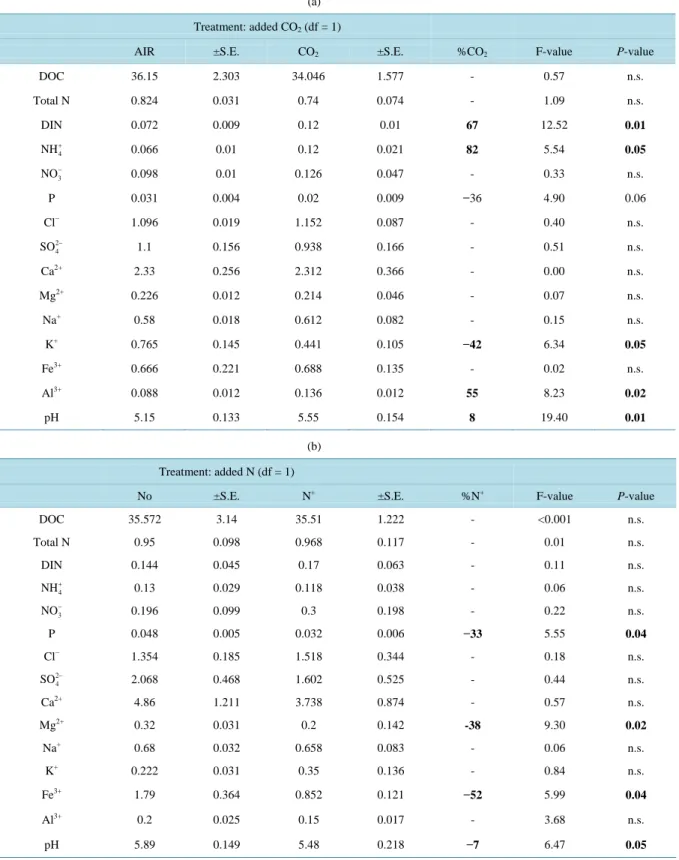
Both elevated CO2 and N addition modified some chemical characteristics of the surface water. Elevated CO2 caused an increase in pH (5.6 vs. 5.2 in the control plots), NH4
+
(+82%), dissolved inorganic nitrogen or DIN (+67%), Al3+ (+55%), and a decrease in K+ (−42%) and P (−36%, trend: P = 0.06) (Table 1(a)). N addition de-creased pH (5.5 versus 5.9), P (−33%), Fe3+ (−52%) and Mg2+ (−38%) (
Table 1(b)). 3.2. Water Table Effect
No significant difference was observed for the median WTD in either of the treatments (on average 273 ± 15 mm). The interactions between treatments and WTD of both experimental sites were not significant and did not improve the distribution patterns in residues and were not included into ANCOVA models. The WTD repre-sented on average 37% of the explained variance for both species over all treatments.
3.3. Moss-Growth as Assessed by the Two Handling Methods
The growth dynamics of uncut plants have already been published by [21] for the same species growing on the same plots and at the same time. In terms of height-growth (HG-uncut) dynamics, the two treatments had con-trasting effects on competition between the initial coloniser Polytrichum, which was favoured by the N addition and the later coloniser Sphagnum, which was favoured by the elevated CO2 treatment.
We focus next on the difference in treatment effects as assessed using the two handling methods. The HG, ∆HG, LG, ∆LG, MG and ∆MG of uncut plants, after having retrieved the WTD effect, are compared with cor-responding data from cut plants to determine to what extent these two methods affected the results (i.e. “bias” in
Table 2).
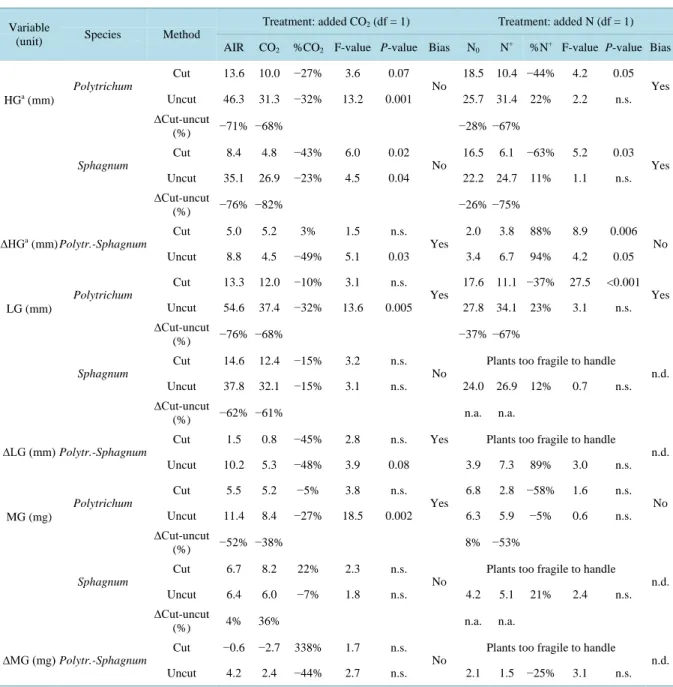
We assessed to what extent cutting plants affected the results by calculating a percentage difference between measurements on cut and uncut plants. Cutting the plants in most cases strongly reduced the measured values for growth and in several cases this causes a bias in the results (Table 2). There were two exceptions with
Sphag-num and Polytrichum (only in the N0 plots) mass-growths, which actually increased due to cutting. The cutting negative effects were always more pronounced in treatment plots as compared to controls plots (one exception for the MG in the CO2 treatment).
For the elevated CO2 treatment, in four of the nine cases (∆HG, Polytrichum LG, ∆LG, and Polytrichum MG) the results differed leading to a “handling bias”, i.e. a significant negative treatment effect was observed for the uncut method but not for the cut method (Figure 2). In three cases no significant treatment effect was observed at all, for Sphagnum HG a significant negative effect was observed using both methods. Finally Polytrichum HG of uncut plants was significantly reduced by 32% and a marginally significantly by 27% difference for cut plants.
In the N addition experiment, in four cases a possible handling bias could not be assessed because as a result of N addition the Sphagnum mosses became too fragile to allow any manipulation. Of the five remaining cases, a bias was found in three cases (HG of both species and Polytrichum LG) with significant negative treatment effect using only the cut plant method. In one case (∆HG) both method revealed a significant positive treatment
Table 1. ANOVA summary table showing surface porewater chemical responses to treatments; values represent means ± S.E. (standard error) and are expressed in mg/L except for pH; the sum of cations and anions is not balanced ionically; N (AIR or CO2 or N+ or N0) = 5; e.g. %CO2 = percent CO2 treatment effect, only shown when the effect is significant; DIN = dissolved inorganic nitrogen; DOC = dissolved organic carbon; for more readability the significant water table factor (WTD) is not in-cluded in this table.
(a) Treatment: added CO2 (df = 1)
AIR ±S.E. CO2 ±S.E. %CO2 F-value P-value
DOC 36.15 2.303 34.046 1.577 - 0.57 n.s. Total N 0.824 0.031 0.74 0.074 - 1.09 n.s. DIN 0.072 0.009 0.12 0.01 67 12.52 0.01 4 NH+ 0.066 0.01 0.12 0.021 82 5.54 0.05 3 NO− 0.098 0.01 0.126 0.047 - 0.33 n.s. P 0.031 0.004 0.02 0.009 −36 4.90 0.06 Cl− 1.096 0.019 1.152 0.087 - 0.40 n.s. 2 4 SO− 1.1 0.156 0.938 0.166 - 0.51 n.s. Ca2+ 2.33 0.256 2.312 0.366 - 0.00 n.s. Mg2+ 0.226 0.012 0.214 0.046 - 0.07 n.s. Na+ 0.58 0.018 0.612 0.082 - 0.15 n.s. K+ 0.765 0.145 0.441 0.105 −42 6.34 0.05 Fe3+ 0.666 0.221 0.688 0.135 - 0.02 n.s. Al3+ 0.088 0.012 0.136 0.012 55 8.23 0.02 pH 5.15 0.133 5.55 0.154 8 19.40 0.01 (b) Treatment: added N (df = 1)
No ±S.E. N+ ±S.E. %N+ F-value P-value
DOC 35.572 3.14 35.51 1.222 - <0.001 n.s. Total N 0.95 0.098 0.968 0.117 - 0.01 n.s. DIN 0.144 0.045 0.17 0.063 - 0.11 n.s. 4 NH+ 0.13 0.029 0.118 0.038 - 0.06 n.s. 3 NO− 0.196 0.099 0.3 0.198 - 0.22 n.s. P 0.048 0.005 0.032 0.006 −33 5.55 0.04 Cl− 1.354 0.185 1.518 0.344 - 0.18 n.s. 2 4 SO− 2.068 0.468 1.602 0.525 - 0.44 n.s. Ca2+ 4.86 1.211 3.738 0.874 - 0.57 n.s. Mg2+ 0.32 0.031 0.2 0.142 -38 9.30 0.02 Na+ 0.68 0.032 0.658 0.083 - 0.06 n.s. K+ 0.222 0.031 0.35 0.136 - 0.84 n.s. Fe3+ 1.79 0.364 0.852 0.121 −52 5.99 0.04 Al3+ 0.2 0.025 0.15 0.017 - 3.68 n.s. pH 5.89 0.149 5.48 0.218 −7 6.47 0.05
Table 2. ANOVA summary table showing least square means and effects of treatments on Polytrichum strictum and Sphag-num fallax growth measured with various growth-variables and methods (cut and uncut); HG = height-growth, ∆HG = height-growth difference between P. strictum and S. fallax, LG = length-growth, ∆LG = length-growth difference, MG = mass-growth, ∆MG = mass-growth difference; %CO2 and %N+ are the percentage treatment effects; “Bias” indicates cases where treatment effects as measured by the two methods are either similar (i.e. positive, negative or no effect: “no”) or dif-ferent (i.e. either both significant but of opposite effects or only one significant: “yes”). Percentage difference “∆cut-uncut” indicates the effect of cutting plants on growth-measurements: (cut-uncut)/cut in %; n.a. = not applicable, n.d. = not deter-mined; N (AIR or CO2 or N
+
or N0) = 5; for more readability the overall significant water table depth (WTD) factor is not shown here.
Variable
(unit) Species Method
Treatment: added CO2 (df = 1) Treatment: added N (df = 1)
AIR CO2 %CO2 F-value P-value Bias N0 N+ %N+ F-value P-value Bias
HGa (mm) Polytrichum Cut 13.6 10.0 −27% 3.6 0.07 No 18.5 10.4 −44% 4.2 0.05 Yes Uncut 46.3 31.3 −32% 13.2 0.001 25.7 31.4 22% 2.2 n.s. ∆Cut-uncut (%) −71% −68% −28% −67% Sphagnum Cut 8.4 4.8 −43% 6.0 0.02 No 16.5 6.1 −63% 5.2 0.03 Yes Uncut 35.1 26.9 −23% 4.5 0.04 22.2 24.7 11% 1.1 n.s. ∆Cut-uncut (%) −76% −82% −26% −75%
∆HGa (mm) Polytr.-Sphagnum Cut 5.0 5.2 3% 1.5 n.s. Yes 2.0 3.8 88% 8.9 0.006 No
Uncut 8.8 4.5 −49% 5.1 0.03 3.4 6.7 94% 4.2 0.05 LG (mm) Polytrichum Cut 13.3 12.0 −10% 3.1 n.s. Yes 17.6 11.1 −37% 27.5 <0.001 Yes Uncut 54.6 37.4 −32% 13.6 0.005 27.8 34.1 23% 3.1 n.s. ∆Cut-uncut (%) −76% −68% −37% −67% Sphagnum Cut 14.6 12.4 −15% 3.2 n.s. No
Plants too fragile to handle
n.d.
Uncut 37.8 32.1 −15% 3.1 n.s. 24.0 26.9 12% 0.7 n.s.
∆Cut-uncut
(%) −62% −61% n.a. n.a.
∆LG (mm) Polytr.-Sphagnum Cut 1.5 0.8 −45% 2.8 n.s. Yes Plants too fragile to handle n.d.
Uncut 10.2 5.3 −48% 3.9 0.08 3.9 7.3 89% 3.0 n.s. MG (mg) Polytrichum Cut 5.5 5.2 −5% 3.8 n.s. Yes 6.8 2.8 −58% 1.6 n.s. No Uncut 11.4 8.4 −27% 18.5 0.002 6.3 5.9 −5% 0.6 n.s. ∆Cut-uncut (%) −52% −38% 8% −53% Sphagnum Cut 6.7 8.2 22% 2.3 n.s. No
Plants too fragile to handle
n.d.
Uncut 6.4 6.0 −7% 1.8 n.s. 4.2 5.1 21% 2.4 n.s.
∆Cut-uncut
(%) 4% 36% n.a. n.a.
∆MG (mg) Polytr.-Sphagnum Cut −0.6 −2.7 338% 1.7 n.s. No
Plants too fragile to handle
n.d.
Uncut 4.2 2.4 −44% 2.7 n.s. 2.1 1.5 −25% 3.1 n.s.
a
Analyses were made with cranked-wire data measured at the time of final harvest.
effect and in the last case no significant effect was observed.
Thus overall in half of the cases the same results would be obtained regardless of the method used, but in the other half different conclusions would be reached. In the CO2 treatment, whenever a handling bias was observed, the treatment effect was less marked (and non-significant) for the cut plants. In contrast, in the N addition ex-periment, wherever a bias was observed cut plants were clearly negatively affected (they grew less) while the
growth of uncut plants was not significantly affected (but they tended to grow better). These plants also became too fragile to be handled thus making it impossible to estimating length- and mass-growth.
3.4. Pairwise Correlations
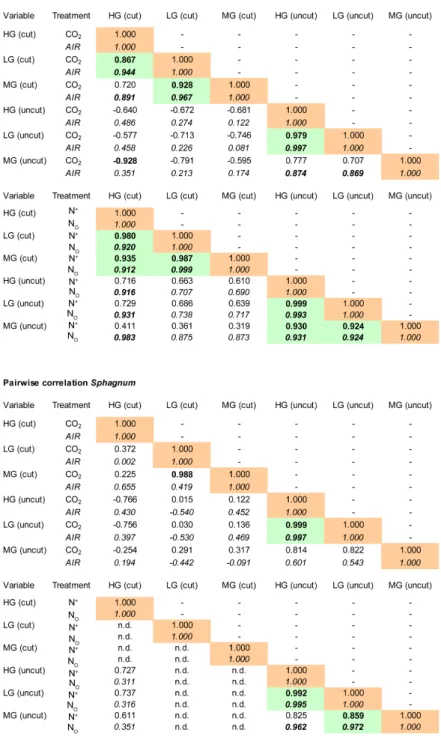
For Polytrichum, in the CO2 enrichment experiment, LG and HG were correlated for both, cut and uncut meth-ods and MG-cut was correlated to LG-cut (Figure 2). In the control plots, MG-cut was positively correlated to
Figure 2. Pairwise linear correlations (Pearson) between growth-variables and handling methods, for Polytrichum strictum (N = 5) and for Sphagnum fallax (N = 5). HG = height-growth, LG = length-growth, MG = mass-growth. Values in italics represent correlations for the control plots. Values in bold represent significant correlations (P ≤ 0.05). Shaded cells represent paired correlations that are significant within both, treated and control plots.
HG-cut, while in treated plots MG-uncut was negatively correlated to the HG-cut. In the N enrichment experi-ment, HG, LG and MG are all positively correlated within either the cut or the uncut method (Figure 2). Fur-thermore, only the HG-cut of control plots (N0) are correlated with the HG-uncut, LG-uncut and MG-uncut.
For Sphagnum, in the CO2 enrichment experiment, the only significant correlations were a positive correlation between HG-uncut and the LG-uncut (Figure 2), and a positive correlation between MG-cut and LG-cut of treated plots. In the N enrichment experiment, most of the cut Sphagnum plants were too fragile to do measure-ments (Figure 2). Only the HG-uncut, LG-uncut and MG-uncut data can be used. LG-uncut is correlated to both HG-uncut and MG-uncut, and MG-uncut is only correlated to HG-uncut in the control plots.
3.5. Seasonal Growth Patterns of Cut Plants
No significant cross-effect between treatments and time was observed for the HG of either species using the cut plant methods (Figures 1(1)-(4)).
The two experiments had contrasting effects on ∆HG both overall and in the seasonal pattern: In CO2 treated plots, ∆HG remained below that of the control plots until the beginning of September after which it was en-hanced by the treatment (Figure 1(5) and Figure 1(7)). By contrast, N addition did not affect ∆HG until the
be-ginning of September, after which it was significantly enhanced by the treatment (Figure 1(6) and Figure 1(8)). In the end, N addition enhanced ∆HG (+89%, P = 0.006).
Sphagnum had two growths period in the control plots. The first period of growth occurred from spring until
mid-July and the second after the beginning of September until the end of the season. By contrast the growth of
Polytrichum, was unimodal and lasted from spring until mid-July.
Overall, the growth-rate of Sphagnum was inhibited (−56%, P = 0.007) by the CO2 treatment, reaching a maximum difference by mid-July followed by an inhibition stop after the beginning of September. Whilst the growth-rate of CO2 treated Polytrichum was initially less than that of the control, after the beginning of Sep-tember it suddenly increased.
N addition significantly reduced the growth-rate of Sphagnum in September, while the growth-rate of
Poly-trichum was not significantly affected.
4. Discussion
4.1. Effects of Handling on Moss-Growth Measurements
Ideally, different handling methods should yield identical results for a given species in a given environment. If all measurements are systematically modified by the same handling method but that this does not affect the re-sults of manipulative experiments or comparisons among species then such a bias may be tolerable. However, if a handling method affects some species, and/or if there is an interaction between the handling and the treatment (e.g. climate change conditions) that effect the growth-measurement then this will make comparisons among studies completely irrelevant. Our data show that such a problem indeed exists between the cut and uncut han-dling methods (Table 2). Not only do the results differ in absolute terms by as much as 82% but the interpreta-tion of results depends on the handling method—and thus the interpretainterpreta-tion would be biased—in half of the cases. These results call for caution when comparing studies based on different handling methods.
In general, while the cut plants handling method is straightforward and very precise; it remains an intrusive method [26] [32]. If the water table drops below the cutting level, as it did in our case, the resulting physical separation may significantly reduce the health of the plants [26].
4.2. “Benchmarking” of Growth-Variables
It would be useful to rely on a single, quick and easy method to obtain reliable growth data. We compared si-multaneously three growth-variables both, in terms of absolute value and in terms of correspondence (correla-tions).
With respect to absolute values, our data show that growth, measured using the height-growth method, is un-derestimated by 7.2% to 16.4% for Sphagnum and by 7.8% to 16.3% for Polytrichum relative to length-growth (Table 2). This is in accordance with another experiment performed by [33] who showed that Sphagnum plants measured with the cranked-wire method (i.e. height-growth) were underestimating growth by 10% - 20% in comparison to the 14C labelling method (i.e. length-growth). A more recent study shows that the cranked-wire
method was inaccurate because of the water movements and the freeze-thaw cycles [43].
With respect to correspondence, our results show that all variables correlate fairly well but that discrepancies depend on plant species and, to a lesser extent, to CO2 or N experiment (Figure 2). Overall 88% (21/24) of cor-relations within handling methods were significant for Polytrichum but only 44% (8 out of the possible 18) for
Sphagnum. Between cut and uncut handling methods these values dropped to 8% for Polytrichum (3/36) and 0%
for Sphagnum. These results show that a single growth-variable is in most cases sufficient for Polytrichum but that this is not the case for Sphagnum. For Sphagnum, the uncut approach, height- and length-growth are in all cases correlated and length-growth was correlated to mass-growth only in the N addition experiment. It follows that if a single growth-measurement should be chosen to measure the growth of Sphagnum, then length-growth would be the best choice. Length-growth would also be the best variable to estimate the growth of Polytrichum, being in all cases significantly correlated to height-growth and in all but one case to mass-growth.
Even though the cranked-wire method can underestimate growth because of the sinuous growth of Sphagnum it remains the most applicable and less intrusive method for measuring growth-dynamics, competition and phenology simultaneously. Reference [34] qualifies this method as most reliable for increments smaller than 2 cm when used for Sphagnum.
4.3. Elevated CO2 Effects
The height-growth of both moss species was inhibited by the CO2 treatment (Table 2), while the length-growth and mass-growth were only reduced for Polytrichum. This suggests that CO2 treatment changed the habitus of the plants and/or increased the linear mass density of the plants. This is in accordance with [14] who showed an increased capitulum density and [13] who concomitantly found an increased stem density for various Sphagnum species. However, in our study, as the subsequently analysed mass-to-length ratio of Sphagnum did not change between treatment and control plots the effect is more likely due to a more sinuous growth.
In terms of growth-competition between the two species, during spring and summer, the height-growth dif-ference of CO2 treated and cut plants was below that shown in the control because Polytrichum’s initial growth- rate was not as high as for control plants (Figure 1(5)). After September, this height-growth difference became higher than in the control because treated Sphagnum did not experience the growth-rate peak by mid-July as did the control ones. The fact that by September Polytrichum’s final growth-rate was higher than the control, while
Sphagnum’s growth-rate remained unchanged, kept the height-growth difference of treated cut plants above that
of control plots (Figure 1(7)). In the end, these growth-inhibitions were less strong for Sphagnum and reduced the difference in height between the two species.
Given the lack of data published on Polytrichum and these two species in interaction, we must compare our results with work done on various Sphagnum species. For example, in a phytotron CO2 enrichment experiment, [14] found a negative effect on length-growth and no effect on mass-growth for S. balticum (hollow species), and no effect on length-growth but a positive effect on mass-growth for S. papillosum (low hummock species). Earlier, [13] found a negative effect on length-gowth but no effect on mass-growth of S. fuscum (hummock spe-cies). The following year, he found no effect on height-growth or mass-growth of S. fuscum and S.
magellani-cum (lawn or low hummock species). Our literature review (Table A1) supports the idea that among Sphagnum, strategies for using CO2 may well be species-specific, as proposed by [13].
There may be several reasons for the height-growth inhibition of both species under CO2 treatment:
1) Under elevated CO2, nutrient uptake could not keep pace with the triggered photosynthesis, leading to sub-optimal nutrient availability preventing the transfer of additionally fixed carbon (TNC and starch) to pro-duction of structural tissue. Lacking roots, bryophytes cannot increase nutrient foraging and may not benefit from elevated CO2 in terms of structural growth.
2) The 82% higher ammonium concentrations in treated plots might have inhibited growth [10] [12] [35] [36]. Ammonium concentration in treated plots is half of that found in very polluted areas of the South Pennine, UK (17.2 µM) and about 10 times greater than unpolluted (<1 µM) surface mire water in North Wales [37]. The pH shows that pattern. Furthermore, Sphagnum HG-cut was negatively correlated with DIN (r2 = 0.612, P = 0.01) and ammonium (r2 = 0.418, P = 0.04) (Figure 3).
3) Al3+ ion concentration was 55% higher in treated plots, however no linear correlation was found between height-growth and Al3+ that would attest potential growth inhibition due to toxic effects of Al3+ as originally proposed by [9].
Figure 3. Linear regression between Sphagnum fallax height-growth of cut plants (HG-cut) and dissolved inorganic nitrogen (DIN) or ammonium (NH4
+
) concentrations in mg/L; N = 10; plain circles = elevated CO2, empty circles = ambient air. 4.4. N Addition Effects
N addition reduced Sphagnum (−63%) height-growth more than Polytrichum (−43%), the height-growth differ-ence (∆HG) therefore increased (Table 2). After the beginning of September, Sphagnum were increasingly more affected by the treatment and could not keep pace with Polytrichum, which benefited from a less reduced growth-rate in mid-July compared to Sphagnum (Figure 1(8)). N addition also caused Sphagnum plants to grow weaker making mass-growths measurements all but impossible.
Cutting the plants added inhibitory effects that were not present for the uncut plants. Comparatively, Twen-höven [12] found a positive N treatment effect on mass-growth of Sphagnum in hollows and no effect in hum-mocks (Table A1) with cut plants. Similarly, using uncut plants, [11] found different N effects on height- growth and mass-growth depending on whether Sphagnum was growing on N-rich or N-poor sites. Other studies showed an inhibition of mass-growth or cover for S. fallax with ammonium and/or nitrate [9] [10]. This was also the case for P. strictum [23]. Although the picture seems contrasted, it appears from our review that the some-what higher inorganic N additions, although close to optimal concentrations, lead to positive effects on either length-growth or height-growth, whereas supra-optimal ones lead to inhibitions.
There may be several reasons for the height-growth inhibition of both species under N addition:
1) N addition could P- or K-limit instead of N-limit plant productivity [11] [16] [17]. In our case, P concen-trations were low (N+: 0.032, N0: 0.048 mg/L) and comparable to unpolluted ombrotrophic Sphagnum bogs in northern Finland [0.047 mg/L; 38]. The significant P reduction (−33%) under enhanced N as well as the lower P/N ratio in treated plots compared to control plots (N+: 0.033; N0: 0.051) could be a first indication for potential P-limiting conditions. This is confirmed by a parallel study on our site that showed that Sphagnum was jointly P- and K-limited [16], and therefore cutting of plants might have limited growth even further through chemical disconnection from the lower peat parts.
2) N addition might have been immobilised after application by other plants [39] or microbes [40]. However, this would not explain the lack of growth-inhibitions for uncut plants.
3) N addition as a 1:1 (mole/mole) NH4NO3 mixture might decrease soil pH [41] leading to decreased ex-changeable cations (Ca2+, Mg2+), and increase NH4+ and NO3− leaching [42]. The lower Mg2+ concentrations in treated plots may indicate that such processes are occurring. However, given the tolerance of Sphagnum for pH ≤ 3 [10] a direct effect of pH is unlikely.
5. Conclusions
Growth-measurements involving initial cutting of the moss shoots (still widely applied) should be avoided as they have a strong potential to induce bias in the conclusions of studies. From the present study we can also recommend that for Polytrichum, it is preferable not to use “capitulum correction” (MG) together with enhanced N experiments. For Sphagnum, it is essential to use uncut plants together with a length-growth measurement in
both treatments. It follows that if a single growth-measurement should be chosen to measure the growth of
Sphagnum, then length-growth would be the best choice. Length-growth would also be the best variable to
esti-mate the growth of Polytrichum, being in all cases significantly correlated to height-growth and in all but one case to mass-growth.
Investigating the various growth responses as a function of exactly the same set of treatments helped us to in-vestigate more sharply how the handling methods and the selected growth variables interacted with the treat-ments. Discussing the ecological aspects around those growth responses in parallel to the methodological as-pects adds a lot of information and enables to qualify the nature of the methodological biases. For example, the somewhat typical nutrient-dilutions found in enhanced N plots may become even more important if cut plants methods are being used. Furthermore, the sinuous growth of mosses under elevated CO2 may warn the research-ers not use of the straightforward “cranked wire” together with averaged stem densities to estimate the biomass production.
Finally, we recommend moss ecologists to be very cautious when selecting a growth-measurement method for their factorial experiments, as interactions exist between the method and the treatment, and do matter. This also applies for meta-analyses that aim to summarize production values studied under specific treatments and gath-ered from various sources.
Acknowledgements
This work was carried out in the frame of the EC BERI (Bog Ecosystem Research Initiative) project. We thank Jacquline Moret, University of Neuchâtel, for statistical advice and Fanny Debely for technical assistance.
References
[1] Post, W., et al. (1982) Soil Carbon Pools and World Life Zones. Nature, 298, 156-159.
http://dx.doi.org/10.1038/298156a0
[2] Siegenthaler, A., et al. (2013) Factors Modulating Cottongrass Seedling Growth Stimulation to Enhanced Nitrogen and Carbon Dioxide: Compensatory Tradeoffs in Leaf Dynamics and Allocation to Meet Potassium-Limited Growth. Oecologia, 171, 557-570. http://dx.doi.org/10.1007/s00442-012-2415-8
[3] Buttler, A., Grosvernier, P. and Matthey, Y. (1998) Development of Sphagnum fallax Diaspores on Bare Peat with Im-plications for the Restoration of Cut-Over Bogs. Journal of Applied Ecology, 35, 800-810.
http://dx.doi.org/10.1046/j.1365-2664.1998.355351.x
[4] Groeneveld, E.V.G., Masse, A. and Rochefort, L. (2007) Polytrichum strictum as a Nurse-Plant in Peatland Restoration. Restoration Ecology, 15, 709-719. http://dx.doi.org/10.1111/j.1526-100X.2007.00283.x
[5] Grosvernier, P., Matthey, Y. and Buttler, A. (1995) Microclimate and Physical Properties of Peat: New Clues to the Understanding of Bog Restoration Processes. In: Wheeler, B.D., et al., Eds., The Restoration of Temperate Wetlands, Wiley & Sons, Chichester, 437-450.
[6] Lee, J.A., Tallis, J.H. and Woodin, S.J. (1998) Acidic Deposition and British Upland Vegetation, in Ecological Change in the Uplands. In: Usher, M.B. and Thompson, D.B.A., Eds., Blackwell Scientific Publications, Oxford, 151-162. [7] Steinnes, E., et al. (1994) Atmospheric Deposition of Trace-Elements in Norway—Temporal and Spatial Trends
Stud-ied by Moss Analysis. Water Air and Soil Pollution, 74, 121-140. http://dx.doi.org/10.1007/BF01257151
[8] Aro, E.M., Gerbaud, A. and Andre, M. (1984) CO2 and O2 Exchange in Two Mosses, Hypnum cupressiforme and Di-cranum scoparium. Plant Physiology, 76, 431-435. http://dx.doi.org/10.1104/pp.76.2.431
[9] Touffet, J. (1987) Etude expérimentale de l’influence de la nature et de la concentration minérale du milieu sur le développement et la teneur en cations des sphaignes. Botanica Rhedonica, Série A, 10, 293-302.
[10] Austin, K.A. and Wieder, R.K. (1987) Effects of Elevated H+, 2 4 SO−, NO3
−
and NH4 +
in Simulated Acid Precipita-tion on the Growth and Chlorophyll Content of 3 North America Sphagnum Species. Bryologist, 90, 221-229.
http://dx.doi.org/10.2307/3242930
[11] Aerts, R., Wallen, B. and Malmer, N. (1992) Growth-Limiting Nutrients in Sphagnum-Dominated Bogs Subject to Low and High Atmospheric Nitrogen Supply. Journal of Ecology, 80, 131-140. http://dx.doi.org/10.2307/2261070
[12] Twenhöven, F.L. (1992) Competition between Two Sphagnum Species under Different Deposition Levels. Journal of Bryology, 17, 71-80. http://dx.doi.org/10.1179/jbr.1992.17.1.71
[13] Jauhiainen, J., Vasander, H. and Silvola, J. (1994) Response of Sphagnum fuscum to N Deposition and Increased CO2. Journal of Bryology, 18, 83-95. http://dx.doi.org/10.1179/jbr.1994.18.1.83
[14] Van der Heijden, E., et al. (1998) Effects of Elevated CO2 and Nitrogen Deposition on Sphagnum Species, in Re-sponses of Plant to Air Pollution and Global Change. In: De Kok, L.J. and Stulen, I., Eds., Backhuys Publishers, Lei-den, 475-478.
[15] Heijmans, M., et al. (2001) Effects of Elevated Carbon Dioxide and Increased Nitrogen Deposition on Bog Vegetation in the Netherlands. Journal of Ecology, 89, 268-279. http://dx.doi.org/10.1046/j.1365-2745.2001.00547.x
[16] Hoosbeek, M.R., Van Breemen, N., Vasander, H., Buttler, A. and Berendse, F. (2002) Potassium Limits Potential Growth of Bog Vegetation under Elevated Atmospheric CO2 and N Deposition. Global Change Biology, 8, 1130-1138.
http://dx.doi.org/10.1046/j.1365-2486.2002.00535.x
[17] Limpens, J., Berendse, F. and Klees, H. (2004) How Phosphorus Availability Affects the Impact of Nitrogen Deposi-tion on Sphagnum and Vascular Plants in Bogs. Ecosystems, 7, 793-804. http://dx.doi.org/10.1007/s10021-004-0274-9
[18] Bubier, J.L., Moore, T.R. and Bledzki, L.A. (2007) Effects of Nutrient Addition on Vegetation and Carbon Cycling in an Ombrotrophic Bog. Global Change Biology, 13, 1168-1186. http://dx.doi.org/10.1111/j.1365-2486.2007.01346.x
[19] Wieder, R.K., Burke-Scoll, M., Scott, K.D., House, M. and Vile, M.A. (2010) Nitrogen and Sulphur Deposition and the Growth of Sphagnum fuscum in Bogs of the Athabasca Oil Sands Region, Alberta. Journal of Limnology, 69, 161- 170. http://dx.doi.org/10.4081/jlimnol.2010.s1.161
[20] Breeuwer, A., Robroek, B.J.M., Limpens, J., Heijmans, M.M.P.D., Schouten, M.G.C. and Berendse, F. (2009) De-creased Summer Water Table Depth Affects Peatland Vegetation. Basic and Applied Ecology, 10, 330-339.
http://dx.doi.org/10.1016/j.baae.2008.05.005
[21] Mitchell, E.A.D., Buttler, A., Grosvernier, P., Rydin, H., Siegenthaler, A. and Gobat, J.M. (2002) Contrasted Effects of Increased N and CO2 Supply on Two Keystone Species in Peatland Restoration and Implications for Global Change. Journal of Ecology, 90, 529-533. http://dx.doi.org/10.1046/j.1365-2745.2002.00679.x
[22] Toet, S., Cornelissen, J.H.C., Aerts, R., van Logtestijn, R.S.P., de Beus, M. and Stoevelaar, R. (2006) Moss Responses to Elevated CO2 and Variation in Hydrology in a Temperate Lowland Peatland. Plant Ecology, 182, 27-40.
[23] Jäppinen, J.P. and Hotanen, J.P. (1990) Effect of Fertilization on the Abundance of Bryophytes in Two Drained Peat-land Forests in Eastern FinPeat-land. Annales Botanici Fennici, 27, 93-108.
[24] Limpens, J., Granath, G., Aerts, R., Heijmans, M.M.P.D., Sheppard, L.J., Bragazza, L., Williams, B.L., et al. (2012) Glasshouse vs Field Experiments: Do They Yield Ecologically Similar Results for Assessing N Impacts on Peat Mosses? The New Phytologist, 195, 408-418. http://dx.doi.org/10.1111/j.1469-8137.2012.04157.x
[25] Overbeck, F. and Happach, H. (1956) Über das Wachstum und den Wasserhaushalteiniger Hochmoorsphagnen. Flora Jena, 144, 355-402.
[26] Clymo, R.S. (1970) The Growth of Sphagnum: Methods and Measurement. Journal of Ecology, 58, 13-49.
http://dx.doi.org/10.2307/2258168
[27] Taub, D.R. and Wang, X.Z. (2008) Why Are Nitrogen Concentrations in Plant Tissues Lower under Elevated CO2? A Critical Examination of the Hypotheses. Journal of Integrative Plant Biology, 50, 1365-1374.
http://dx.doi.org/10.1111/j.1744-7909.2008.00754.x
[28] Van Breemen, N. (1995) How Sphagnum Bogs down Other Plants. Trends in Ecology & Evolution, 10, 270-275.
http://dx.doi.org/10.1016/0169-5347(95)90007-1
[29] Nabel (1995) Air Pollution: Measurements Made by the National Survey Network of Atmospheric Pollutants. Federal Service for Environment, Forest and Landscape, Bern.
[30] Miglietta, F., Hoosbeek, M.R., Foot, J., Gigon, F., Hassinen, A., Heijmans, M., Peressotti, A., Saarinen, T., van Bree-men, N. and Wallén, B. (2001) Spatial and Temporal Performance of the MiniFACE (Free Air CO2 Enrichment) Sys-tem on Bog EcosysSys-tems in Northern and Central Europe. Environmental Monitoring and Assessment, 66, 107-127.
http://dx.doi.org/10.1023/A:1026495830251
[31] Buurman, P., van Lagen, B. and Velthorst, E.J. (1996) Manual for Soil and Water Analysis. Backhuys, Leiden. [32] Francez, A.J. (1992) Croissanceet production primaire des sphaignesdansunetourbière des Monts du Forez (Puy-de-
Dome, France). Vie et Milieu, 42, 21-34.
[33] Wallen, B., Falkengren-Grerup, U. and Malmer, N. (1988) Biomass, Productivity and Relative Rate of Photosynthesis of Sphagnum at Different Water Levels on a South Swedish Peat Bog. Holarctic Ecology, 11, 70-76.
[34] Clymo, R.S. (1973) The Growth of Sphagnum: Some Effects of Environment. Journal of Ecology, 61, 849-869.
http://dx.doi.org/10.2307/2258654
[35] Press, M., Woodin, S. and Lee, J. (1996) The Potential Importance of an Increased Atmospheric Nitrogen Supply to the Growth of Ombrotrophic Sphagnum Species. New Phytologist, 103, 45-55.
[36] Rudolph, H. and Voigt, J.U. (1986) Effects of NH -N4+ and NO -N3− on Growth and Metabolism of Sphagnum ma-gellanicum. Physiologia Plantarum, 66, 339-343. http://dx.doi.org/10.1111/j.1399-3054.1986.tb02429.x
[37] Baxter, R., Emes, M.J. and Lee, J.A. (1992) Effects of an Experimentally Applied Increase in Ammonium on Growth and Amino-Acid Metabolism of Sphagnum cuspidatum Ehrh. ex. Hoffm. from Differently Polluted Areas. New Phy-tologist, 120, 265-275. http://dx.doi.org/10.1111/j.1469-8137.1992.tb05663.x
[38] Pakarinen, P. and Tolonen, K. (1977) Nutrient Contents of Sphagnum Mosses in Relation to Bog Water Chemistry in Northern Finland. Lindbergia, 4, 27-33.
[39] Chapin, F.S. (1988) Ecological Aspects of Plant Mineral Nutrition. Advances in Plant Nutrition, 3, 161-191.
[40] Chapin, F.S., Vitousek, P.M. and Van Cleve, K. (1986) The Nature of Nutrient Limitations in Plant Communities. American Naturalist, 127, 48-58.
[41] Proctor, M.C.F. (1997) Aspects of Water Chemistry in Relation to Surface Degradation on Ombrotrophic Mires. In: Tallis, J.H., Meade, R. and Hulme, P.D., Eds., Blanket Mire Degradation Causes, Consequences and Challenges, Brit-ish Ecological Society, London, 140-152.
[42] Cresser, M., et al. (1997) The Physical and Chemical Stability of Ombrogenous Mires in Response to Changes in Pre-cipitation Chemistry. In: Tallis, J., Meade, R. and Hulme, P., Eds., Blanket Mire Degradation Causes, Consequences and Challenges, The Macaulay Land Use Research Institute, Aberdeen, 153-159.
[43] Pouliot, R., Marchand-Roy, M., Rochefort, L. and Gauthier, G. (2010) Estimating Moss Growth in Arctic Conditions: A Comparison of Three Methods. The Bryologist, 113, 322-332. http://dx.doi.org/10.1639/0007-2745-113.2.322
Appendix
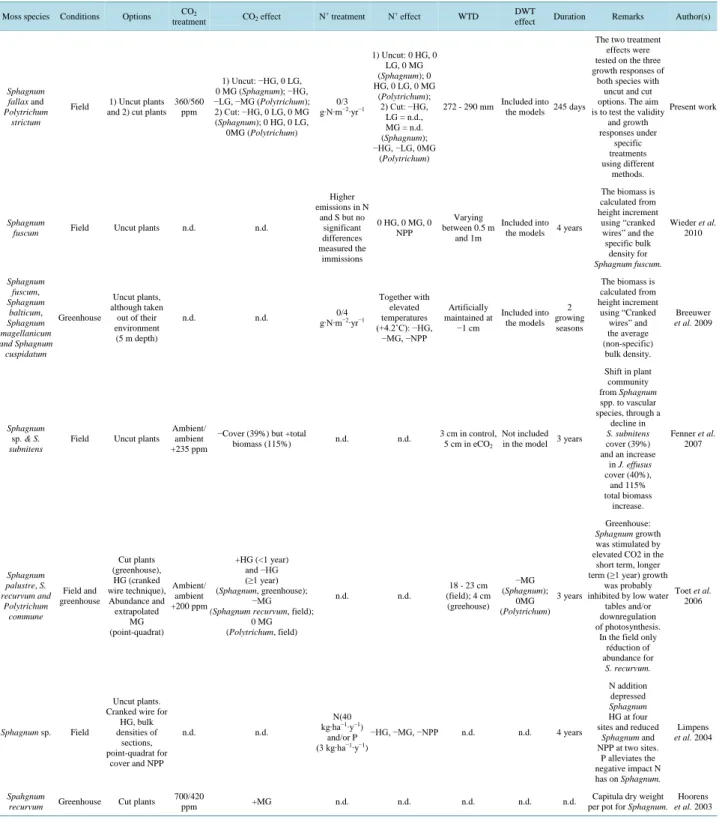
Table A1. Online resource. Non-exhaustive 40 years’ review of relevant studies concerning the growth of Sphagnum sp. and Poly-trichum sp. under elevated atmospheric CO2 or/and enhanced mineral N deposition (N+). WTD = water table depth, HG = height- growth, LG = length-growth, MG = mass-growth, NPP = net primary production, P/B = production-to-biomass ratio; the “+, −, 0” signs placed in front of a growth-variable inform on the treatment effect on that variable; n.d. = not determined; cut = plants were cut and inserted into surrounding vegetation, uncut = plants were only harvested at the end of the growing season and the time was time-marked without cutting.
Moss species Conditions Options CO2
treatment CO2 effect N +
treatment N+
effect WTD DWT
effect Duration Remarks Author(s)
Sphagnum fallax and Polytrichum
strictum
Field 1) Uncut plants and 2) cut plants
360/560 ppm 1) Uncut: −HG, 0 LG, 0 MG (Sphagnum); −HG, −LG, −MG (Polytrichum); 2) Cut: −HG, 0 LG, 0 MG (Sphagnum); 0 HG, 0 LG, 0MG (Polytrichum) 0/3 g∙N∙m−2∙yr−1 1) Uncut: 0 HG, 0 LG, 0 MG (Sphagnum); 0 HG, 0 LG, 0 MG (Polytrichum); 2) Cut: −HG, LG = n.d., MG = n.d. (Sphagnum); −HG, −LG, 0MG (Polytrichum) 272 - 290 mm Included into the models 245 days
The two treatment effects were tested on the three growth responses of
both species with uncut and cut options. The aim is to test the validity
and growth responses under specific treatments using different methods. Present work Sphagnum
fuscum Field Uncut plants n.d. n.d.
Higher emissions in N and S but no significant differences measured the immissions 0 HG, 0 MG, 0 NPP Varying between 0.5 m and 1m Included into the models 4 years
The biomass is calculated from height increment using “cranked wires” and the specific bulk density for Sphagnum fuscum. Wieder et al. 2010 Sphagnum fuscum, Sphagnum balticum, Sphagnum magellanicum and Sphagnum cuspidatum Greenhouse Uncut plants, although taken out of their environment (5 m depth) n.d. n.d. g∙N∙m0/4 −2∙yr−1 Together with elevated temperatures (+4.2˚C): −HG, −MG, −NPP Artificially maintained at −1 cm Included into the models 2 growing seasons The biomass is calculated from height increment using “Cranked wires” and the average (non-specific) bulk density. Breeuwer et al. 2009 Sphagnum sp. & S. subnitens
Field Uncut plants Ambient/
ambient +235 ppm
−Cover (39%) but +total
biomass (115%) n.d. n.d.
3 cm in control, 5 cm in eCO2
Not included in the model 3 years
Shift in plant community from Sphagnum spp. to vascular species, through a decline in S. subnitens cover (39%) and an increase in J. effusus cover (40%), and 115% total biomass increase. Fenner et al. 2007 Sphagnum palustre, S. recurvum and Polytrichum commune Field and greenhouse Cut plants (greenhouse), HG (cranked wire technique), Abundance and extrapolated MG (point-quadrat) Ambient/ ambient +200 ppm +HG (<1 year) and −HG (≥1 year) (Sphagnum, greenhouse); −MG
(Sphagnum recurvum, field);
0 MG (Polytrichum, field) n.d. n.d. 18 - 23 cm (field); 4 cm (greehouse) −MG (Sphagnum); 0MG (Polytrichum) 3 years Greenhouse: Sphagnum growth was stimulated by elevated CO2 in the
short term, longer term (≥1 year) growth
was probably inhibited by low water
tables and/or downregulation of photosynthesis.
In the field only réduction of abundance for S. recurvum. Toet et al. 2006 Sphagnum sp. Field Uncut plants. Cranked wire for
HG, bulk densities of sections, point-quadrat for cover and NPP n.d. n.d. N(40 kg∙ha−1∙y−1) and/or P (3 kg∙ha−1∙y−1) −HG, −MG, −NPP n.d. n.d. 4 years N addition depressed Sphagnum HG at four sites and reduced
Sphagnum and NPP at two sites. P alleviates the negative impact N has on Sphagnum. Limpens et al. 2004 Spahgnum
recurvum Greenhouse Cut plants
700/420
ppm +MG n.d. n.d. n.d. n.d. n.d.
Capitula dry weight per pot for Sphagnum.
Hoorens
Continued Sphagnum fallax and Polytrichum strictum Field Uncut plants 360/560 ppm 0 HG and 0 MG (Sphagnum); −HG and 0 MG (Polytrichum) 0/3 g∙N∙m−2∙yr−1 0 HG and −MG (Sphagnum); 0 HG and +MG (Polytrichum) n.d. n.d. 3 years
The two treatments had contrasting effects on competition between the initial coloniser Polytrichum
strictum (favoured by high N)
and the later coloniser
Sphagnum fallax (favoured by high CO2). Mitchell et al. 2002 Sphagnum sp. and Polytrichum strictum Field Uncut plants 360/560 ppm 0 MG (Sphagnum); 0 MG (Polytrichum) 0/3/5 g N m−2 yr−1 −MG (Sphagnum); +cover (Polytrichum) n.d. n.d. n.d.
P and K may have prevented Sphagnum growth
increase under enhanced CO2 or N. Hoosbeek et al. 2002 S.magellanicum Mesocosm (greenhouse) Uncut plants 360/560 ppm −HG, −MG 0/3/5 g∙N∙m −2∙ yr−1 0 HG, 0 MG n.d. n.d. 2 years Elevated atmospheric CO2
had unexpected deleterious effects on the growth of
Sphagnum magellanicum, the
dominant Sphagnum species. Both treatments were
combined.
Heijmans 2002
S.magellanicum Field Uncut
plants 360/560 ppm +HG; 0 MG
0/3/5 g∙N∙m−2∙
yr−1
−HG (3rd year);
−MG Artificially maintained n.d. 3 years
Peat monoliths were excavated from Sphagnum lawns. The letters in () stand
for the greenhouse experiement.
Heijmans 2001
S. magellanicum Field/
glasshouse Cut plants n.d. n.d.
NH4NO3
0/10/30/100 kg/ha/a
0 MG globally for
the 4 field sites 7/17/37 cm −MG 1 growing
season
4 field + 1 glasshouse experiments accross Europe.
Willams et
al. 1999
S. balticum Lab Cut plants 360/720 ppm −LG; 0 MG NH4NO3 0/30
kg/ha/a 0 LG; 0 MG n.d. n.d. n.d.
CO2: more soluble sugars in
stems and capitula; N+
: more total organic N in stems and
capitula.
van der Heijden et
al. 1998
S. papilosum Lab Cut plants 360/720 ppm 0 LG; +MG NH4NO3 0/30
kg/ha/a 0 LG; + MG n.d. n.d. n.d.
CO2: more soluble sugars in
stems and capitula; N+
: more total organic N in stems and
capitula
van der Heijden
et al. 1998
S. fallax Lab Cut plants n.d. n.d. n.d. n.d. 1 - 40 cm −LG; −MG 15 weeks
Regeneration experiment; usage of cut plants; water level = 9.5% variance; usage of capitulum correction
Clymo (1970).
Grosvernier
et al. 1997
S. magellanicum Field Uncut
plants n.d. n.d. NH4NO3 0/10/30/100 kg/ha/a +MG at 10 kg but MG at 30 and 100 kg
8.5 to −1.5 cm n.d. 20 weeks N/P ratio reduced with N
+ , probably P-deficient. Williams and Silcock 1997
S. fuscum Field Uncut
plants n.d. n.d.
NH4NO3 0/15
kg/ha/a dry except for one
site
−MG(NPP) variable +MG (NPP)
1 growing season
Moss growth was water limited; Neither N nor P
limited aboveground NPP in fens and
marshes.
Thormann and Bayley 1997
S. magellanicum
and S. fuscum Lab Cut plants 350/700 ppm 0 HG; 0 MG
NH4NO3 0/100 kg/ha/a −LG; −MG 7 cm (S. magellanicum); 10 cm (S. fuscum) n.d. 70 - 100 days Indifferent sp. Lawn restricted, lowered tolerance of increased N. Jauhiainen et al. 1996 and 1998
S. fuscum Greenhouse Uncut
plants 350/700/1000 ppm −LG; 0 MG NH4NO3 0/10/30/100 kg/ha/a 100 kg: −LG, −HG; others: +LG, 0 MG 10 cm n.d. 120 days
For LG 10 kg/ha/a and for MG 30 kg/ha/a were found to
be the optimal loads. N/P ratios in capitula changed with N+; stem mass incresed
with CO2.
Jauhiainen
et al. 1994
S. cuspidatum Lab Cut plants n.d. n.d. NH4
+ 0/0.1/1 mM
−LG in low-N site and +LG in high-N site both at 0.1 and
1 mM
n.d. n.d. 5 months 4
NH+ is the dominant available N form, reduction
of chloropyll content with
4
NH+.
Baxter et al. 1992
S. magellanicum
and S. fallax Field Cut plants n.d. n.d. (NO3 − 59 µM + NH4 + 372 µM) or (NO3− 300 µM + 4 NH+ 131 µM) S. magellanicum: 0 MG in hollows and −MG in hummocks; S. fallax: +MG in hollows and −MG in hummocks n.d. n.d. 15 weeks Effect dependent on microtopography but 4 NH+ >123 µM is inhibiting growth. Twenhöven 1992
Sphagnum sp. Field Uncut
plants n.d. n.d.
HH4NO3 20/40
kg/ha/a
+HG, +MG in N-low site and 0
HG, 0 MG in high-N site
n.d. n.d. 5 months
MG was done without capitulum correction; S.
balticum = low-N site and S. magellanicum = high-N site.
Aerts et al. 1992
P. junipericum
and P. piliferum Lab Cut plants n.d. n.d.
4 NH+ 0.234 mg/l and 3 NO− 0.400 mg/l Greater N retention and feedback to biomass n.d. n.d. 12 hours
Two positive feedbacks of moss ecosystem: 1) more biomass, more retention, more biomass; 2) more aboveground biomass, more dry-N collection, more inputs,
more aboveground biomass. Bowden
Continued
S. fuscum, S. magellanicum and S.
angustifolium
Field Uncut plants n.d. n.d.
Simulated acid rain NO3 − 4.6 kg/ha/a and 2 4 SO− 18 kg/ha/a +HG;+MG or 0 MG but stabilisation after 4th year
n.d. n.d. 2 - 4 years Short-term fertilisation effect. Rochfort and Bayley 1990
P. strictum Field Uncut plants n.d. n.d. NPK: 100 N, 43.6
P, 83 K kg/ha %coverage; −P/B 30 - 50
cm n.d. 2 years
Sedge/spruce-pine and Vaccinium
myrtillus swamps.
Jäppinen and Hotanen 1990
S. fallax Field Cut plants n.d. n.d.
4 NH+ 12.2/68/123 µM or 3 NO− 5.2/109/213 µM for NH4 + +LG at 68 µM and −LG at 123 µM; for NO3 − 0LG n.d. n.d. 40 - 50 days
If pH < 3 it may inhibit Sphagnum growth; cut plants methods.
Austin and Wieder 1987
S. magellanicum Lab Cut plants n.d. n.d. NH4
+ ≥ 95 µM −LG; −MG n.d. n.d. - NH4 +
inhibited photosynthesis and nitrate reductase activity.
Rudolph and Voigt 1986
S. cuspidatum Field/lab Cut plants n.d. n.d. NH4NO3 −LG n.d. n.d. 140 days
4
NH+ depressed growth more than 3
NO− at 0.01 M.
Press et al. 1986
S. nemoreum Lab Inocules
(1 cm stem) n.d. n.d.
NH4NO3
0/1.25/2.5/5 mM
+MG but optimal
with 1.25 mM n.d. n.d. 100 days
1.25 mM was the best inorganic nitrogen source; at higher
concentra-tions amino acids could enhance growth.
Simola 1975
Sphagnum sp. Lab Cut plants n.d. n.d. X+
NO3 10 meq/l −HG n.d. n.d. 3 months
3
NO− more toxic than other anions because enhanced the penetration of cations, maybe because of its higher
penetration velocity.
currently publishing more than 200 open access, online, peer-reviewed journals covering a wide range of academic disciplines. SCIRP serves the worldwide academic communities and contributes to the progress and application of science with its publication.
Other selected journals from SCIRP are listed as below. Submit your manuscript to us via either [email protected] or Online Submission Portal.