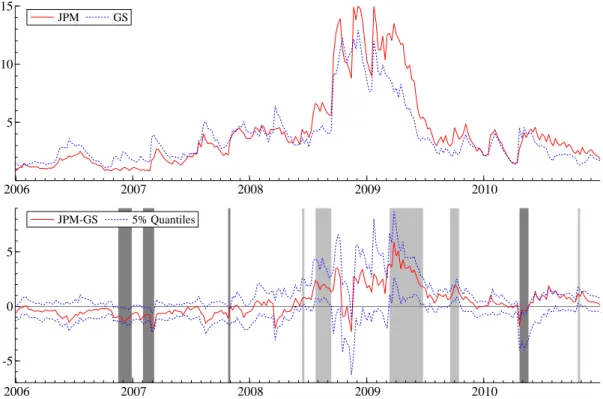
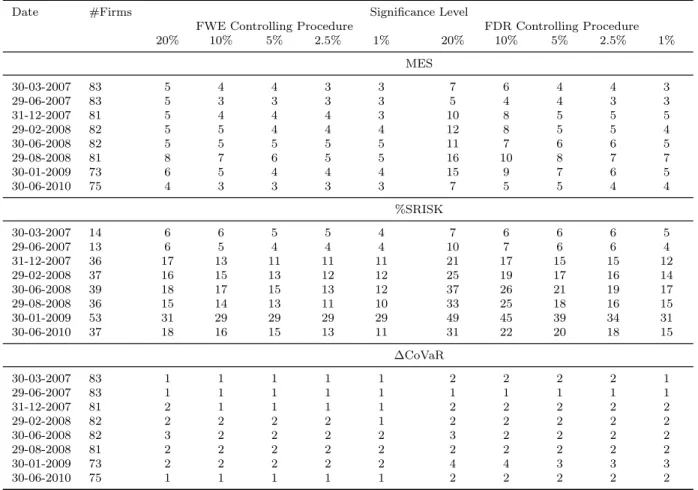
Risk Measure Inference
Texte intégral
Figure


Documents relatifs
scheme and three adapted from schemes used in non-European countries. We report the results from the application of these schemes as applied to Xanthomonas citri strains causing
ANSES – Consequences assessment – France – Method – Probability of occurrence – Qualitative risk assessment – Scientific
To reach this aim, four Indexes are developed; the ßrst one concerning the hazard source (the establishment), the second one the ßux (the vector of propagation of accident
In [2],[12],[18] and others, axioms and the behavior of univariate risk measures are presented, while [11] provides an axiomatic setting of risk measures in a spatial context.. In
Distribution-based risk measures with this convexity property are characterized in Section 7: As shown by Weber (2006) and Delbaen, Bellini, Bignozzi & Ziegel (2014), they
The main steps of the methods are presented in the paper: identification of the accepta- ble risk threshold based on a global approach of the territory vulnerability;
By combining a decomposition result for optional measures, and a dual representation of a convex risk measure for bounded c` adl`ag processes, we show that this framework provides
Our test is a Hausman-type test based on the distance between two estimators, of which one is consistent only under no endogeneity while the other is consistent regardless of

