HAL Id: hal-02865546
https://hal.archives-ouvertes.fr/hal-02865546
Preprint submitted on 11 Jun 2020
HAL is a multi-disciplinary open access archive for the deposit and dissemination of sci-entific research documents, whether they are pub-lished or not. The documents may come from teaching and research institutions in France or abroad, or from public or private research centers.
L’archive ouverte pluridisciplinaire HAL, est destinée au dépôt et à la diffusion de documents scientifiques de niveau recherche, publiés ou non, émanant des établissements d’enseignement et de recherche français ou étrangers, des laboratoires publics ou privés.
International Connectivity and the Digital Divide in
Sub-Saharan Africa
Joel Cariolle
To cite this version:
Joel Cariolle. International Connectivity and the Digital Divide in Sub-Saharan Africa. 2020. �hal-02865546�
fondation pour les études et recherches sur le développement international
LA FERDI EST UNE FOND
ATION REC ONNUE D ’UTILITÉ PUBLIQUE . ELLE ME T EN ŒUVRE A VEC L ’IDDRI L ’INITIA TIVE POUR LE DÉ VEL OPPEMENT E
T LA GOUVERNANCE MONDIALE (IDGM).
ELLE C
OORDONNE LE LABEX IDGM+ QUI L
’ASSOCIE A U CERDI E T À L ’IDDRI. CE TTE PUBLIC ATION A BÉNÉFICIÉ D ’UNE AIDE DE L ’É TA T FR ANC AIS GÉRÉE P AR L ’ANR A U TITRE DU PR OGR A MME «INVESTISSEMENT S D ’A VENIR» POR
TANT LA RÉFÉRENCE «ANR-10-LABX
-14-01».
International Connectivity and
the Digital Divide in
Sub-Saharan Africa
Joël Cariolle
Joël Cariolle, Research Officer, FERDI. joel.cariolle@ferdi.fr
Abstract
During the last decades, international connectivity has improved significantly with the worldwide deployment of some 400 fiber submarine cables (SMCs), transmitting more than 99% of international telecommunications. If sub-Saharan African (SSA) has long remained excluded from this interconnection process, the maritime infrastructure network has recently densified and spurred African connectivity catch-up. This paper estimates the impact of SMC deployment on the digital divide in an original sample of 49 SSA countries covering the period 1990-2014. Diff-in-diff (DID) estimations are conducted and highlight the particular contribution of SEACOM and EASSy cables, laid in 2009-2010, to Internet penetration in Eastern and Southern Africa. According to DID estimates these SMCs rollout has yielded a 3-5 percentage-point increase in internet penetration rates in this region compared to the rest of the continent. Triple-difference estimations emphasize conditional factors under which these cables have fostered Internet uptake: enlarged Internet bandwidth per users, lower broadband Internet tariffs, higher investment in the mobile network, improved terrestrial connectivity, and electricity access.
Key words: ICT, submarine cables, digital divide, Sub-Saharan Africa, infrastructure, connectivity. JEL Classification: F02, L96, O33, O18.
Dev
elopment Po
lic
ie
s
W
ork
ing Paper
264
March 2020“Sur quoi la fondera-t-il l’économie du monde qu’il veut
gouverner? Sera-ce sur le caprice de chaque particulier? Quelle
confusion! Sera-ce sur la justice? Il l’ignore.”
1. Introduction
According to the United Nations, the population of Africa is likely to increase from 1 billion inhabitants in 2018 to 2.4 billion in 2050, representing a quarter of the world’s population, with the 15- to 24-year-old population rising from 200 million to more than 700 million in 2050. It is on this continent that economic and social transformations induced by digital technology diffusion generates the highest expectations. Information and communication technologies (ICTs)1, more particularly Internet and mobile technologies such as mobile-money, mobile-banking, e-health, e-learning, and other digital innovations, are expected to play an increasing role in the African development process (Aker and Blumenstock, 2014). By contributing to the emergence and dissemination of innovations in trade, agriculture, education, health, financial services, transportation, and public administrations’ modernization (Aker & Mbiti, 2010; Andrianaivo & Kpodar, 2011; Aker and Blumenstock, 2014; World Bank, 2016; Aker, 2017; Hjort & Poulsen, 2019), ICTs have the potential to act as general-purpose technologies in the growth process (Bresnahan and Tajtenberg, 1995; Cardona et al, 2013).
However, in the subcontinent, the expected dividends of ICT dissemination are slow to materialize and to benefit the whole population (World Bank, 2016). These low ‘digital dividends’ are seen as the result of the telecom infrastructure deficit (Ndulu, 2006; Schumann & Kende, 2013; Buys et al, 2009; Bates, 2014) and the poor governance of the telecommunication sector (Howard & Mazaheri, 2009; Sutherland, 2014). Therefore, and despite the high penetration rate of mobile telephony in the continent, access to broadband in sub-Saharan Africa (SSA) primarily benefits the rich, the urban and the most educated (World Bank, 2016). A better understanding of key determinants of ICT adoption, in particular Internet use, is therefore of great concern to leverage growth, productivity and job creation in the subcontinent.
During the last decade, global connectivity has improved significantly with the worldwide deployment of more than 400 fiber submarine cables (SMCs) over the period 1990–2018, transmitting more than 99% of international telecommunications (Internet, phone calls, videos, text messages, diplomatic messages). However, SSA has remained relatively digitally isolated until 2009. Since then, the capacity for international telecommunications has quickly unfolded, facilitating access and reducing the cost of broadband Internet and mobile telephony. Today, almost all coastal African countries are directly connected to the global telecommunications network through SMCs.
By providing a more affordable and faster access to Internet and related mobile technologies, SMCs rollout is expected to improve productivity and innovation (Bertschek et al, 2013; Cardona et al, 2013; Cariolle et al, 2019; Paunov & Rollo, 2015, 2016), to foster job creation
1
The term ICT used along this paper encompasses the different types of platforms by which information and communications flow (mobile phones, smartphones, computers, tablets, radio, etc.), their multiple usages (communication, information dissemination or collection, financial transactions, etc.), and the various contents transmitted through them (calls, text-messages, emails, websites, e-money, videos, radio broadcasts, etc.). Based on this definition, the digital divide results from the low penetration of ICTs (platforms, usages, and contents) in the population.
(Cariolle et al, 2019; Hjort & Poulsen, 2019), to increase trade and foreign direct investments (Freund & Weinhold, 2004; Hjort & Poulsen, 2019), and to enhance governance and the quality of institutions (Andersen et al, 2011; Asongu & Nwachukwu, 2016). A study of the impact of SMC rollout on the digital divide in SSA is therefore an important step to apprehend the potential for and the main obstacles to the digitization of African economies. To our knowledge, such an empirical approach, focused on this critical connectivity infrastructure and applied to the subcontinent, is missing.
The economic literature has indeed widely focused on the consequences of ICTs diffusion2, especially mobile and Internet technologies, but studies that enlighten the conditions of their uptake, especially in Africa, are scanter. Micro or local-level empirical research has identified levers or obstacles to Internet or mobile technology adoption in the subcontinent. These determinants encompass the private network size (Bjorkegren, 2018), geographic constraints such as elevation (Buys et al, 2009), demographic and individual characteristics such as revenue, age, gender, education, or urbanity (Birba & Diagne, 2012), physical infrastructure proximity (Buys et al, 2009; Mothobi & Grzyboswki, 2017), and competition policy (Buys et al, 2009). Among international macro-level studies, Chinn and Fairlie (2007, 20210) highlight the importance of per capita income in explaining Internet and computer penetration in a sample of 161 developed and developing countries. In addition, they stress the role of access to electricity, human capital, and institutional quality in reducing the Internet divide. Wallsten (2005) and Howard and Mazaheri (2009) have also examined the contribution of the regulatory framework to ICT access, but to our knowledge, none of these studies has emphasized the importance of improved international connectivity. Yet, the quantity and quality of interconnections has been identified as a critical determinant of the demand for telecommunications services from the early works of Katz & Shapiro (1985) and Crémer et al (2000).
This paper offers new evidence on the consequence of improved international connectivity, resulting from SMC deployment, for Internet uptake in SSA. The empirical analysis is conducted in two steps. First, within fixed-effect estimation of the effect of the successive arrivals of SMCs along African coasts over 1990-2014 on Internet and mobile phone penetration is conducted. Estimates support that one additional SMC laid on African coast has yielded an average two percentage-point increase in Internet penetration rates, and that this effect is associated with the rollout of broadband maritime infrastructure. By contrast, mobile phone penetration is found to be rather unresponsive to the deployment of broadband infrastructure, as already pointed out by Aker and Mbiti (2010) and Mothobi & Grzyboswki (2017). Second, the concern for endogeneity in the timing and location of SMC rollout is addressed by narrowing the focus on the contribution of SEACOM and EASSy cables, deployed along Eastern and Southern African coasts in 2009-2010, using a Difference-in-differences (DID) approach. This wave of SMCs represents a relevant quasi-experiment because it has brought for the first time broadband Internet to a whole region, inducing an unprecedented increase in the capacity for international telecommunications at the regional level. According to DID estimations, the deployment of SEACOM/EASSy has yielded a 3-5 2
percentage point increase in Internet penetration rates compared to rest of the subcontinent, corresponding to almost a doubling in SSA’s average Internet penetration rate preceding the SEACOM/EASSy laying. Triple-difference estimations complete previous evidence by emphasizing conditional factors under which SMCs have boosted Internet penetration: enlarged Internet bandwidth per users, lower broadband Internet tariffs, larger investment in the mobile network, Internet exchange points deployment, and access to electricity.
The next section describes the institutional background of SMC deployment in SSA. The third section presents the baseline estimations results, while the fourth section exposes diff-in-diff estimations. The fifth section concludes.
2. Institutional background
This section offers an overview of the interplay between the expansion of international connectivity infrastructures in SSA and access to ICTs in the sub-continent.
2.1. International connectivity infrastructures and the digital divide
International connectivity is the first link of the Internet access value chain, and SMCs are the main international connectivity infrastructure (Carter et al, 2009). As presented in Figure 1, the laying of SMC infrastructures is the first step towards access to international telecommunications. The number of SMCs plugging countries into the world telecommunication network is expected to boost the digital economy by affecting the total bandwidth available to Internet users, the cost and tariff of Internet services, the competition environment, and a country’s Internet redundancy when cable outages occur. SMC rollout is also a catalyst for subsequent investments in backbone, middle-mile, and last-mile terrestrial telecommunications infrastructures by increasing scale economies (Schumann & Kende, 2013). In other words, the greater the number of SMCs for a given country (Weller & Woodcock, 2013; Schumann & Kende, 2013).
Without SMCs, a country has two solutions to get international connectivity: (i) buying expensive and limited Internet bandwidth from a SMC-connected neighbouring country (which requires being connected to that country through the landline infrastructure) or (ii) buying expensive, often slow, and limited Internet bandwidth from telecommunications satellites.
Figure 1. Infrastructures and international telecommunications access value chain
Source: adapted from Schumann and Kende (2013). SMC: Submarine cables. IXP: Internet Exchange Point.
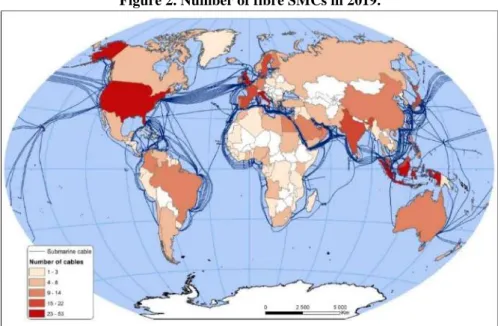
Figure 2 maps the number of SMCs by countries in 2019, and shows that SMC rollout in sub-Saharan Africa is still lagging behind other developing regions such as Asia and South America. Once SMCs are laid on the coast, the telecommunications network capacity and efficiency relies on the deployment terrestrial infrastructures. International comparisons on terrestrial deployment remain complex given the limited availability of exhaustive information. However, retrospective data on the worldwide deployment of Internet Exchange Points (IXPs), a critical terrestrial connectivity infrastructure, has been collected and stresses that SSA also falls behind the rest of the world in terms of terrestrial connectivity.3
Figure 2. Number of fibre SMCs in 2019.
Source: https://www.submarinecablemap.com/ (Telegeography).
3
Internet exchange points are indeed physical Internet hubs that permit the reduction of communication latency, by promoting direct interconnections between countries, and the saving of bandwidth through an efficient allocation of local, regional and international traffic. IXPs also allow the sharing of Internet and other communications traffic at low cost, which in turn reduces the cost of telecommunication services (Malecki, 2002; Weller & Woodcock, 2013). See the current worldwide deployment of IXPs mapped in Online Appendix B
2.2. The maritime telecommunication infrastructure deployment in sub-Saharan Africa
While SSA remained relatively digitally isolated from the rest of the world until the end of the 2000s, the SMC infrastructure has quickly unfolded. In 2019, SSA was connected to the world telecommunications network through 18 active multilateral SMCs (excluding bilateral SMCs), height being spread over the west coast, five over the east coast and five passing by the Gulf of Aden.4 Now, almost all coastal African countries are directly connected to the worldwide telecommunications network through SMCs. The expected benefits of such a deployment are very important for the subcontinent.
Graph 1 below relates the cumulative number of African countries connected to the world telecommunication network to their share of population using Internet. It shows that the exponential time evolution of Internet penetration tracks the growing cumulative number of African countries connected be the SMCs network. Graph 2 confirms this positive relationship by displaying the positive correlation of SMCs rollout with Internet penetration rates and with the telecommunications sector revenue. Yet, despite these remarkable progresses, less than 20% of the population had access to Internet in 2015. Beyond this graphical evidence, it necessary to further the comprehension of the contribution of SMC rollout to SSA’s digital divide reduction, through a multivariate empirical approach.
Graph 1. Infrastructure capacity and Internet penetration in Africa
Sources: ITU (2019) and https://www.submarinecablemap.com/ (Telegeography). Sample: 49 African countries.
4
West-coast cables: SAT3/SAFE (800 gigabits capacity), GLO-1 (2.5 terabits), ACE (5 terabits), MainOne (10 terabits), NCSCS (12.8 terabits), WACS (14.5 terabits), SAIL (32 terabits), and SACS (40 terabits). East-coast cables: SEAS (320 gigabits), TEAMs (1.2 terabits), LION 2 (1.3 terabits), EASSy (10 terabits), SEACOM (12 terabits). Eden Gulf cables: Falcon (2.56 terabits), SEAMEWE 5 (24 terabits), AAE-1 (40 terabits), EIG (3.8 terabits), MENA (5.8 terabits).
Graph 2. SMC deployment and the telecom sector, sub-Saharan Africa, 1990–2014.
Sources: ITU (2019) and https://www.submarinecablemap.com/ (Telegeography). Sample: 49 African countries.
3. Baseline estimation framework 3.1. Empirical model
The telecommunications sector has strong network externalities. In fact, the benefits derived from ICT adoption increase with the telecommunications’ network size and the quality of interconnections (Katz & Shapiro, 1985; Crémer et al, 2000). Our empirical analysis of the effect of SMC deployment on the digital divide in SSA builds on this feature to estimate a demand for ICTs, which is an increasing function of connectivity:
(1)
The demand for ICT, ICTi,t, is measured by a variable of ICT penetration in country i at time
t. Connectivityi,t reflects the quantity and/or the quality of interconnections, Xit are other ICT-demand determinants such as income, demography, educational attainment, urbanization, or public service provision (see sub-section 3.2). is the error term. Considering the SMC network as the first element of the telecommunications value chain, our baseline empirical framework consists in estimating the following reduced-form equation:
(2)
With , (3)
And , , (4)
Where the country’s connectivity (Connectivityi,t) depends on the country’s capacity to carry
international telecommunications through SMCs (SMCi,t), through the terrestrial
infrastructure (TIi,t), and on a random shock (ωit) affecting the quality of interconnections.5
As pointed out by Röller and Waverman (2001) or Akerman et al (2015), controlling for time
5
Such as power or telecommunication infrastructure outages, web attacks, unanticipated quality degradation strategies from backbone competitors, etc, which can affect telecommunications network’s speed, coverage, and stability.
and country fixed-effects is critical to lower the concern for omitted variable bias. Country fixed-effects, di, indeed control for supply and demand unobserved time-constant or slow-changing determinants of ICT diffusion, such as geographic determinants or unobserved demographic changes. Time fixed-effects, dt, allow controlling for timely unobservable events, common to all African countries, that could have influenced the infrastructure rollout over the continent: such as the financial crisis, the world excess liquidity that followed, or a change in a SMC technology. A linear time trend t is also included following Röller & Waverman (2001).
3.2. Data
We estimate equation (2) using an original sample of 49 African countries covering the period 1990–2014. Dependent (ICTit), interest (SMCit) and control variables (Xit) are described below. Appendix A.1 presents the sample composition, while Appendixes A.2 and A.3 present variables’ descriptive statistics and cross-correlations. Online Appendix A reports variables’ sources and definition.
3.2.1. Dependent variables (ICTi,t)
We use alternatively two variables of ICT penetration: the share of the population using the Internet, and the number of mobile phone subscriptions per 100 people. The Internet penetration variable is probably the outcome variable mostly affected by the arrival of SMCs, compared to mobile phone diffusion that has leapfrogged the poor broadband infrastructure coverage in the subcontinent (Aker & Mbiti, 2010; Mothobi & Grzybowki, 2017). Moreover, the share of the population using Internet encompasses various modalities of Internet use in Africa, from personal computers, Internet cafés to mobile phones. Using these two indicators of ICT penetration are nevertheless complementary, since Internet penetration in SSA relies heavily on mobile phone adoption rather than computer ownership (Aker & Mbiti, 2010). In fact, in 2016, the average proportion of African households owning a computer was approximately 12.5%, and less than 5% in landlocked countries such as Mali, Chad, Burkina Faso or Niger (ITU, 2019). Other Internet penetration variables such as the share of households with a fixed Internet connection seems less meaningful in the SSA context, because it depends on the landline infrastructure coverage and often on household’s computers ownership, widespread in industrialized countries (Caselli & Coleman, 2001) but lacking in the subcontinent.
3.2.2. Interest variable: SMC connectivity (SMCit)
We consider that a country’s international connectivity (SMCit) depends on being or not connected to the worldwide telecommunications network through submarine cables. In the first part of the empirical analysis, the main interest variable is the number of SMCs laid at a given point of time in a given country. In the second part (DID analysis), we focus on a specific wave of SMCs, the SEACOM/EASSy cables, that has induced a remarkable progress in East and Southern-East African countries’ connectivity.
3.2.3. Control variables (Xi,t, TIit)
First, we control for the following socio-economic and demographic factors driving the demand for ICTs, emphasized by the literature (Röller & Waverman, 2001; Chinn & Fairlie, 2007, 2010; Howard & Mazaheri, 2009; Birba & Diagne, 2013; Akerman et al, 2015): the (log) GDP per capita, the size of public expenditure in the GDP, the gross secondary enrollment rate, the (log) population size, the share of the population between 15 and 64 years-old, and the share of urban population. This set of controls is justified by the fact that a richer, larger, adult, educated and urban population is more likely to use ICTs. Larger public expenditures can also be positively associated with telecommunications outcomes when public resources are allocated to infrastructure deployment and maintenance, or negatively if the public sector encompasses oversized and inefficient public telecommunications operators. Second, considering that democratic governments are more likely to promote policies that facilitate access and use of ICTs, we also control the degree of democratic freedom (Milner, 2006). Third, we control for the share of the population with access to electricity, since the quality and coverage of the power infrastructure is a critical for ICT adoption (Chinn & Fairlie, 2007, 2010). Since this variable is sporadically documented for African countries, missing data are replaced by five-year moving averages.6 Last, another important determinant of the nexus between ICT diffusion and connectivity is the terrestrial network coverage (Muto & Yamano, 2009; Mothobi & Grzyboswki, 2017). If retrospective data on the terrestrial infrastructure deployment (TIit) is missing in Africa, time-series on the number of Internet exchange points by country are available and therefore included in regressions.
3.3. Baseline results
Equation (2) is estimated using a panel of 49 African countries over the period 1990-2014.7 The time trend t is alternatively included to remove an eventual deterministic trend in the residual (Röller & Waverman, 2001) related to, for instance, technological imrovements or the progressive familiarization with digital technologies. Results are presented in Table 1. SMC and IXP variables are, as expected, positively correlated with Internet penetration and mobile phone penetration. Having a closer look at the SMC-Internet nexus, estimations support that the estimated relationship is robust to the inclusion of the time trend and control variables. According to estimates reported in columns (4), the deployment of one additional SMC is associated with a 2.4 percentage point increase in the share of the population using Internet. The relationship using the mobile penetration variable, however, is no longer significant in the usual confidence level once controls are introduced in the econometric specification.
In Table 2, Equation (2) is estimated over two different sub-periods corresponding to separate submarine cable waves: the 1990-2007 period, associated with a relative stagnation of Internet bandwidth capacity, and the 2007-2014 period, which witnessed the emergence of broadband Internet and experienced a remarkable progression in Internet bandwidth per user (see Graph
6
When a five-year average cannot be calculated, we use the previous five-year average value.
7
Estimating the effect of the successive arrivals of SMCs on ICT penetration in African countries, as specified in equation (2), comes down to estimating a general Diff-in-Diff equation where countries are treated at different points of time.
3, hereafter)8. Estimates show that, while the first period of SMC rollout has experienced a greater diffusion of mobile phone technology, the second period of SMC deployment correlates with the expansion of Internet adoption. Therefore, this evidence confirm that the rapid diffusion of mobile phone penetration was prior to the recent broadband SMC deployment (Aker & Mbiti, 2010; Mothobi & Grzybowski, 2017), which in turn, seems to have spurred the Internet uptake in the early 2010’s.
However, the timing and the number of SMCs may be related to country-level policy factors that preclude from the causal interpretation of estimated coefficients. The next section addresses this issue by estimating within a Diff-in-Diff framework the impact of a specific wave of regional SMCs that brought broadband Internet to an entire region, and may act as an exogenous treatment for African countries.
Table 1. Baseline estimations (1/2)
(1) (2) (3) (4) (5) (6) (7) (8)
Dep var. % pop using the Internet # mobile subscriptions / 100 people
# SMCs 5.223*** 3.591*** 2.384*** 2.384*** 22.01*** 9.867*** 3.604 3.604 (0.664) (0.765) (0.737) (0.737) (2.536) (2.432) (2.702) (2.702) # IXPs 2.147** 2.147** 5.698* 5.698* (0.994) (0.994) (3.359) (3.359) Ln GDP/cap 2.905* 2.905* 2.345 2.345 (1.580) (1.580) (2.673) (2.673) Public Exp. -0.0015 -0.0015 0.0017 0.0017 (0.005) (0.005) (0.009) (0.009) Ln pop. size 3.781 3.781 10.13 10.13 (4.557) (4.557) (12.82) (12.82) % of 15–64yrs 1.286** 1.286** 3.558*** 3.558*** (0.521) (0.521) (1.116) (1.116) % urban pop 0.0388 0.0388 1.021 1.021 (0.264) (0.264) (0.951) (0.951) Democracy -0.0792 -0.0792 -0.847 -0.847 (0.256) (0.256) (0.702) (0.702) 2ary Education -0.112 -0.112 -0.441 -0.441 (0.107) (0.107) (0.302) (0.302) Elect. access -0.143 -0.143 0.101 0.101 (0.118) (0.118) (0.370) (0.370) Time trend 0.370*** 0.243 2.289*** 1.894*** (0.0832) (0.170) (0.243) (0.510)
Country FE Yes Yes Yes Yes Yes Yes Yes Yes
Time FE Yes Yes Yes Yes Yes Yes Yes Yes
Time trend No Yes No Yes No Yes No Yes
N 982 982 733 733 1091 1091 903 903
# Countries 49 49 45 45 49 49 45 45
R2 0.435 0.531 0.639 0.639 0.314 0.597 0.816 0.816
White-robust standard errors in parentheses. * p < 0.1, ** p < 0.05, *** p < 0.01.
8
Table 2. Baseline estimations (2/2)
(1) (2) (3) (4)
1990-2007 2007-2014 1990-2007 2007-2014
% pop using the Internet # mobile subscriptions / 100 people # SMCs 0.979 2.479*** 6.440* -1.125 (0.653) (0.696) (3.432) (1.273) # IXPs 0.842* 1.810 4.678** 1.949 (0.458) (2.615) (2.270) (4.129) Ln GDP/cap 1.132 -3.776 2.594 -19.75 (0.823) (8.077) (1.916) (17.20) Public Expenditures 0.00220 -0.0149 0.00434 -0.0141 (0.00253) (0.0108) (0.00510) (0.0270) Ln population size 2.708 8.598 -8.031 5.675 (3.565) (15.25) (10.41) (33.43) % of 15–64yrs 0.969* 2.070 2.843** 1.240 (0.488) (1.612) (1.129) (1.386) % urban pop -0.0744 0.727 0.200 4.165* (0.222) (0.807) (0.731) (2.123) Democracy -0.170 1.032+ -0.717* 0.294 (0.172) (0.679) (0.421) (1.304) 2ary Education -0.0757 -0.0927 -0.269 -0.458+ (0.0946) (0.154) (0.274) (0.308) Electricity access -0.116 - -0.0364 - (0.0948) - (0.241) - Time trend 0.210* 0.397 1.247*** 7.521*** (0.124) (0.745) (0.404) (1.294)
Country fixed effect Yes Yes Yes Yes
Time fixed effect Yes Yes Yes Yes
Time trend Yes Yes Yes Yes
N 560 216 727 219
# Countries 45 45 45 45
R2 0.490 0.570 0.663 0.848
White-robust standard errors in parentheses. * p < 0.1, ** p < 0.05, *** p < 0.01. The access to electricity variable is dropped in columns (2) and (4) because of multi-collinearity, probably with country fixed effects.
4. Difference-in-Differences (DID) estimation framework
In this section, we adopt a DID estimation framework (Card & Krueger, 1994; Heckman et al, 1998) to study the impact of regional SMC arrivals on Internet penetration in the subcontinent. We consider that the deployment of regional SMCs has induced a dramatic improvement in recipient countries’ connectivity, thereby fostering ICTs uptake in the population (Katz & Shapiro, 1985; Crémer et al, 2000).
4.1. DID specification
We are interested in SMCs that yielded a subsequent increase in countries’ international connectivity. Therefore, among the different waves of SMCs laid in SSA (Graph 3), only cables deployed regionally, that is connecting at least four sub-Saharan African countries together, are considered. Moreover, SMCs are often deployed over a whole region because of the small size of SSA markets and because of the high fixed-cost of this infrastructure, requiring public and private telecom operators and investors from various neighboring countries to share them (Jensen, 2006). We therefore assume that their laying is less influenced by national contexts or policies than regional-level considerations. The following regional cables are considered:
1. The SAT3, WASC, SAFE cables, deployed in 2002, connecting 10 countries: South Africa, Angola, Gabon, Cameroon, Nigeria, Benin, Ghana, Ivory Coast, Senegal and Mauritius to Asia and Europe.
2. The SEACOM and EASSy cables, deployed over the East coast in 2009-2010, connecting 16 countries: South Africa, Mauritius9, Madagascar, Comoros, Tanzania, Kenya, Botswana, Mozambique, Eritrea, Uganda, Ethiopia, Somalia, Rwanda, Sudan, Mauritius, and Djibouti to Asia and the Middle-East.
3. The WACS and ACE cables, deployed in 2012, connecting 16 countries: South Africa, Namibia, Angola, the DRC, the Congo, Cameroon, Nigeria, Togo, Ghana, Sierra Leone, Ivory Coast, Cap Verde, Liberia, Benin, Guinea, Gambia, and Mauritania to Europe. Interestingly, graphical evidence lets us believe that the SEACOM/EASSy cables deployment has yielded an exogenous increase in recipient countries’ connectivity. First, Figure 3 shows that SEACOM/EASSy have been laid all along East and Southern-East African littoral, with no exceptions among coastal countries, and has therefore considerably densified the network of interconnected countries in this region. Second, Graph 3 indicates that the average Internet penetration rate’s evolution has accelerated in the wake of SEACOM and EASSy laying (Figure 3). Third, the right-hand side graph in Graph 3 stresses that this acceleration coincides with an unprecedented shift in average Internet bandwidth per user, thereby, in the cable’s capacity to carry international telecommunications. In fact, the end of the 2000’s is associated with the first rollouts of cables bringing broadband Internet to the subcontinent. We therefore focus the DID analysis on this specific wave of SMCs.
9
We consider Mauritius as connected to the SEACOM/EASSy cable wave because it has a direct cable connection to South Africa and Madagascar in 2009.
Figure 3. SEACOM//EASSy rollout in SSA.
Sources: ITU (2019) and https://www.submarinecablemap.com/ (Telegeography).
Graph 3. SMC arrivals and Internet access in SSA.
Internet penetration Internet bandwidth per user
Source: Sources: ITU (2019) and https://www.submarinecablemap.com/ (Telegeography). Sample: 49 African countries.
Long-dashed vertical lines: arrival of a transcontinental regional SMC, connecting at least four African countries. Short-dashed vertical lines: arrival of a transcontinental local SMC, connecting less than four African countries.
The SEACOM/EASSy cable wave is hence considered as the main treatment, which gives the following equation to be estimated:
(5)
Equation (5) is the basic DID equation. is the treatment dummy variable indicating
whether country i is connected to the global telecommunication network by the SEACOM/EASSy wave at time t and after, that is, starting 2010. is a dummy a variable controlling for the period following the regional SMC wave laying, while a dummy a variable controlling for time-invariant characteristics of SMC-host countries. Wi,t is a vector of control variables, adding to previous controls (Xi,t) a variable equal to the number of other SMCs hosted in control group’s countries, zero otherwise.10 Assuming that the error term φit is independent from the treatment, i.e. , the parameter γ1 is the coefficient identifying the causal effect of the treatment on ICT variables. This causal effect is estimated by calculating the DID equal to the change in mean ICT penetration rates for the treatment group minus the change in mean ICT penetration rates for the control group. In equation (6), country and time dummies, di and dt, respectively control for unobserved time-invariant country unobserved characteristics and common time-variant unobserved characteristics, including and .
4.2. SEACOM/EASSy arrival and the parallel trend assumption
One critical assumption of the DID estimator is the parallel trend assumption, which requires outcome variables to follow parallel trends in the absence of treatment, in our case, SMC arrivals. Without information on what would have happened without treatment, one common practice is to check the existence of a parallel trend before the treatment. Graph 4 plots the co-evolution of these outcomes for treatment and control groups related to SEACOM and EASSy cables rollout in 2009 and 2010. These cables are indeed associated with a marked change in Internet penetration growth rates, as presumed previously in Graph 3. A visual inspection of below graphs supports that their deployment seem to be a relevant experiment for a DID analysis, as i) Internet penetration rates of treated and non-treated groups exhibit not only parallel but also confounded pre-treatment trends, and ii) these trends diverge after the treatment, especially after the SEACOM laying (Graph 5).
By contrast, these waves of SMCs do not seem to have affected the penetration of mobile phones, suggesting again that mobile phone adoption in SSA is not related to broadband infrastructures. Parallel trend examination considering the SEACOM cable as one single treatment in Graph 5 supports an even stronger divergence between treated and untreated after its laying.11 However, the successive deployment of SEACOM and the EASSy in the same area pushes us to consider them as one single treatment, as they may have a confounding effect on ICT penetration’s evolution.12
To go further, Graph 6 plots the evolution of the bandwidth per user in treated and non-treated countries and shows a parallel and confounded trend prior to treatment and a remarkable
10
In fact, it is necessary to control for the telecommunication infrastructure existing in the control in order to properly estimating the impact of this specific SMC wave.
11
Compared to EASSy, the SEACOM cable does not serve Somalia, Madagascar, and Comoros.
12
The co-evolutions of internet and mobile penetration rates related to the SAT3/WASC/SAFE wave in 2002, and to the WACS/ACE wave in 2012, also reported in Appendix B.1 and B.2, do not support the parallel trend assumption, suggesting they would not represent a relevant experiment for a DID analysis.
divergence at the time of the laying of these cables.13 This suggests that improved bandwidth capacity probably explains this shift in Internet penetration. This parallel trend analysis therefore reinforce the exogeneity presumption on the treatment.
Graph 4. Trend comparison of ICT penetration before and after SEACOM/EASSy laying.
Source: author. Raw data from ITU database.
Graph 5. Trend comparison of ICT penetration before and after SEACOM laying.
Source: author. Raw data from ITU database.
13
Djibouti and South Africa are excluded from the treated group because both countries represent important hubs for SMCs and have experienced an important increase in Internet bandwidth in 2008. These countries are also excluded from the estimation sample in robustness analysis to avoid sample selection bias.
Graph 6. Trend comparison of Internet bandwidth per user before and after SEACOM/EASSy laying.
Source: author. Raw data from ITU database. Djibouti and South Africa excluded from the control group.
4.3. DID estimates 4.3.1 Baseline estimates
Within fixed-effect estimations of equation (6) are run using an original sample of 45 SSA countries (sample A), over different periods:
2002-2012: the baseline period, corresponding to the time-span between SAT3/SAFE and WACS/ACE cables deployment (see Graph 3).
2007-2012: corresponding to the period prior to WACS/ACE rollout, associated with a marked increase in available bandwidth per user, as highlighted in Graph 3 and Table 2.
1990-2014: to check the sensitivity of estimates to an extended estimation period, marked by other SMCs laying.
We apply the within fixed-effect estimator to equation (6) alternatively including Xit, Wit, and
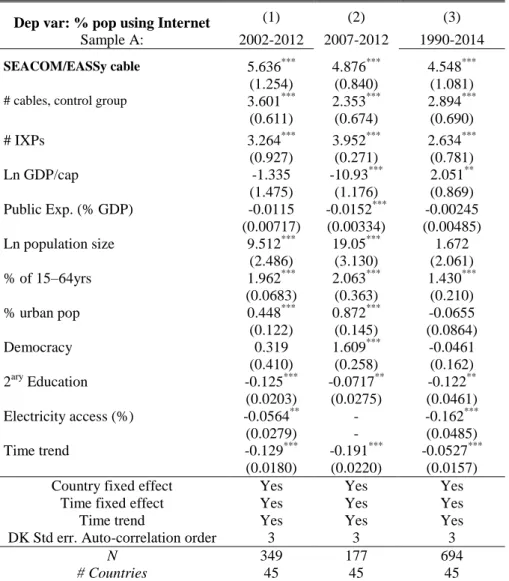
Witplus the time trend t as control variables. Estimates are reported in Table 3a support that the SEACOM/EASSy cables have had a strong, positive and significant impact on Internet penetration rates. First, estimations conducted over the 2002-2012 period (columns (1) to (3)) show that the SEACOM/EASSy deployment led to a 1%-significant 5-6 percentage point increase in the share of the population using the Internet. Estimated coefficients lie within the same range whether the estimation period is restricted to 2007-2012 or extended to the period 1990-2014. They are also robust when controlling for the number of SMCs hosted in countries from the control groups, or including a time trend in the econometric specification. These baseline results support that the arrival of 2009-2010 SMCs has almost doubled the penetration of Internet in the subcontinent, taking the pre-treatment Internet penetration rate as reference (Figure 2).
However, estimated standard errors remain possibly subject to bias induced by autocorrelation (Bertrand et al, 2014). In Table 3b, we report Inoue and Solon (2006) tests for auto-correlated disturbances, suggesting the existence of third-order serial correlation. We therefore re-estimate equation (6) computing Driscoll-Kraay (DK) standard errors, robust to 3-order
auto-correlation, to heteroscedasticity and to cross-sectional correlation. Results are presented in Table 3c, and confirm the robustness of estimated relationships.14 However, they remain subject to a possible sample selection bias that we try to address in the next section.
Table 3a. DID estimations.
Dep var: % pop using Internet (1) (2) (3) (4) (5)
Sample A: 2002-2012 2007-2012 1990-2014
SEACOM/EASSy cable 4.891** 4.891** 5.636*** 4.876*** 4.548*
(2.149) (2.149) (2.047) (1.752) (2.391)
# cables, control group 3.601** 2.353* 2.894**
(1.460) (1.328) (1.117) # IXPs 4.226* 4.226* 3.264* 3.952 2.634** (2.373) (2.373) (1.694) (3.477) (1.004) Ln GDP/cap 1.149 1.149 -1.335 -10.93 2.051+ (4.839) (4.839) (4.799) (9.271) (1.351) Public Expenditures (% GDP) -0.0112 -0.0112 -0.0115 -0.0152 -0.00245 (0.008) (0.008) (0.008) (0.0116) (0.006) Ln population size 16.69 16.69 9.512 19.05 1.672 (11.85) (11.85) (10.84) (14.16) (4.485) % of 15–64yrs 1.708* 1.708* 1.962** 2.063 1.430*** (0.958) (0.958) (0.929) (1.629) (0.506) % urban pop 0.798+ 0.798+ 0.448 0.872 -0.0655 (0.499) (0.499) (0.513) (0.911) (0.277) Democracy 0.402 0.402 0.319 1.609+ -0.0461 (0.653) (0.653) (0.657) (0.979) (0.266) 2ary Education -0.0739 -0.0739 -0.125 -0.0717 -0.122 (0.139) (0.139) (0.124) (0.153) (0.110) Electricity access (%) -0.0458 -0.0458 -0.0564 - -0.162 (0.110) (0.110) (0.108) - (0.127) Time trend 0.128 0.212 0.216 0.286* (0.452) (0.445) (0.683) (0.169)
Country fixed effect Yes Yes Yes Yes Yes
Time fixed effect Yes Yes Yes Yes Yes
Time trend No Yes Yes Yes Yes
N 349 349 349 218 694
# Countries 45 45 45 45 45
R2 0.598 0.598 0.634 0.625 0.629
White robust standard errors in parentheses. * p < 0.1, ** p < 0.05, *** p < 0.01. The access to electricity variable is dropped in columns (2) and (4) probably because of collinearity with country fixed effects.
Table 3b. Inoue and Solon (2006) LM-test on residuals.
H0: No auto-correlation of any order.
IS-stat p-value N Max T
Ha: Auto-correlation up to order 1. 17.88 0.013 45 9
Ha: Auto-correlation up to order 2 23.67 0.034 45 9
Ha: Auto-correlation up to order 3 28.94 0.049 45 9
Ha: Auto-correlation up to order 4 29.74 0.157 45 9
14
We report in Appendix C within-FE estimates with Driscoll and Kraay (1998) standard errors robust to first and second-order serial-correlation.
Table 3c. DID estimations, DK autocorrelation-robust standard-errors.
Dep var: % pop using Internet (1) (2) (3)
Sample A: 2002-2012 2007-2012 1990-2014
SEACOM/EASSy cable 5.636*** 4.876*** 4.548***
(1.254) (0.840) (1.081)
# cables, control group 3.601*** 2.353*** 2.894***
(0.611) (0.674) (0.690) # IXPs 3.264*** 3.952*** 2.634*** (0.927) (0.271) (0.781) Ln GDP/cap -1.335 -10.93*** 2.051** (1.475) (1.176) (0.869) Public Exp. (% GDP) -0.0115 -0.0152*** -0.00245 (0.00717) (0.00334) (0.00485) Ln population size 9.512*** 19.05*** 1.672 (2.486) (3.130) (2.061) % of 15–64yrs 1.962*** 2.063*** 1.430*** (0.0683) (0.363) (0.210) % urban pop 0.448*** 0.872*** -0.0655 (0.122) (0.145) (0.0864) Democracy 0.319 1.609*** -0.0461 (0.410) (0.258) (0.162) 2ary Education -0.125*** -0.0717** -0.122** (0.0203) (0.0275) (0.0461) Electricity access (%) -0.0564** - -0.162*** (0.0279) - (0.0485) Time trend -0.129*** -0.191*** -0.0527*** (0.0180) (0.0220) (0.0157)
Country fixed effect Yes Yes Yes
Time fixed effect Yes Yes Yes
Time trend Yes Yes Yes
DK Std err. Auto-correlation order 3 3 3
N 349 177 694
# Countries 45 45 45
Driscoll-Kray standard errors, robust to heteroscedasticity, cross-sectional correlation, and autocorrelation are in parentheses. * p < 0.1, ** p < 0.05, *** p < 0.01. The access to electricity variable in column (2) and the constant variable are dropped because of collinearity.
4.3.2. The sample selection concern
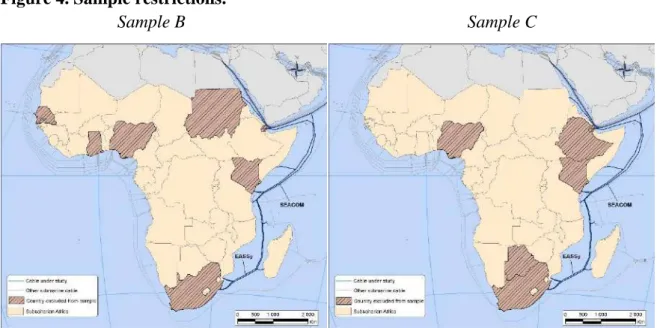
If the treatment’s exogeneity is supported by the parallel trend analysis (Graphs 4, 5 and 6), we nevertheless proceed to a range of sample restrictions meant to address a possible sample selection bias caused by policy-related factors. A first way to address this bias is to exclude from the sample all coastal African countries that have been, for some geopolitical or policy matters, the recipient of at least one non-regional SMC, i.e. a SMC serving less than four countries. This restriction leads to the exclusion of South Africa, Djibouti, Senegal, Ghana, Nigeria, Sudan, and Kenya from the sample (see Figure 4, sample B) which hosted SEAMEWE-Atlantis-SAS1-SAS2-2-EIG-FALCON-Glo1-Maineone cables.
A second source of sample selection is the emerging nature of some African telecom markets, which may influence telecommunications operators’ decision to deploy SMC in specific countries rather than others. To address this possibility, emerging telecommunications markets, identified as countries with a large a population, and/or where the middle class were
representing more than 25% of the population in 2010 (AfdB, 2011)15, are excluded from the sample (Figure 4, sample C). Excluded telecom markets are Kenya, South Africa, Ethiopia, Eritrea, Nigeria, and Botswana. Mauritius is also excluded from sample C because its low tax system may make this country attractive for telecommunications infrastructure investments. Third, landlocked countries’ international connectivity depends on cross-border connections with neighboring coastal countries hosting SMCs. As a result, the non-treatment might act in a different way in these countries, compared to their coastal counterpart. In addition, SEACOM/EASSy deployment map (Figure 3) shows that some landlocked countries like Uganda, Botswana or Rwanda have been connected to these cables, while others like Zimbabwe, South-Sudan, Zambia or Malawi have not. This non-treatment could be related to policy matters, so we re-run estimations excluding landlocked countries (Sample D).
Figure 4. Sample restrictions.
Sample B Sample C
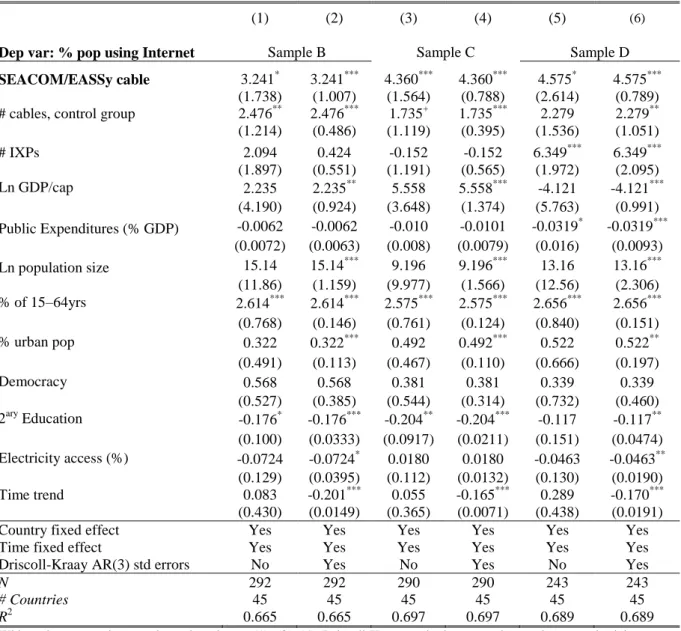
Estimations of equation (6) are run on these subsamples over the 2002-2012 period, using Wit as control variables, and alternatively computing White-robust or DK standard errors. Results are reported in Table 4. First, estimated effects from sample B are softer but remain significant in a 1%-confidence level when autocorrelation-robust standard errors are computed (10% significant with White-robust standard errors). In fact, estimates in columns (1) and (2) point that EASSy and SEACOM arrivals have increased by 3% internet penetration rates in treated countries. Second, estimations conducted without emerging markets (Sample C) confirm the positive and 1%-significant effect of SEACOM/EASSy cables on Internet penetration. Third, the impact of SMC laying on coastal countries (columns (5) and (6)) is also robust and 1% significant when DK standard errors are computed (10%-significant with White-robust standard errors). Overall, estimations stay robust to these sample restrictions, and support that the arrival of SMCs in 2009-2010 has increased by a 3-to-5 percentage-points the penetration of Internet in the sub-continent. However, estimations do not tell much about the mechanisms through which cables unleashed the potential for ICT
15
uptake by the end of the 2000’s. In the next section, we attempt to provide additional evidence on possible transmission channels of previous estimated relationships.
Table 4. DID estimations with sample restrictions.
(1) (2) (3) (4) (5) (6)
Dep var: % pop using Internet Sample B Sample C Sample D
SEACOM/EASSy cable 3.241* 3.241*** 4.360*** 4.360*** 4.575* 4.575***
(1.738) (1.007) (1.564) (0.788) (2.614) (0.789)
# cables, control group 2.476** 2.476*** 1.735+ 1.735*** 2.279 2.279**
(1.214) (0.486) (1.119) (0.395) (1.536) (1.051) # IXPs 2.094 0.424 -0.152 -0.152 6.349*** 6.349*** (1.897) (0.551) (1.191) (0.565) (1.972) (2.095) Ln GDP/cap 2.235 2.235** 5.558 5.558*** -4.121 -4.121*** (4.190) (0.924) (3.648) (1.374) (5.763) (0.991) Public Expenditures (% GDP) -0.0062 -0.0062 -0.010 -0.0101 -0.0319* -0.0319*** (0.0072) (0.0063) (0.008) (0.0079) (0.016) (0.0093) Ln population size 15.14 15.14*** 9.196 9.196*** 13.16 13.16*** (11.86) (1.159) (9.977) (1.566) (12.56) (2.306) % of 15–64yrs 2.614*** 2.614*** 2.575*** 2.575*** 2.656*** 2.656*** (0.768) (0.146) (0.761) (0.124) (0.840) (0.151) % urban pop 0.322 0.322*** 0.492 0.492*** 0.522 0.522** (0.491) (0.113) (0.467) (0.110) (0.666) (0.197) Democracy 0.568 0.568 0.381 0.381 0.339 0.339 (0.527) (0.385) (0.544) (0.314) (0.732) (0.460) 2ary Education -0.176* -0.176*** -0.204** -0.204*** -0.117 -0.117** (0.100) (0.0333) (0.0917) (0.0211) (0.151) (0.0474) Electricity access (%) -0.0724 -0.0724* 0.0180 0.0180 -0.0463 -0.0463** (0.129) (0.0395) (0.112) (0.0132) (0.130) (0.0190) Time trend 0.083 -0.201*** 0.055 -0.165*** 0.289 -0.170*** (0.430) (0.0149) (0.365) (0.0071) (0.438) (0.0191)
Country fixed effect Yes Yes Yes Yes Yes Yes
Time fixed effect Yes Yes Yes Yes Yes Yes
Driscoll-Kraay AR(3) std errors No Yes No Yes No Yes
N 292 292 290 290 243 243
# Countries 45 45 45 45 45 45
R2 0.665 0.665 0.697 0.697 0.689 0.689
White robust errors in parentheses in columns (1), (3), (5). Driscoll-Kray standard errors, robust to heteroscedasticity, cross-sectional correlation, and autocorrelation are in parentheses in columns (2), (4), and (6). * p < 0.1, ** p < 0.05, *** p < 0.01.
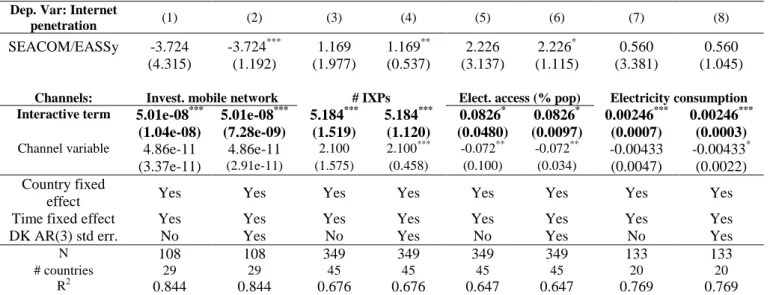
4.3.3. Transmission channels: triple differences estimations
In this subsection, we try identify transmission channels that explain that condition the positive effect of SMCs arrival on Internet penetration. For this purpose, we recalibrate the baseline estimation equation (6) by adding an interaction term consisting in multiplying the SEACOM/EASSy treatment variable ( ) with the presumed transmission channel ( ):
(7)
With ρ3, the parameter of interest. We identify three main channels, measured by seven interactive variables ( ), through which SMCs may affect Internet penetration rates.
The first transmission channel highlights the importance of obstacles to Internet accessibility, induced by limited Internet capacity and speed, the telecommunications network instability, and Internet unaffordability. Internet capacity and speed is measured by the international bandwidth per Internet user (in Mbit/s). The network instability is measured by the annual number of faults per 100 fixed phone lines. Internet affordability is measured by the price of a monthly broadband subscription charge (in logarithmic, USD. The second channel emphasizes the role of terrestrial infrastructure development. This channel is proxied by the annual investment in the mobile network (in USD), and the number of IXPs by country (already used as control variable in previous estimations). The third channel is related to electricity access, which is a pre-condition for ICT adoption. It is measured by two separate variables: the share of the population with access to electricity (already used as control variable in previous estimations), and the electric power consumption per capita (in Kwh). Results are reported in Tables 5a and 5b. First, regarding the obstacles to Internet accessibility, estimates support that enlarged bandwidth per Internet user is a critical, 1% significant, channel by which SMCs foster Internet penetration (Table 5a, column (1)). This result therefore confirms the mediating role played by the shift in Internet bandwidth, presumed in previous subsections. Estimates in columns (5) and (6) also support that lower Internet tariffs increases the positive effect of SEACOM/EASSy deployment on Internet penetration. They stress that if access to Internet was free (i.e. the broadband Internet tariff variable set to 0), SEACOM/EASSy rollout would have induced a large increase of 8-percentage points in Internet penetration rates. Second, estimates in columns (1) to (8) in Table 5b support that the benefits of SMC are conditional on terrestrial infrastructure development and access to electricity. They stress that without investments in the mobile network, the effect of SMCs on Internet adoption would be negative, possibly because of the absence of scale economies and the high fixed-costs passed on telecommunication tariffs (columns (1) and (2)). Estimates in columns (3) and (4) stress that without IXP rollout, the positive effect of SMCs would be limited to a one-percentage point increase in Internet penetration (column (5)). Last, results in columns (5) to (8) also highlight the mediating effect of electricity coverage (column (6)) and electricity consumption (column (7)). Of course, this bunch of evidence has to be taken with caution, given the large sample attrition resulting from the inclusion of some estimated interaction terms. Nevertheless, this analysis provides interesting insights into the contextual factors that accentuate or dampen the positive effect of SMC rollout on digital divide reduction.
Table 5a. SMCs’ transmission channels (1/2): interconnections quality.
Dep. Var: Internet penetration (1) (2) (3) (4) (5) (6)
SEACOM/EASSy 3.342* 3.342*** 5.284* 5.284*** 8.956** 8.956***
(1.700) (0.763) (2.823) (1.898) (3.843) (1.541)
Channels: Bandwidth /user # faults/100 phone lines Fixed BB monthly sub.
Interactive term 0.00009*** 0.00009*** 0.00307 0.00307 -1.270* -1.270***
(0.00002) (0.00002) (0.114) (0.0403) (0.711) (0.224)
Channel variable 4.09e-06 4.09e-06 -0.0428 -0.0428*** -0.0159 -0.0159
(6.25e-06) (4.09e-06) (0.0397) (0.0149) (0.614) (0.164)
Country fixed effect Yes Yes Yes Yes Yes Yes
Time fixed effect Yes Yes Yes Yes Yes Yes
Driscoll-Kraay AR(3) std errors No Yes No Yes No Yes
N 327 327 117 117 133 133
# countries 45 45 31 31 38 38
R2 0.692 0.692 0.745 0.745 0.721 0.721
White robust errors in parentheses in clumns (1), (3), (5). Driscoll Kraay standard errors robust to heteroscedasticity, AR(3) autocorrelation, and cross-sectional correlation in column (2), (4), and (6). * p < 0.1, ** p < 0.05, *** p < 0.01. Wit and the
time trend are included as controls but not reported in the table.
Table 5b. SMCs’ transmission channels (2/2):
Dep. Var: Internet
penetration (1) (2) (3) (4) (5) (6) (7) (8)
SEACOM/EASSy -3.724 -3.724*** 1.169 1.169** 2.226 2.226* 0.560 0.560
(4.315) (1.192) (1.977) (0.537) (3.137) (1.115) (3.381) (1.045)
Channels: Invest. mobile network # IXPs Elect. access (% pop) Electricity consumption
Interactive term 5.01e-08*** 5.01e-08*** 5.184*** 5.184*** 0.0826* 0.0826* 0.00246*** 0.00246***
(1.04e-08) (7.28e-09) (1.519) (1.120) (0.0480) (0.0097) (0.0007) (0.0003)
Channel variable 4.86e-11 4.86e-11 2.100 2.100*** -0.072** -0.072** -0.00433 -0.00433*
(3.37e-11) (2.91e-11) (1.575) (0.458) (0.100) (0.034) (0.0047) (0.0022)
Country fixed
effect Yes Yes Yes Yes Yes Yes Yes Yes
Time fixed effect Yes Yes Yes Yes Yes Yes Yes Yes
DK AR(3) std err. No Yes No Yes No Yes No Yes
N 108 108 349 349 349 349 133 133
# countries 29 29 45 45 45 45 20 20
R2 0.844 0.844 0.676 0.676 0.647 0.647 0.769 0.769
White robust errors in parentheses in clumns (1), (3), (5), (7). Driscoll Kraay standard errors robust to heteroscedasticity, AR(3) autocorrelation, and cross-section correlational in column (2), (4), (6), and (8). * p < 0.1, ** p < 0.05, *** p < 0.01. Wit
5. Discussion and concluding remarks
In SSA, expectations placed on the digital economy take-off, on its capacity to create jobs and to offer satisfying living conditions to the populations, are particularly important. This paper presents novel evidence on the positive effect of improved international connectivity on Internet penetration in the subcontinent. The laying of SMCs along African coast by the end of the 2010s’ has indeed connected the subcontinent to the worldwide telecommunications network and spurred the uptake of Internet-related technologies, which are currently transforming African lifes (World Bank, 2016).
The examination of changes in Internet penetration and bandwidth capacity that followed different waves of SMC laying over time, together with confounding parallel trends prior to treatment, suggest that the successive deployment of the SEACOM cable in 2009 and the EASSy cables in 2010 constitute a relevant experiment for a causal analysis. DID analysis using these cables as treatment stresses that their arrival has yielded a 3-5 percentage point increase in Internet penetration rates in recipient countries. This is a large increase, representing approximately a doubling of the average Internet penetration rate in SSA before SEACOM arrival. Moreover, triple difference estimations highlight the positive mediating effects of lifting obstacles to Internet accessibility, spurring terrestrial infrastructure development and electricity access.
Since Africa international connectivity is now established, key challenges that SSA’s governments have to face are related the efficiency, the sovereignty and the integrity of African telecommunications networks. Terrestrial connectivity infrastructures, especially data centers and IXPs, and energy infrastructures are particularly missing. In fact, most African websites are hosted in foreign data centers, which has a negative consequence on Internet cost and latency, and on the sovereignty of African networks. IXP deployment should also increase the network stability, by avoiding Internet shutdown when SMC faults occur (Cariolle et al, 2019). Somalia, Mauritius, Comoros, Mauritania, Benin or Togo are examples of countries that are frequently experiencing telecommunications shutdowns due to these type of shocks. An improved access to affordable and stable source of energy supply for Africans is the other missing piece of the connectivity puzzle in the subcontinent. In fact, low energy infrastructure coverage and power outages represent a strong impediment to ICT uptake and to African firm growth (Cole et al, 2018). Future researches should try to deepen the knowledge on the contribution of such infrastructures to African digital eco-systems’ expansion.
Bibliography
AfdB. The Middle of the Pyramid: Dynamics of the Middle Class in Africa. Market Brief, April 20, 2011.
Aker, J. Using Digital Technology for Public Service Provision in Developing Countries Potential and Pitfalls, in Eds Gupta, S., Keem, M., Shah, A., & Verdier, G. Digital
Revolutions in Public Finance, IMF, November 2017, Washington DC.
Aker, J. & Blumenstock, J. (2014). The Economic Impacts of New Technologies in Africa, in Eds Monga, C. & Yifu Lin, J. The Oxford Handbook of Africa and Economics: Policies and
Practices, 2, 354-371.
Aker, J. C., & Mbiti, I. M. (2010). Mobile phones and economic development in Africa. Journal of Economic Perspectives, 24(3), 207−232.
Akerman, A., Gaarder, I., & Mogstad, M. (2015). The skill complementarity of broadband internet. The Quarterly Journal of Economics, 130(4), 1781-1824.
Andersen, T. B., Bentzen, J., Dalgaard, C. J., & Selaya, P. (2011). Does the Internet reduce corruption? Evidence from US states and across countries. The World Bank Economic
Review, 25(3), 387−417.
Andrianaivo, M., & Kpodar, K. (April 2011). ICT, financial inclusion, and growth evidence from African countries. IMF Working Paper No.11/73.
Asongu, S. A., & Nwachukwu, J. C. (2016). The mobile phone in the diffusion of knowledge for institutional quality in sub-Saharan Africa. World Development, 86, 133−147.
Bates, P. Submarine cables in Sub-Saharan Africa: terrestrial networks need to keep up, Analysys Mason, April 2014.
Bertschek, I., Cerquera, D., & Klein, G. J. (2013). More bits–more bucks? Measuring the impact of broadband internet on firm performance. Information Economics and Policy, 25(3), 190-203.
Bertschek, I., Briglauer, W., Hüschelrath, K., Kauf, B., & Niebel, T. (2015). The economic impacts of broadband internet: A survey. Review of Network Economics, 14(4), 201-227. Birba, O., & Diagne, A. (2012). Determinants of adoption of Internet in Africa: Case of 17 sub-Saharan countries. Structural Change and Economic Dynamics, 23(4), 463-472.
Bjorkegren, D. (2018) The Adoption of Network Goods: Evidence from the Spread of Mobile Phones in Rwanda, The Review of Economic Studies, rdy024,
https://doi.org/10.1093/restud/rdy024
Bresnahan, T. F., & Trajtenberg, M. (1995). General purpose technologies ‘Engines of growth’?. Journal of econometrics, 65(1), 83-108.
Buys, P., Dasgupta, S., Thomas, T. S., & Wheeler, D. (2009). Determinants of a digital divide in Sub-Saharan Africa: A spatial econometric analysis of cell phone coverage. World
Card, D., & Krueger A. B. (1994). Minimum wages and employment: A case study of the fast-food industry in New-Jersey and Pennsylvania. American Economic Review, 84(4), 772−793.
Cardona, M., Kretschmer, T., & Strobel, T. (2013). ICT and productivity: conclusions from the empirical literature. Information Economics and Policy, 25(3), 109-125.
Cariolle, J., Le Goff, M., & Santoni, O. Digital vulnerability and performance of firms in
developing and transition countries, Banque de France WP #709, 2019.
Carter, L., Burnett, D., Drew, S., Marle, G., Hagadorn, L., Bartlett-McNeil, D., & Irvine, N. (2009). Submarine cables and the oceans – Connecting the world (UNEP-WCMC Biodiversity Series No. 31). Cambridge: UNEP-WCMC.
Caselli, F., & Coleman, W. J. (2001). Cross-country technology diffusion: The case of computers. American Economic Review, 91(2), 328-335.
Chinn, M. D., & Fairlie, R. W. (2010). ICT use in the developing world: an analysis of differences in computer and internet penetration. Review of International Economics, 18(1), 153-167.
Chinn, M. D., & Fairlie, R. W. (2007). The determinants of the global digital divide: a cross-country analysis of computer and internet penetration. Oxford Economic Papers, 59(1), 16-44. Cole, M. A., Elliott, R. J., Occhiali, G., & Strobl, E. (2018). Power outages and firm performance in Sub-Saharan Africa. Journal of development economics, 134, 150-159.
Crémer, J., Rey, P., & Tirole, J. (2000). Connectivity in the commercial Internet. The Journal
of Industrial Economics, 48(4), 433-472.
Deloitte, The future of telecoms in Africa. The “blueprint of the brave”. 2014.
Driscoll, J. C., & A. C. Kraay. (1998). Consistent covariance matrix estimation with spatially dependent panel data. Review of Economics and Statistics, 80: 549-560.
Freund, C., & Weinhold, D. (2004). The Effect of the Internet on international trade. Journal
of International Economics, 62(1), 171–189.
Heckman, J., Ichimura, H., Smith, J., & Todd, P. (1998). Characterizing selection bias using experimental data. Econometrica, 66, 1017−1098.
Hjort, J., & Poulsen, J. (2019). The arrival of fast internet and employment in Africa. American Economic Review, 109(3), 1032-79.
Howard, P. N., & Mazaheri, N. (2009). Telecommunications reform, Internet use and mobile phone adoption in the developing world. World Development, 37(7), 1159−1169.
Inoue, A., & Solon, G. (2006). A portmanteau test for serially correlated errors in fixed effects models. Econometric Theory, 22(5), 835-851.
International Telecommunication Union (2014). Definition of world telecommunication/ICT indicators, March 2010, Geneva.
International Telecommunication Union (2016). Measuring the information society report. ITU Report.
International Telecommunication Union database, 2019. https://www.itu.int/en/ITU-D/Statistics/Pages/publications/wtid.aspx
Jensen, M. (2006). Lowering the costs of international bandwidth in Africa. Association for
Progressive Communications, San Francisco.
Katz, M. L., & Shapiro, C. (1985). Network externalities, competition, and compatibility. The
American Economic Review, 75(3), 424-440.
Malecki, E. J. (2002). The economic geography of the Internet’s infrastructure. Economic
Geography, 78(4), 399−424.
Milner, H. V. (2006). The digital divide: The role of political institutions in technology diffusion. Comparative Political Studies, 39(2), 176-199.
Mothobi, O., & Grzybowski, L. (2017). Infrastructure deficiencies and adoption of mobile money in Sub-Saharan Africa. Information Economics and Policy, 40, 71-79.
Muto, M., & Yamano, T. (2009). The impact of mobile phone coverage expansion on market participation: Panel data evidence from Uganda. World development, 37(12), 1887-1896. Ndulu, B. J. (2006). Infrastructure, regional integration and growth in Sub-Saharan Africa: With the disadvantages of geography and sovereign fragmentation. Journal of African
Economies, 15(Suppl.2), 212−244.
Paunov, C. & Rollo, V. (2015). Overcoming obstacles: the Internet’s contributions to firm development. World Bank Economic Review, 29(suppl.1), S192−S204.
Paunov, C., & Rollo, V. (2016). Has the Internet fostered inclusive innovation in the developing world? World Development, 78, 587−609.
Röller, L-H., & Waverman, L. (2001). Telecommunications infrastructure and economic development: A simultaneous approach. American Economic Review, 91(4), 909–923.
Schumann, R., & Kende, M. Lifting barriers to Internet development in Africa: Suggestions for improving connectivity. Report for the Internet Society, Analysys Mason and Internet Society, May 2013.
Sutherland, E. (2014). Undersea cables and landing stations around Africa: Policy and regulatory issues, 25th European Regional Conference of the International Telecommunications Society (ITS), 22−25 June 2014, Brussels, Belgium,
Telegeography (2020). The submarine cable map. Global Bandwidth Research Service.
http://www.submarinecablemap.com/
Wallsten, S. (2005). Regulation and internet use in developing countries. Economic
Development and Cultural Change, 53(2), 501-523.
Weller, D., & Woodcock, B. Internet traffic exchange: Market developments and policy challenges. OECD Digital Economy Papers, No. 207, OECD Publishing, January 2013.
World Bank Group (2016). The digital dividends. World Development Report 2016, Washington: World Bank. doi: 10.1596/978-1-4648-0671-1.
Funding
This work was supported by the Agence Nationale de la Recherche of the French government through the program ‘Investissements d’avenir’ (ANR-10-LABX-14-01), through the IDGM+ initiative led by Ferdi (Fondation pour les études et recherches sur le développement international).
Aknowledgements
I would like to thank Camille da Piedad and Olivier Santoni for their excellent research assistance. I am also grateful to Simone Bertoli, Marc Bourreau, Jaime De Melo, Chloé Duvivier, Michaël Goujon, Patrick Guillaumont, Michele Imbruno, Florian Léon, Aurélia Lépine, Raphaël Paris, Stephen P. Ryan, to the participants of the CERDI (University Clermont-Auvergne) research seminar, to the participants of the 2018 GRDI Conference in Clermont-Ferrand, the 2018 CESifo Area Conference on the Economics of Digitization in Munich, of the 2019 INFER Annual Conference in Brussels, and of the 2019 DIAL conference, for their valuable comments.
Appendixes A. Variable sources, definition and descriptive statistics. A.1. Baseline sample composition (45 countries)
Country
Code Freq. obs %
Country
Code Freq. obs %
AGO 18 2.46 MDG 17 2.32 BDI 23 3.14 MLI 17 2.32 BEN 16 2.18 MOZ 17 2.32 BFA 12 1.64 MRT 16 2.18 BWA 18 2.46 MUS 18 2.46 CAF 18 2.46 MWI 17 2.32 CIV 19 2.59 NAM 16 2.18 CMR 15 2.05 NER 16 2.18 COG 13 1.77 NGA 18 2.46 COM 17 2.32 RWA 17 2.32 CPV 17 2.32 SDN 11 1.50 DJI 18 2.46 SEN 19 2.59 ERI 5 0.68 SLE 21 2.86 ETH 18 2.46 STP 13 1.77 GAB 12 1.64 SWZ 17 2.32 GHA 18 2.46 SYC 17 2.32 GIN 16 2.18 TCD 15 2.05 GMB 11 1.50 TGO 23 3.14 GNB 16 2.18 TZA 16 2.18 GNQ 11 1.50 UGA 19 2.59 KEN 19 2.59 ZAF 22 3.00 LBR 10 1.36 ZMB 13 1.77 LSO 18 2.46 Total 733 100