HAL Id: inserm-01635833
https://www.hal.inserm.fr/inserm-01635833
Submitted on 15 Nov 2017
HAL is a multi-disciplinary open access
archive for the deposit and dissemination of
sci-entific research documents, whether they are
pub-lished or not. The documents may come from
teaching and research institutions in France or
abroad, or from public or private research centers.
L’archive ouverte pluridisciplinaire HAL, est
destinée au dépôt et à la diffusion de documents
scientifiques de niveau recherche, publiés ou non,
émanant des établissements d’enseignement et de
recherche français ou étrangers, des laboratoires
publics ou privés.
Sex-specific association between neighborhood
characteristics and dementia: the Three-City cohort
Noémie Letellier, Laure-Anne Gutierrez, Isabelle Carrière, Audrey Gabelle,
Jean-François Dartigues, Carole Dufouil, Catherine Helmer, Emmanuelle
Cadot, Claudine Berr
To cite this version:
Noémie Letellier, Laure-Anne Gutierrez, Isabelle Carrière, Audrey Gabelle, Jean-François Dartigues,
et al.. Sex-specific association between neighborhood characteristics and dementia: the Three-City
cohort. Alzheimer’s and Dementia, Elsevier, 2017, Epub ahead of print. �10.1016/j.jalz.2017.09.015�.
�inserm-01635833�
1
Sex-specific association between neighborhood characteristics and
dementia: the Three-City cohort
Noémie Letellier (1), Laure-Anne Gutierrez (1), Isabelle Carrière PhD (1), Audrey Gabelle PhD (1)(2),
Jean-François Dartigues PhD (3)(4), Carole Dufouil PhD (4)(5), Catherine Helmer PhD (3)(4), Emmanuelle Cadot
PhD (6), Claudine Berr PhD (1)(2)
(1) INSERM, Univ Montpellier, Neuropsychiatry: Epidemiological and Clinical Research, Montpellier, France
(2) Memory Research and Resources Center, Department of Neurology, Montpellier University Hospital Gui de Chauliac, F-34295 Montpellier, France
(3) Univ. Bordeaux, Inserm, Bordeaux Population Health Research Center, team LEHA, UMR 1219, F-33000 Bordeaux, France
(4) CHU Bordeaux, Department of Public Health, F-33000 Bordeaux, France
(5) Univ. Bordeaux, Inserm, Bordeaux Population Health Research Center, team VINTAGE, UMR 1219, F-33000 Bordeaux, France
(6) IRD – Hydrosciences UMR 5569, Montpellier University, F-34090 Montpellier, France
Corresponding author:
Dr Claudine Berr, Inserm U1061, La Colombière Hospital, 39 Avenue Charles Flahault F-34093 Montpellier, France.
Mail: claudine.berr@inserm.fr Phone: 33(1)499614566 Fax: 33 (1) 4499614579
2
Abstract
Introduction: The living environment affects general health and may influence cognitive aging; however, the relationships between neighborhood characteristics and dementia are still poorly understood.
Methods: We used data from a French population–based prospective study (the Three-City cohort) that included 7016 participants aged 65 years and older with a 12-year follow-up. We used principal components analysis of neighborhood composition indicators to construct the Three-City deprivation score. To study its impact on dementia incidence, we performed survival analyses using a marginal Cox model to take into account intraneighborhood correlations. As interaction with sex was significant, analyses were stratified by sex.
Results: Even after controlling on individual factors, women living in deprived neighborhoods were at higher risk of dementia (hazard ratio = 1.29, 95% confidence interval 1.00–1.67) and Alzheimer’s disease (hazard ratio = 1.42, 95% confidence interval 1.09–1.84). No association was found for men.
Discussion: Living in a deprived neighborhood is associated with higher risk of dementia in women
3 1. Introduction
There is increasing interest in the study of environmental impact on different aspects of health and well-being, including mental health [1]. The living environment includes many dimensions (social support, socioeconomic environment, urbanicity, psychosocial stressors, air pollution, nature experience, perceived environment…). In this study, we explored socioeconomic environmental influences.
A growing body of evidence suggests that cognitive functioning in later life is related to socioeconomic environment. These complex features could be encompassed by the neighbourhood socioeconomic status (NSES) in which individual characteristics are aggregated in predefined geographical units [2]. NSES is generally regarded as the combination of socioeconomic variables at the individual or household level and is often assessed using a poverty index. It was shown that NSES is related to the overall cognitive functioning of elderly people, after controlling for individual features [3–6], and influences cognitive decline [7,8].
Some individual characteristics, such as ethnicity [9,10], social class [11] or APOE genotype [12,13], could interact and have a modifying effect on the association between living environment and dementia [14]. For instance, in the USA population [9,10], the association between disadvantaged areas and lower cognitive ability has been detected only in ethnic minority groups. This could indicate lower access to community resources, or poorer ability to engage in healthy behaviours, all of which may affect cognition [15].
It has been hypothesized that associations between health and neighborhood characteristics are different for men and women [16]. For example, neighborhood deprivation exerts a stronger influence on the cardiovascular health of women [17]; and is a stronger predictor of hypertension among women than men. The magnitude of the association between various contextual domains and self-rated health appears to be larger for women in a large cross sectional study [16]. These studies suggest that the residential context is related to health for both men and women but that the salient factors are different for the two sexes [16]. Studies on residential context conducted on elderly subjects are limited.
To our knowledge, no study has been performed on the impact of the living environment on incident dementia; let alone considered the association with cognitive function according to sex [18]. Considering the importance of the living environment on health and the vulnerability of older people to the environment, it is crucial to better evaluate the influence of the living environment on incident dementia in order to better define and adapt prevention strategies. Our aim was to analyse how different contextual characteristics (i.e., living environment-related
4 variables), independently of individual features (i.e., level of education, occupation, health status) can influence the risk of dementia and Alzheimer’s disease (AD) in a longitudinal community-living elderly cohort. Our analyses were performed separately for men and women.
2. Methods
2.1 Study design and participants
For the present study, we used data from the Three-City (3C) community-living cohort of elderly (≥65 years of age) people who were enrolled from the electoral rolls of three French cities (Bordeaux, Dijon, and Montpellier) between 1999 and 2001. The longitudinal 3C study main objective [19] was to assess the risk of dementia and cognitive impairment related to vascular factors. Each participant signed an informed consent. The study protocol was approved by the Ethics Committee of the Hospital of Kremlin-Bicêtre and Sud-Méditerranée III.
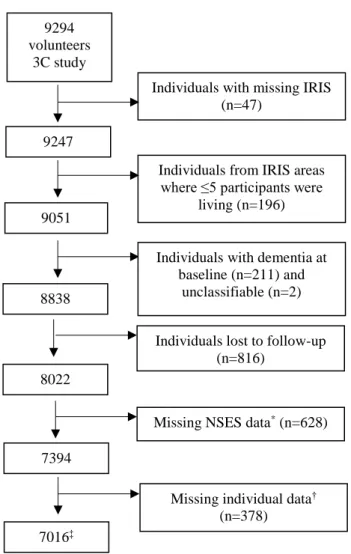
Among the 9,294 participants, we selected those with identifiable geographical area of residence (n= 9,247). Analyses were restricted to geographical areas where at least five participants were living (n = 9,051). We also excluded 213 subjects with prevalent dementia, and 816 lost to follow-up. Finally, 8,022 subjects without dementia at baseline and followed at least once were included. Then, we excluded subjects who had missing data for environmental exposure and individual covariates (sex, level of education, former occupation, income, APOEε4 carrier status, diabetes, depressive symptoms, or cardiovascular history). The analytic sample included 7,016 individuals (Figure 1).
2.2 Individual socioeconomic status (SES)
Individual SES measures included level of education (primary/secondary and higher, according to the classification by the French National Institute of Statistics and Economic Studies (INSEE)), monthly household income (≥2287€/<2287€), former occupational category (blue collars: workers, farmers, artisans/white collars) and living alone (yes/no).
2.3 Neighborhood SES (NSES)
We used IRIS (“Ilots Regroupés pour l’Information Statistiques”) data, the smallest census aggregation level used by INSEE to disseminate information. Postal addresses were geocoded to match participants to their IRIS neighborhood of residence [20].
To evaluate NSES at baseline, we used the census and “household net taxable income” data for 1999 and 2001, respectively. Instead of using the usual deprivation indices which have never been validated as gold standards [21,22], we defined a 3C deprivation score by Principal Component Analysis (PCA). This multidimensional
5 approach to data reduction is commonly used in the existing literature [23]. The 3C deprivation score for each IRIS neighborhood was defined as the first axis of the PCA with 12 NSES measures: median household net taxable income per consumption unit (CU), interquartile range of the household net taxable income per CU, interdecile ratio of household net taxable income per CU, proportion of blue collar workers, proportion of residents without secondary education, proportion of tenant occupancy, proportion of households without a car, proportion of single parents, proportion of people aged 60 or over, Gini index (an indicator of income inequality), adult unemployment rate, and settlement index (ratio between overcrowded and non-overcrowded housing).
The first axis summarized the best composition data of the neighborhoods in the sample (41.5% variance explained) (Figure 2). It was characterized by the positive score and high weight of the following components: proportion of households without a car, of tenants and single parents, Gini index, unemployment rate, and settlement index; and negative for the tax household income. The position of IRIS on this axis defines its degree of deprivation. This 3C deprivation score was categorized in tertiles (T1, T2 and T3; from the least to the most deprived neighborhood).
2.4 Diagnosis of dementia
At baseline, all participants from Bordeaux and Montpellier were examined by a neurologist, whereas in Dijon only those suspected of having dementia, based on their neuropsychological performances. During the follow-up, only participants suspected of having dementia were seen by a neurologist, with the exception of the Montpellier centre where everybody included in the 3C cohort received a neurological follow-up. An independent committee of neurologists reviewed all data on these patients to obtain a consensus diagnosis according to the Diagnostic and Statistical Manual of Mental Disorders IV criteria [24]. For the present analyses, we considered all incident cases of all-cause dementia and AD during the 12-year follow-up. Patients with AD were classified according to the National Institute of Neurological and Communicative Disorders and Stroke and the Alzheimer's Disease and Related Disorders Association criteria [25].
2.5 Covariates at baseline
Beside the individual SES, we considered sex, age, study centre, and living status (living alone, marital status). Behavioural variables and vascular risk factors included alcohol consumption, smoking status, body mass index (BMI) categories (underweight: BMI <18.5; normal: 18.5BMI<25 kg/m²; overweight: 25BMI<30 kg/m2;
obesity: BMI ≥30 kg/m²), diabetes (antidiabetic treatment or glycaemia >7.0 mmol/L or diabetes history), hypertension (systolic blood pressure >140 mm Hg, diastolic blood pressure >90 mm Hg, or antihypertensive treatment), and hypercholesterolemia (fasting total cholesterol >6.2mmol/L or lipid-lowering treatment). We recorded also the self-reported history of cardiovascular diseases (CVD) (stroke, angina pectoris, myocardial
6 infarction and cardiac and vascularsurgery), depressive symptoms (defined by a Center for Epidemiologic Studies Depression Scale score ≥17 for men and ≥23 for women, or too depressed to respond) [26], and disability (based on the results of the Instrumental Activities of Daily Living (IADL): dependent for at least 1/5 activities for men and 1/8 activities for women). APOE4 carrier status was defined as the presence of at least one 4 allele.
2.6 Statistical analysis
To investigate the association between NSES and the risk of dementia or AD, a marginal Cox model with age as the time scale was used [27]. This model, which used a robust sandwich variance estimator, allows taking into account the correlations between individuals in the same geographical area. Individual covariates for multivariate analysis were selected by combining data from univariate analyses (selection of variables with p<0.20) and literature [28]. After the crude analyses, analyses were adjusted for individual sociodemographic (sex, study centre, educational level, income, and occupational category) and health status (APOEε4, diabetes, cardiovascular diseases, depressive symptoms, and disability) variables. Results were expressed as hazard ratios (HR) and 95% confidence intervals (CI). Interactions between each NSES determinant and some individual variables (age, sex,
APOEε4, education and occupation) were tested. The Cochran-Armitage trend test was used to analyse the
dose-effect. Analyses were conducted using SAS version 9.4. The SAS procedure PHREG was used to estimate the HR and PRINCOMP for the PCA.
3. Results
3.1 Subjects characteristics
Among the 7,016 volunteers retained for this study (54,907 person-years (py)), 792 (11.3%) developed dementia during the 12-year follow-up, corresponding to an annual incidence rate of 14.4/1000 py. The mean age at enrolment was 74 years (SD 5.4) and participants had been living in the same residence for 25 years on average (SD 15). Moreover, 62% of participants were women, 37% lived alone, 24% had only primary education, 18% were former blue collars, 13% had depressive symptoms, 38% were smokers or former smokers, 52% were overweight or obese, 9% had diabetes, and 9% had a history of CVD. Among the 792 cases of dementia, 544 were classified as AD (68.7%) (Table 1).
Compared with the people included in the analysis, excluded individuals had a lower level of education (primary education: 35% vs 24%), were more often former blue collars (23% vs. 18%) and had a poorer general health. They lived in more disadvantaged neighborhoods, with a higher unemployment rate (14.9% vs. 14%), higher
7 proportion of residents without secondary education (49.2% vs. 48.1%) and of single parents (16% vs. 15.3%), and also lower income per household (data not shown).
3.2 Individual and contextual characteristics according to sex
Women had a lower level of education and income than men had, and were more often widowed or living alone. They consumed less alcohol and tobacco. Overweight, diabetes, history of CVD and hypertension were less frequent in women than men. Conversely, hypercholesterolemia and depression were more frequent in women as well as dependency for daily activities (9.8% vs 6.2% for men, p<0.0001). Dementia incidence was higher in women than in men (14.9 vs 13.6/1000 py) (Table 1). The contextual baseline characteristics were comparable between sexes (data not shown).
3.3 Individual SES characteristics and risk of dementia
Participants with secondary or higher education level had a lower risk of dementia than those with primary education (adjusted HR= 0.70, 95% CI 0.60-0.82) (Table 2). Similarly, the risk of developing dementia was 1.23 times higher among former blue than white collars (adjusted HR= 1.23, 95% CI 1.01-1.49). Higher income was associated with a decreased risk of dementia in univariate analysis, but not in multivariate models.
3.4 NSES and risk of dementia
The proportion of participants who developed dementia during the follow-up increased linearly with the 3C deprivation score (p trend = 0.006) from 10.3% for the most affluent neighborhoods to 12.8% for the most disadvantaged neighborhoods; however, the HR were not significantly different (Table 3). In crude analyses, some NSES categories were associated with higher risk of dementia, particularly high unemployment rate (HR= 1.24, 95% CI 1.03-1.48), and high proportion of blue collars (HR= 1.22, 95% CI 1.01-1.47). Conversely the risk was lower for participants living in areas with high median household net taxable income (HR= 0.82, 95% CI 0.70-0.98), or with an intermediate proportion (20-25%) of people aged 60 or over (HR= 0.80, 95% CI 0.66-0.96). Similar results were obtained when examining AD risk (data not shown). In multivariate analyses, the proportion of blue collars and the median household net taxable income were no longer associated with the risk of dementia. In these analyses, a significant interaction with sex was detected for some indicators of neighborhood composition: 3C deprivation score (p for interaction=0.009), proportion of tenant occupancy (p=0.01), of people aged 60 years or over (p=0.02), and of unemployed people (p=0.08). Additional sex-stratified multivariate analyses are presented in Figure 3 for the risk of all-type dementia and of AD.
8 3.5 Sex, living environment and dementia
When testing the association between the risk of incident dementia and the 3C deprivation score, the trend observed in both sexes was confirmed only in women (p=0.0004). The percentage of incident dementia was lower (10.3%) in the least deprived neighborhoods (T1), 11.0% in the intermediate (T2), and 14.6% in the most deprived neighborhoods (T3). HR was significantly different only for the most disadvantaged neighborhoods, even after adjustment (adjusted HR= 1.29, 95% CI 1.00-1.67) (Figure 3). Moreover, women had greater risk of dementia when they lived in neighborhoods with high proportion (>58.6%) than with low proportion (<44.2%) of tenant occupancy. This association remained significant when adjusting for individual SES and health status variables (adjusted HR= 1.31, 95% CI 1.03-1.65). Women residing in neighborhoods with high unemployment rates (>14.6%) also had a higher risk of dementia than those living in low unemployment rate areas (<10.3%) (adjusted HR= 1.36, 95% CI 1.06-1.75). Conversely, living in a neighborhood with higher proportion of subjects older than 60 years of age was associated with decreased risk of dementia in women. This association remained significant after adjustment (T2: adjusted HR= 0.77, 95% CI = 0.62-0.96; T3: adjusted HR= 0.79, 95% CI 0.64-0.97). These results were confirmed for AD (Figure 3). Women had a higher risk of AD when residing in the most disadvantaged neighborhoods (T3 adjusted HR= 1.42, 95% CI 1.09-1.85), or with high proportion of tenant occupancy (T3 adjusted HR= 1.48, 95% CI 1.16-1.88), or unemployment rate (adjusted HR= 1.47, 95% CI 1.11-1.94). They had a lower risk of AD when living in areas with the highest proportion of elderly people (≥60 years of age) (T2: adjusted HR= 0.78, 95% CI 0.62-0.98; T3: adjusted HR= 0.76, 95% CI 0.60-0.96). No association with any NSES component was evidenced in men for all-type dementia and for AD (Figure 3).
4. Discussion
To our knowledge, this is the first report showing the sex-related association between NSES and incident dementia risk. Specifically, the risk of dementia is higher among women living in areas with the highest deprivation score, or in neighborhoods with the highest unemployment rate and proportion of tenant occupancy. Conversely, the risk was reduced among women living in neighborhoods with a high proportion of people older than 60 years of age. These findings indicate that contextual risk factors are significantly associated with dementia/AD incidence only in women. Controlling for individual SES and health status only slightly changed the results. The only published contextual study on prevalent dementia did not find any socioeconomic environmental effect [29]. One explanation of this discrepancy is that results were not analysed according to the participants’ sex.
9 According to Stafford and Marmot, a disadvantaged socioeconomic status, at the individual level but also at the neighborhood level, increases the risk of poor general and mental health [30]. A favourable environment could associate the best living conditions, greater density of recreational resources (recreation centres, parks, walking paths, healthy food stores), social and cultural resources (libraries, bookstores, community centres, social clubs) [8–15] and therefore promote protective health behaviours (e.g., exercise) and facilitate cognitive stimulation (e.g., social interactions and cognitive activities, such as reading and game practice). These latter factors are negatively associated with the risk of dementia at the individual level [28]. Conversely, people living in deprived neighborhoods are more exposed to health risks due to the lower availability of such resources (less cognitive stimulation) and higher presence of environmental stressors [7]. Deprived neighborhoods have been associated also with individual depression [31], a risk factor of dementia. Pollution, which might increase the risk of dementia [32], also could be higher in disadvantaged environments, and neighborhood social stressors amplify the association between air pollution and cognitive function [33]. Disadvantaged areas could also be noisier and this might favour sleep troubles that could increase the risk of cognitive decline [34].
The association between proportion of people aged 60 years or older and reduced risk of incident dementia is in agreement with a recent study showing that living in a neighborhood with a higher percentage of older people (≥65 years) is related to better individual cognition at baseline [35]. This is in accordance with the hypothesis that living in these neighborhoods may be more suitable for older people (responsive services, better social interactions...) [36,37].
We can hypothesize that risk factors of cognitive decline may contribute more to the dementia risk in women than in men [38]. For example, APOEε4 has a stronger effect in women [39]. Moreover, lower education levels and occupational attainment are more common in women [40]. In addition, women seem to be more vulnerable and react differently to their environment. For instance, the insecurity stress affects more women than men and influences also their physical activity level [41]. Older women also are less mobile than men: they were less likely to work and to drive a car between 1950 and 1980 [42]. Consequently, women focus most of their activities in their neighborhood of residence, the characteristics of which may affect them more. Indeed, some authors suggest a greater vulnerability to the neighborhood characteristics, especially deprivation, in people with a limited activity space [31].
Even if individual risk factors differ according to sex, none of them explain differences between men and women. Our main results are only slightly modified when controlling for major dementia risk factors in the models. The
10 mechanisms behind the greater influence of socioeconomic environment in women needs further exploration. It remains unclear whether it is due to biological (sex) or sociocultural (gender) differences.
The main strengths of the present study include the longitudinal design, large population-based sample, active screening of dementia cases confirmed by an independent expert committee and adjustment for major individual SES variables and previously identified health factors. Even if we carefully selected confounding factors included in the models, we cannot excluded possible over-adjustment. The sample size also allowed the study of effect modifiers by strata. Our results were confirmed by analysing various aspects of deprivation (indicators of neighborhood composition and deprivation score) and we found similar results for dementia and AD.
Some limitations should also be noted. The analysis focused on three French urban areas. Therefore, generalization across all France or to different countries is questionable. Furthermore, the characteristics of the individuals not included in the present study were different compared with those of the subjects included in the analyses. Specifically, they lived more frequently in disadvantaged neighborhoods and had poorer health status. Other dimensions of the neighborhood’s social environment could also be important, such as safety, built environment, walkability and subjective poverty; however data on these factors were not collected at baseline and this restriction limits the interpretation and discussion of the results. At the individual level, we did not have a good indicator of social contact or isolation; we therefore used living alone (yes/no) as a proxy, which was not associated with the risk of dementia.
In conclusion, this study highlights the importance of examining cross-level interactions. A deprived neighborhood is detrimental for cognitive ageing only among women, independently of their individual characteristics. If confirmed in different population, this specificity should be taken into account by future public policies.
11 Acknowledgments
The 3C Study was conducted under a partnership agreement between the Institut National de la Santé et de la Recherche Médicale (INSERM), the Victor Segalen – Bordeaux II University and the Sanofi-Synthélabo Company. The Fondation pour la Recherche Médicale supported the preparation and initiation of the study. The 3C Study is also supported by the Caisse Nationale Maladie des Travailleurs Salariés, Direction Générale de la Santé, Conseils Régionaux of Aquitaine, Languedoc-Roussillon and Bourgogne, Fondation de France, Ministry of Research-INSERM Programme ‘Cohortes et collections de données biologiques’, Mutuelle Générale de l’Education Nationale, Institut de la longévité, Conseil Général de la Côte d’Or, Agence Nationale de la Recherche ANR PNRA 2006 and Longvie 2007 and Fonds de coopération scientifique Alzheimer (FCS 2009-2012). Funding
This work was supported by Agence Nationale de la Recherche ANR PNR 2006 (ANR/DEDD/PNRA/PROJ/200206-01-01) and Longvie 2007 (LVIE-003-01).
12 References
[1] Tost H, Champagne FA, Meyer-Lindenberg A. Environmental influence in the brain, human welfare and mental health. Nat Neurosci 2015; 18:1421‑31.
[2] Wu Y-T, Prina AM, Brayne C. The association between community environment and cognitive function: a systematic review. Soc Psychiatry Psychiatr Epidemiol 2015; 50:351‑62.
[3] Wight RG, Aneshensel CS, Miller-Martinez D, Botticello AL, Cummings JR, Karlamangla AS, et al. Urban neighborhood context, educational attainment, and cognitive function among older adults. Am J Epidemiol 2006; 163:1071‑8.
[4] Basta NE, Matthews FE, Chatfield MD, Brayne C. Community-level socio-economic status and cognitive and functional impairment in the older population. Eur J Public Health 2008; 18:48‑54.
[5] Wee LE, Yeo WX, Yang GR, Hannan N, Lim K, Chua C, et al. Individual and Area Level Socioeconomic Status and Its Association with Cognitive Function and Cognitive Impairment (Low MMSE) among Community-Dwelling Elderly in Singapore. Dement Geriatr Cogn Disord 2012; 2:529‑42.
[6] Sisco SM, Marsiske M. Neighborhood Influences on Late Life Cognition in the ACTIVE Study. J Aging Res 2012; 2012:435826.
[7] Sheffield KM, Peek MK. Neighborhood context and cognitive decline in older Mexican Americans: results from the Hispanic Established Populations for Epidemiologic Studies of the Elderly. Am J Epidemiol 2009; 169:1092‑101.
[8] Wen M, Gu D. The effects of childhood, adult, and community socioeconomic conditions on health and mortality among older adults in China. Demography 2011;48:153‑81.
[9] Aneshensel CS, Ko MJ, Chodosh J, Wight RG. The urban neighborhood and cognitive functioning in late middle age. J Health Soc Behav 2011; 52:163‑79.
[10] Espino DV, Lichtenstein MJ, Palmer RF, Hazuda HP. Ethnic differences in mini-mental state examination (MMSE) scores: where you live makes a difference. J Am Geriatr Soc 2001; 49:538‑48.
[11] Deeg DJH, Thomése GCF. Discrepancies between personal income and neighbourhood status: effects on physical and mental health. Eur J Ageing 2005; 2:98‑108.
[12] Boardman JD, Barnes LL, Wilson RS, Evans DA, Mendes de Leon CF. Social disorder, APOE-E4 genotype, and change in cognitive function among older adults living in Chicago. Soc Sci Med 2012; 74:1584‑90.
13 [13] Lee BK, Glass TA, James BD, Bandeen-Roche K, Schwartz BS. Neighborhood psychosocial environment, apolipoprotein E genotype, and cognitive function in older adults. Arch Gen Psychiatry 2011; 68:314‑21. [14] Cassarino M, Setti A. Environment as « Brain Training »: A review of geographical and physical environmental influences on cognitive ageing. Ageing Res Rev 2015; 23:167‑82.
[15] Rosso AL, Flatt JD, Carlson MC, Lovasi GS, Rosano C, Brown AF, et al. Neighborhood Socioeconomic Status and Cognitive Function in Late Life. Am J Epidemiol 2016; 183:1088-97.
[16] Stafford M, Cummins S, Macintyre S, Ellaway A, Marmot M. Gender differences in the associations between health and neighbourhood environment. Soc Sci Med 2005; 60:1681‑92.
[17] Matheson FI, White HL, Moineddin R, Dunn JR, Glazier RH. Neighbourhood chronic stress and gender inequalities in hypertension among Canadian adults: a multilevel analysis. J Epidemiol Community Health 2010; 64:705‑13.
[18] Besser LM, McDonald NC, Song Y, Kukull WA, Rodriguez DA. Neighborhood Environment and Cognition in Older Adults: A Systematic Review. Am J Prev Med 2017; S0749-3797(17)30160-5.
[19] 3C Study Group. Vascular factors and risk of dementia: design of the Three-City Study and baseline characteristics of the study population. Neuroepidemiology 2003; 22:316‑25.
[20] Grimaud O, Lapostolle A, Berr C, Helmer C, Dufouil C, Kihal W, et al. Gender differences in the association between socioeconomic status and subclinical atherosclerosis. PloS One 2013; 8:e80195.
[21] Carstairs V, Morris R. Deprivation: explaining differences in mortality between Scotland and England and Wales. BMJ 1989; 299:886‑9.
[22] Townsend P. Deprivation. J Soc Policy. 1987; 16:125–146.
[23] Rey G, Jougla E, Fouillet A, Hémon D. Ecological association between a deprivation index and mortality in France over the period 1997 - 2001: variations with spatial scale, degree of urbanicity, age, gender and cause of death. BMC Public Health 2009; 9:33.
[24] American Psychiatric Association. Diagnostic and Statistical Manual of Mental Disorders: DSM-IV. Washington, DC: American Psychiatric Association; 1994.
[25] McKhann G, Drachman D, Folstein M, Katzman R, Price D, Stadlan EM. Clinical diagnosis of Alzheimer’s disease Report of the NINCDS‐ADRDA Work Group under the auspices of Department of Health and Human Services Task Force on Alzheimer’s Disease. Neurology 1984; 34:939‑939.
[26] Fuhrer R, Rouillon F, La version française de l’échelle CES-D (Center for Epidemiologic Studies-Depression Scale). Description et traduction de l’échelle d’autoévaluation. Psychiatr Psychobiol 1989; 4:163-6.
14 [27] Thiébaut ACM, Bénichou J. Choice of time-scale in Cox’s model analysis of epidemiologic cohort data: a simulation study. Stat Med 2004; 23:3803‑20.
[28] Plassman BL, Williams JW, Burke JR, Holsinger T, Benjamin S. Systematic review: factors associated with risk for and possible prevention of cognitive decline in later life. Ann Intern Med 2010; 153:182‑93.
[29] Wu Y-T, Prina AM, Jones AP, Barnes LE, Matthews FE, Brayne C, et al. Community environment, cognitive impairment and dementia in later life: results from the Cognitive Function and Ageing Study. Age Ageing 2015; 44:1005‑11.
[30] Stafford M, Marmot M. Neighbourhood deprivation and health: does it affect us all equally? Int J Epidemiol 2003; 32:357‑66.
[31] Vallée J, Cadot E, Roustit C, Parizot I, Chauvin P. The role of daily mobility in mental health inequalities: the interactive influence of activity space and neighbourhood of residence on depression. Soc Sci Med 2011; 73:1133‑44.
[32] Chen H, Kwong JC, Copes R, Tu K, Villeneuve PJ, Donkelaar A van, et al. Living near major roads and the incidence of dementia, Parkinson’s disease, and multiple sclerosis: a population-based cohort study. Lancet Lond Engl 2017; 389(10070):718‑26.
[33] Ailshire J, Karraker A, Clarke P. Neighborhood social stressors, fine particulate matter air pollution, and cognitive function among older U.S. adults. Soc Sci Med 1982. janv 2017;172:56‑63.
[34] Spira AP, Chen-Edinboro LP, Wu MN, Yaffe K. Impact of Sleep on the Risk of Cognitive Decline and Dementia. Curr Opin Psychiatry 2014; 27:478‑83.
[35] Friedman EM, Shih RA, Slaughter ME, Weden MM, Cagney KA. Neighborhood age structure and cognitive function in a nationally-representative sample of older adults in the U.S. Soc Sci Med 2016; 174:149‑58. [36] Bennett DA, Schneider JA, Tang Y, Arnold SE, Wilson RS. The effect of social networks on the relation between Alzheimer’s disease pathology and level of cognitive function in old people: a longitudinal cohort study. Lancet Neurol 2006; 5:406‑12.
[37] Barnes LL, Mendes de Leon CF, Wilson RS, Bienias JL, Evans DA. Social resources and cognitive decline in a population of older African Americans and whites. Neurology 2004; 63:2322‑6.
[38] Mielke MM, Vemuri P, Rocca WA. Clinical epidemiology of Alzheimer’s disease: assessing sex and gender differences. Clin Epidemiol 2014; 6:37‑48.
15 [39] Altmann A, Tian L, Henderson VW, Greicius MD, Alzheimer’s Disease Neuroimaging Initiative Investigators. Sex modifies the APOE-related risk of developing Alzheimer disease. Ann Neurol 2014; 75:563‑ 73.
[40] Afsa C, Buffeteau S. L'activité féminine en France: quelles évolutions récentes, quelles tendances pour l'avenir? Econ Stat 2006; 398:85–97.
[41] Garcia Bengoechea E, Spence JC, McGannon KR. Gender differences in perceived environmental correlates of physical activity. Int J Behav Nutr Phys Act 2005; 2:12.
[42] Dalen HM, Halvorsen B. Gender differences in environmental related behaviour. Report n°38. Oslo : Statistics Norway, 2011, 83 p.
16
*median income (n=450), Gini index (n=516), interdecile ratio of household net taxable income (n=594)
†former occupation (n=23), education level (n=12), APOE4 carrier status (n=394), history of cardiovascular
diseases (n=2), diabetes (n=1)
‡Subjects not included in the analyses were more depressed and lived in more disadvantaged neighbourhoods.
Figure 1: Flow chart showing how participants from the French 3C cohort were selected for this study 8838
8022
Individuals with missing IRIS (n=47)
Individuals from IRIS areas where ≤5 participants were
living (n=196) 9294 volunteers 3C study 9247 9051
Individuals with dementia at baseline (n=211) and
unclassifiable (n=2) Individuals lost to follow-up
(n=816)
Missing NSES data* (n=628)
7394
Missing individual data† (n=378) 7016‡
17 Figure 2: Projection of the 12 variables of neighbourhood composition on the first factorial plane (factor 1 on the abscissa and factor 2 on the ordinate) of the principal component analysis (N = 7016)
18 Table 1: Distribution of individual characteristics at baseline according to sex
Individual characteristics, n (%) All participants (n=7016) Men (n=2685) Women (n=4331) p*
Sociodemographic and socioeconomic factors
Age (years)† 74.1 (5.4) 74.0 (5.4) 74.2 (5.4) 0.07 Study centre 0.69 Bordeaux 1585 (22.6) 606 (22.6) 979 (22.6) Dijon 4084 (58.2) 1550 (57.7) 2534 (58.5) Montpellier 1347 (19.2) 529 (19.7) 818 (18.9) Civil status (n=6988) <.0001 Divorced or single 1032 (14.8) 203 (7.6) 829 (19.2) Married 4087 (58.5) 2188 (82.0) 1899 (44.0) Widow 1869 (26.8) 278 (10.4) 1591 (36.8) Primary education 1676 (23.9) 569 (21.2) 1107 (25.6) <.0001 Income ≥ 2287 € 2317 (33.0) 1267 (47.2) 1050 (24.2) <.0001
Former blue collar workers 1261 (18.0) 561 (20.9) 700 (16.2) <.0001
Living alone (n=6999) 2592 (37.0) 399 (14.9) 2193 (50.8) <.0001
Disability (IADL) (n=6969) 590 (8.4) 166 (6.2) 424 (9.8) <.0001
Factors related to lifestyle Alcohol consumption (n=6901) Non-consumer 1403 (20.3) 217 (8.2) 1186 (27.9) <.0001 1-36 g/day 4952 (71.8) 1951 (73.6) 3001 (70,6) >36 g/day 546 (7.9) 483 (18.2) 63 (1.5) Smoking status (n=7013) Current smoker 371 (5.3) 213 (7.9) 158 (3,7) <.0001 Former smoker 2301 (32.8) 1659 (61.8) 642 (14.8) Non-smoker 4341 (61.9) 812 (30.3) 3529 (81.5)
Factors related to health
19
APOEε4 carrier 1391 (19.8) 562 (20.9) 829 (19.1) 0.07
Body mass index <.0001
Underweight (<18.5) 181 (2.6) 22 (0.8) 159 (3,7) Normal (18.5-25) 3162 (45.1) 1005 (37.4) 2157 (49.8) Overweight (25-30) 2735 (39.0) 1310 (48.8) 1425 (32.9) Obese (>30) 938 (13.4) 348 (13.0) 590 (13,6) Diabetes 649 (9.3) 344 (12.8) 305 (7.0) <.0001 History of CVD 627 (8.9) 407 (15.2) 220 (5.1) <.0001 Hypertension‡ (n=6864) 2889 (42.1) 1240 (47.0) 1649 (39.1) <.0001 Hypercholesterolemia§ (n=7007) 3989 (56.9) 1232 (45.9) 2757 (63.8) <.0001 Depressive syndrome (n=6931) 893 (12.7) 303 (11.3) 590 (13.6) 0.01
*Wilcoxon test for age, Chi-square test for other variables †MEAN (SD)
‡Hypertension: systolic blood pressure >140 mm Hg, diastolic blood pressure >90 mm Hg, or antihypertensive
drug intake)
§Hypercholesterolemia: fasting total cholesterol>6.2mmol/L or lipid-lowering drug intake)
20 Table 2: Associations between individual characteristics at baseline and risk of dementia onset, survival analysis (marginal Cox model)
*Chi-square test
†Model adjusted for sex, study centre, educational level, income, occupational category, APOEε4 carrier status,
diabetes, history of cardiovascular diseases, depressive symptoms and disability (IADL)
All-type dementia (n=792) Univariate Multivariate†
Individual characteristics n (% ) p* HR (95% CI) p HR (95% CI) p
Level of education <.0001 Primary 275 (16.4) 1 - 1 - Secondary or higher 517 (9.7) 0.57 (0.49-0.67) <.0001 0.70 (0.60-0.82) <.0001 Income <.0001 < 2287 € 594 (12.6) 1 - 1 - ≥ 2287 € 198 (8.6) 0.72 (0.62-0.84) <.0001 0.88 (0.73-1.05) 0.16 Former occupation <.0001
White collar worker 601 (10.4) 1 - 1 -
Blue collar worker 191 (15.2) 1.64 (1.39-1.94) <.0001 1.23 (1.01-1.49) 0.04
Living alone (n=6999) 0.0002
No 449 (10.2) 1 - 1 -
21 Table 3: Associations between neighborhood characteristics at baseline and risk of dementia onset,
survival analysis (marginal Cox model)
All-type dementia (n=792) Univariate
Neighborhood characteristics n (%) p* HR (95% CI) p
3C deprivation score
T1 (< -0.94) 239 (10.3) 0.006 1 -
T2 (-0.94-0.28) 255 (10.8) 0.99 (0.82-1.21) 0.94
T3 (>0.28) 298 (12.8) 1.15 (0.93-1.42) 0.21
Proportion of residents without secondary education
T1 (<40.3) 271 (11.8) 0.38 1 - T2 (40.3-54.6) 224 (9.5) 0.88 (0.73-1.06) 0.19 T3 (>54.6) 297 (12.6) 1.18 (0.99-1.41) 0.06 Gini index T1 (<0.31) 240 (10.2) 0.08 1 - T2 (0.31-0.35) 276 (11.8) 1.07 (0.87-1.32) 0.53 T3 (>0.35) 276 (11.9) 1.00 (0,79-1.24) 0.96 Proportion of tenants T1 (<44.2) 235 (10.2) 0.003 1 - T2 (44.2-58.6) 254 (10.8) 1.00 (0.81-1.24) 0.98 T3 (>58.6) 303 (12.9) 1.15 (0.93-1.41) 0.19 Unemployment rate T1 (<10.3) 220 (9.3) 0.0004 1 - T2 (10.3-14.6) 280 (12.0) 1.21 (1.00-1.47) 0.05 T3 (>14.6) 292 (12.6) 1.24 (1.03-1.48) 0.02
Proportion of blue collar workers
T1 (<13.6) 267 (11.1) 0.23 1 -
T2 (13.6-20.8) 239 (10.5) 0.99 (0.84-1.18) 0.94
T3 (>20.8) 286 (12.2) 1.22 (1.01-1.47) 0.04
Proportion of households without a car
T1 (<21.2) 232 (9.9) 0.02 1 -
T2 (21.2-29.0) 278 (12.0) 1.19 (0.98-1.46) 0.08
T3 (>29.0) 282 (12.0) 1.11 (0.90-1.37) 0.33
Proportion of single parents
T1 (<11.9) 254 (10.8) 0.49 1 -
T2 (11.9-16.5) 270 (11.7) 1.03 (0.85-1.26) 0.74
T3 (>16.5) 268 (11.4) 0.98 (0.79-1.21) 0.83
22
T1 (<0.01) 240 (10.3) 0.28 1 -
T2 (0.01-0.02) 292 (12.2) 1.15 (0.94-1.40) 0.18
T3 (>0.02) 260 (11.3) 1.05 (0.87-1.27) 0.59
Median household net taxable income
T1 (<15487) 291 (12.6) 0.02 1 -
T2 (15487-18091) 256 (11.0) 0.91 (0.75-1.11) 0.37
T3 (>18091) 244 (10.3) 0.82 (0.70-0.98) 0.02
Proportion of people aged 60 years or over
T1 (<20.0) 296 (12.6) 0.20 1 -
T2 (20.0-24.7) 232 (9.9) 0.80 (0.66-0.96) 0.02
T3 (>24.7) 264 (11.4) 0.88 (0.73-1.07) 0.20
23 Figure 3: Association between the neighbourhood composition indicators and risk of all-type dementia and Alzheimer disease (AD), according to sex: survival analysis (marginal Cox model, adjusted model*)
All-type dementia (n=792/7016)
AD (n=544/6768)
24
*Model adjusted for study centre, educational level, income, occupational category, APOEε4 carrier status,