HAL Id: hal-02556974
https://hal.archives-ouvertes.fr/hal-02556974
Submitted on 28 Apr 2020
HAL is a multi-disciplinary open access
archive for the deposit and dissemination of sci-entific research documents, whether they are pub-lished or not. The documents may come from teaching and research institutions in France or abroad, or from public or private research centers.
L’archive ouverte pluridisciplinaire HAL, est destinée au dépôt et à la diffusion de documents scientifiques de niveau recherche, publiés ou non, émanant des établissements d’enseignement et de recherche français ou étrangers, des laboratoires publics ou privés.
Reconstruction of Marine fisheries catches for Tunisia
(1950-2010)
Ghassen Halouani, Frida Ben Rais Lasram, Myriam Khalfallah, Dirk Zeller,
Daniel Pauly
To cite this version:
Ghassen Halouani, Frida Ben Rais Lasram, Myriam Khalfallah, Dirk Zeller, Daniel Pauly. Recon-struction of Marine fisheries catches for Tunisia (1950-2010). UBC Fisheries Center: Working Paper Series, 2015, 2015-95, pp.1-12. �hal-02556974�
Fisheries Centre
The University of British Columbia
Working Paper Series
Working Paper #2015 - 95
Reconstruction of Marine Fisheries catches for
Tunisia (1950-2010)
Ghassen Halouani, Frida Ben Rais Lasram,
Myriam Khalfallah, Dirk Zeller and Daniel Pauly
Year: 2015
Email: ghassen.halouani@gmail.com
This working paper is made available by the Fisheries Centre, University of British
Columbia, Vancouver, BC, V6T 1Z4, Canada.
R
ECONSTRUCTION OFM
ARINEF
ISHERIES CATCHES FORT
UNISIA(1950-2010)
Ghassen Halouani1,2, Frida Ben Rais Lasram1, Myriam Khalfallah3, Dirk Zeller3 and Daniel Pauly3
1 National Agronomic Institute of Tunisia (INAT)
UR03AGRO1 Aquatic Resources & Ecosystems Laboratory 43 av. Charles Nicolle 1082 Tunis, Tunisia
2Laboratoire des Sciences de l'Environnement Marin UMR 6539 LEMAR
(CNRS/UBO/IRD/Ifremer), Institut Universitaire Européen de la Mer, Technopôle Brest-Iroise, Plouzané, France
3Sea Around Us, Fisheries Centre, University of British Columbia,
2202 Main Mall, Vancouver, V6T 1Z4, Canada ghassen.halouani@gmail.com; frida.lasram@gmail.com;
m.khalfallah@fisheries.ubc.ca; d.zeller@fisheries.ubc.ca; d.pauly@fisheries.ubc.ca
ABSTRACT
The reconstructed total domestic marine catches for Tunisia’s fisheries, including large-scale and small-scale commercial catches and recreational catch, as well as major discards, have been estimated for the 1950-2010 period, and increased from approximately 14,500 t·year-1 in the 1950s to
over 98,800 t·year-1 in the 2000s. The estimated total domestic catches within Tunisia’s EEZ are 1.13
times the national data. Foreign flag industrial catches were estimated to increase from almost 7,800 t in 1950 to a peak of just under 19,200 t in 1975, and then decline to 560 t in 2010. Domestic landings were obtained from official reports of the department of fisheries at the Tunisian agricultural ministry and from the Tunisian National Institute of Statistics. Foreign flag catches and domestic discards were estimated based on independent studies and recreational catches were reconstructed based on information provided by the Tunisian Federation of Sport Fishing and other surveys.
INTRODUCTION
Tunisia is a North African country, part of the Maghreb. It has a total area of approximately 164,000 km2 and is bordered by Algeria in the west, Libya in the southern-east and the Mediterranean Sea in
the north and the east. Relative to its size, Tunisia has a long coastline, which is indented by three important embayments: the Gulf of Tunis in the north, of Hammamet near the center and the Gulf of Gabès in the south.
Tunisia can be divided into three main geographical regions according to climate, quality of soils and topography, i.e., the North, the Center and the South (Nelson 1986). The northern region is isolated
from the rest of the country by the Atlas Mountains and is characterized by heavier rainfall and richer soils than the rest of the country; thus, most of Tunisia’s agriculture production originates from the North. The Center, in contrast, has poorer soils with little vegetation and insufficient rainfall, and its littoral forms what is called Sahel, i.e. “the Coast”. Its agriculture emphasizes wheat and other grains, pasture and the intensive cultivation of olive. The South includes chotts, i.e. salt marshes, oases with date palms, but mainly sand desert, i.e., the Sahara (Nelson 1986). The climate is mostly Mediterranean except in the southern part of the country, the Sahara, where there is extreme diurnal variation in temperature. Tunis, the capital and main city of the country since the 13th century, is situated in the north-east of Tunisia (Nelson 1986; Boularès 2012).
A 2013 census estimated the Tunisian population at 10.8 million (www.ins.nat.tn). Various people settled on the Tunisian coast, e.g., Phoenicians, Romans, Turkish, Arabs, etc. The French colonized the country until its independence in 1956. Habib Bourguiba became the first president of the new Tunisian republic. In 1987, a coup d’état brought a second president to Tunisia who was overthrown, following the events which initiated the “Arab Spring” of 2011 (Boularès 2012).
The sea and fish are extremely important in the Tunisian culture and traditions, particularly due to the geography of the country.
The Tunisian fishing industry
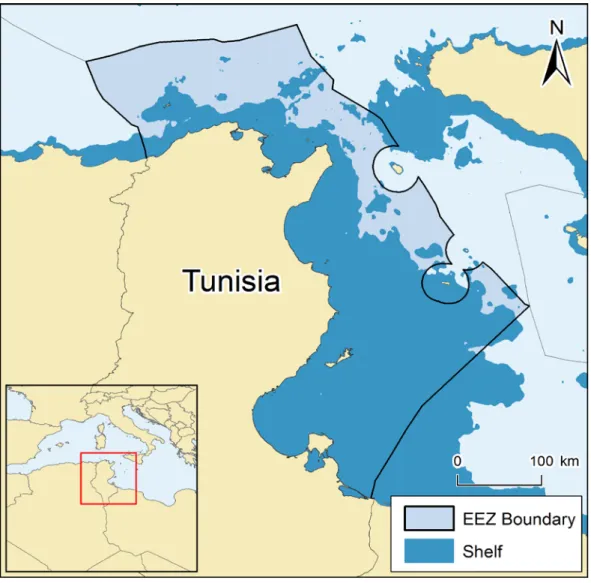
Tunisia has a wide continental shelf of over 66,000 km2, and in 2005, it claimed an Exclusive
Economic Zone (EEZ), of 102,300 km2 (Official journal of the Tunisian Republic 2005;
www.seaaroundus.org) (Figure 1). The large extension of soft bottoms has contributed to the development of artisanal and industrial fisheries in the Gulf of Gabès, where over 40% of total landings are generated (Najar et al. 2010).
The artisanal sector, consisting of a fishing fleet of around 10,300 boats (in 2008), is well developed along the Tunisian coast, and it is mainly performed by about 4,500 small boats, of which 66% were motorized (in 2008); they use a wide variety of fishing techniques and target high value species. However, for the last few decades, the number of artisanal boats has been decreasing because of the development of industrial fisheries.
Data collection is made by officials on a daily basis in each fishing port, who control the size and the quantities of fishes caught by each boat before allowing them to sell the fish at the wholesale market. Considerable catch amounts are exported, mainly to European markets. Indeed, after olive oil, marine products (i.e., fresh and frozen fish, cephalopods and other seafood) are Tunisia’s most important export products.
MATERIAL AND METHODS
Total landings were assembled by sector, year and group of species, for the 1977-2010 time period, from official reports of the Tunisian Department of Fisheries. For the period from 1950 to 1976, we used data from national Statistical Bulletins. However, the earlier statistical data do not have the same level of detail. Notably, they did not use the same taxonomic breakdown and reporting format from one year to the next, often due to transfers of management responsibilities. Thus, alternative information sources (e.g., scientific reports, local expert knowledge) were used to improve on the earlier statistics. Then, official data and those reported by FAO on behalf of Tunisia were compared to evaluate the quality of data transfer. Finally, the official data were used as the reported baseline because it has overall a better taxonomic disaggregation than the FAO data.
The Tunisian department of fisheries has applied correction factors to the landings data since the end of the 1970s in order to take into account subsistence and unreported commercial catches, which amount to considerable quantities of fishing products sold directly to hotels and restaurants or in local markets without being accounted by the statistical agents. These correction factors account for 42% of total commercial catches in the artisanal fishery, 17% in the trawl fishery and 15% in the small pelagic fishery. These correction factors are still used today with the same coefficients. Tunisia should be applauded for the foresight of using adjustment factors, something used also by some other countries to account for unmonitored subsistence and commercial catches (e.g., Khalfallah et
al. 2015), but not all (Zeller et al. 2006; Zeller et al. 2015).
Reported commercial fishery
The artisanal sector is multi-species and multi-gear. It includes non-motorized and motorized boats (length <12m). The industrial fishery involves trawlers, lampara, i.e., a type of purse seines fishing with lights and targeting small pelagic fishes, longliners and other purse seiners which target both demersal and pelagic resources. In the national data that were used in this study as the reported
baseline, landings were classified by gears. However, due to the incoherence of the gear classification among the national data, for the 1950-2010 periods, landings had to be reclassified into the appropriate gear categories based on the targeted species.
Recreational fishery
With the sophistication of the recreational fishing gears, which became cheaper and more affordable to a wider public, the recreational fishery in Tunisia is gaining in popularity. However, there is almost no data or studies on fisheries catches by this sector. The most important organization of the recreational fishery is the Tunisian Federation of Sport fishing, which was created in 2005 for better controls and regulations, as well as promotion of activities within the sector, e.g., underwater fishing, line fishing, etc. This organization thus became a hub for recreational fishing clubs of the country (www.ftps.org.tn). To estimate recreational fishery catches, we used information from previous works on recreational fishing in Tunisia, surveys of recreational fishers, as well as information provided directly by the Tunisian Federation of Sport Fishing.
Based on the number of recreational fishers who are members of Tunisian recreational fishing clubs in 2013 and on the recreational fishing effort, i.e., numbers of trips per season and mean catch per trip, we estimate the recreational catch for the year 2013, when the fishing clubs had 3,000 members (Tunisian Federation of Sport fishing pers. comm.). Earlier catches were interpolated between the 2013 estimate and a catch of zero in 1960, assuming that recreational fishing started in the early 1960s.
There are two different fishing seasons for this sector: summer (June/July/August) and “non-summer”. Recreational fishers go fishing on average twice a week in summer and once a month in “non-summer”. However, on average each fisher returns empty-handed following 3 trips out of 5 in summer and 1 trip out of 5 in “non-summer”. During the trips where there are catches, the average catch amount per trip per fisher in summer is 3.5 kg and in “non-summer” 1.8 kg (Khalfallah 2013). Following Khalfallah (2013), we consider (A) number of recreational fishers in 2013; (B) number of trips per fisher in summer; (C) number of trips per fisher in “non-summer”; (D) recreational catch amounts per trip per fisher in summer; (E) recreational catch amounts per trip per fisher in “non-summer”; and (F) total estimated recreational catch amounts in 2013, i.e., F = A·[(B·D) + (C·E)] .
Industrial discards included mainly discards of trawlers. These discards were estimated based on the results of scientific surveys of the National Institute of Marine Sciences and Technology (INSTM), and other scientific reports (Gharbi and Zaarah 2001; Jarboui et al. 2005; Salsabil 2008). These estimates were made separately for the northern and eastern coast of Tunisia, as well as for the southern coast including the Gulf of Gabès.
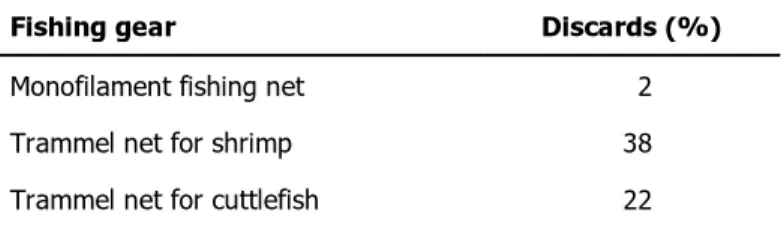
Discards of the artisanal fishery were estimated by Harrabi (2003) for the east coast of Tunisia, i.e., regions of Monastir and Mehdia, during the 2000s. Based on these estimates, the percentages of discards by gear compared to the total landings were calculated (Table 1). These estimates were then applied to the entire period, from 1950 to 2010.
Table 1. Percentages of artisanal discards by gear from
total landings for Tunisia (Anon. 1989; Harrabi 2003).
Fishing gear Discards (%)
Monofilament fishing net 2
Trammel net for shrimp 38
Trammel net for cuttlefish 22
Species disaggregation
Taxonomic disaggregations for each of the artisanal and industrial commercial fisheries were available for the periods 1978-1982 and 1995-2010 in reports of the Department of Fisheries. We calculated the percentages of each taxa group for the years 1978 and 1982 and applied these percentages to the total industrial landings for the 1950-1977 and 1983-1994 time periods, respectively. As the fishery for shrimp, which generates copious discards, began only in 1978, the discard percentages were adjusted to exclude this fishery before 1978.
The taxonomic disaggregation of artisanal discards and recreational catches, which includes individual species, was pooled to the family level. Then, the percentage of each family was applied to the artisanal catches for the 1950-2010 time period, while the percentages of families for the recreational catches were adjusted according to the popularity of some species of fish among recreational fishers.
Foreign fishing
Foreign industrial catches were estimated separately and were obtained from reports supplied by the National Institute of Marine Sciences and Technology (INSTM; Anon. 1978). Similarly, the Discards
taxonomic desegregation of foreign (industrial) catches was brought up to a family level. Then we applied the percentages of families to the foreign catches.
RESULTS
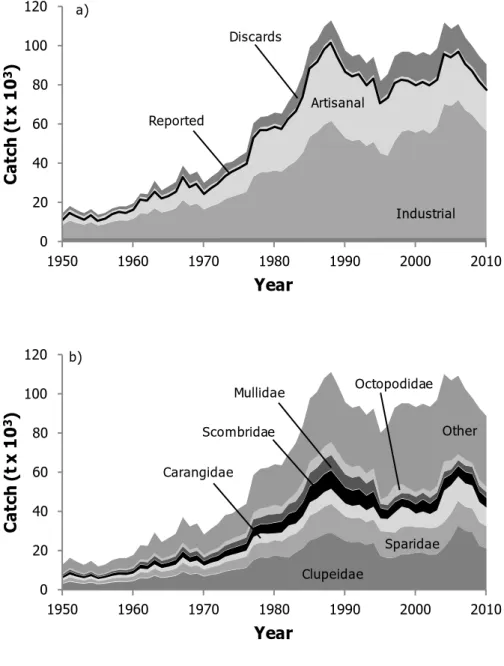
Reconstructed marine fisheries catches were estimated for Tunisia for the 1950-2010 time period. Although the FAO catches were sometimes higher than the national data, they have the very similar trajectories (Figure 2). However the national data have a better taxonomic disaggregation, and they were thus used as the baseline, to which previously unreported small-scale and large-scale commercial, recreational, and illegal foreign catches, as well as major discards were added (note that subsistence catches as well as unreported commercial catches are implicitly included in the reported data because of the application of correction factors, and thus are deemed “reported”; see above). The estimated total domestic catches are 1.13 times the official reported landings. Catches increased steadily from 13,000 t in 1950 to the peak of 111,200 t in 1988 (Figure 2a). Catches then leveled out and averaged 95,200 t·year-1 from 1990-2010. Reconstructed total catch was dominated by the
industrial sector with 66%, followed by artisanal (34%) and recreational (0.1%; Figure 2a). Discards contributed 11% of the catch with almost 92% coming from the industrial sector and only 8% from artisanal. The main fish families of the reconstructed total domestic catch are Clupeidae (24%), Sparidae (13%) and Carangidae (8.4%) followed by Mullidae (7.2%), Scombridae (5.1%) and Octopodidae (5.1%; Figure 2b).
Foreign flag industrial landings were estimated to increase from almost 7,800 t in 1950 to a peak of just under 19,200 t in 1975, and then decline to 560 t in 2010. Catches were dominated by Clupeidae (29%), Sparidae (14%), Carangidae (11%), Mullidae (8.8%) and Octopodidae (6.2%).
In the 1970s, the Government of Tunisia started to invest heavily in the fishery sector, which led to the intensification of fishing effort. By the late 1980s, first signs of overexploitation became visible, i.e., landings decreased while fishing effort was still increasing. This led to the reinforcement of the fisheries regulations. Thus, between the mid-1990s to the mid-2000s, the fishery recovered.
Our estimations of artisanal and industrial discards as well as recreational catches remain conservative. For the discards, we did not take into account all type of gears, e.g., pelagic trawl or purse seiners. Estimates of recreational catches were based only on catches by fishers, who are members of the Tunisian Federation of Sport Fishing, i.e., independent anglers are excluded.
Overall, fisheries management in Tunisia is well developed. The correction factors applied to the different fisheries take into account subsistence and unreported commercial catches. However, these factors have been put in place at the end of the 1970s and need to be updated (Khalfallah 2013).
ACKNOWLEDGEMENTS
We acknowledge support from the Sea Around Us, a scientific initiative supported by The Pew Charitable Trusts and the Paul G. Allen Family Foundation.
REFERENCES
Anon. (1978) Reports and documents n 2-78. Institut National Scientifique et Technique d’Océanographie et de Pêche.
Anon. (1989) Reports and documents no. 1. Institut National des Sciences et Technologies de la Mer (INSTM).
Boularès H (2012) Histoire de la Tunisie: Les grandes dates, de la Préhistoire à la Révolution. Cérès Editions, Tunisia. 720 p.
Gharbi H and Zaarah (2001) Rapport sur les résultat des prospections réalisées dans le golfe de Gabès du 14 au 16 novembre 2001. Institut National des Sciences et des Technologies de la Mer. 10 p.
Harrabi H (2003) Analyse des captures principales, accessoires et des rejets des filets droits destinés à la pêche des crevettes, des céphalopodes et des poissons dans la région côtière Mahrès, National Agronomic Institut of Tunisia. 131 p.
Jarboui O, Zamouri N, Hamida NBH and Missaoui H (2005) Etude des rejets du chalutage benthique sur les côtes tunisiennes. Institut national des sciences et technologies de la mer 25 p.
Khalfallah M (2013) Proposition d’amélioration du système de Statistiques de la Pêche en Tunisie : Cas du Golf de Tunis. Fisheries and Environmental Engineering thesis, University of Carthage, National Agronomic Institute of Tunisia, Department of Animal Resources, Fisheries and Food Technology, Tunisia. 62 p.
Khalfallah M, Dimech M, Ulman A, Zeller D and Pauly D (2015) Reconstruction of marine fisheries catches for the Republic of Malta (1950-2010). Fisheries Centre Working Paper #2015-43, University of British Columbia, Vancouver, Canada. 12 p.
Najar B, Sadok BM and Mohammed HA (2010) Evolution des profils des debarquements de poissons dans la region de Gabès, Tunisie. Rapp. Comm. int. Mer Médit. 39.
Nelson HD (1986) Tunisia, a country study. Foreign Area Studies. The American University, Washington, D.C. 380 p.
Official journal of the Tunisian Republic (2005) Act No. 2005-50 of June 27th 2005 on the exclusive
economic zone off the coast of Tunisia. Tunisian Goverment, Tunisia.
Salsabil D (2008) Contribution à l'étude qualitative et quantitative des rejets de chalutage dans la région nord de la Tunisie. Résultats des campagnes de prospection 2002-2008, Institut supérieur de biotechnologie de Monastir. 37 p.
Zeller D, Booth S, Craig P and Pauly D (2006) Reconstruction of coral reef fisheries catches in American Samoa, 1950-2002. Coral Reefs 25(1): 144-152.
Zeller D, Harper S, Zylich K and Pauly D (2015) Synthesis of under-reported small-scale fisheries catch in Pacific-island waters. Coral Reefs 34(1): 25-39.
0 20 40 60 80 100 120 1950 1960 1970 1980 1990 2000 2010 C at ch ( t x 1 0 3) Year Industrial a) Reported Discards Artisanal 0 20 40 60 80 100 120 1950 1960 1970 1980 1990 2000 2010 C at ch ( t x 1 0 3) Year b) Other Octopodidae Scombridae Mullidae Carangidae Sparidae Clupeidae
Figure 2. Total reconstructed catches for Tunisia, 1950-2010, by a) fisheries
sector, plus discards shown separately, with landings reported nationally overlaid as line graph (note that recreational catches are too small to be visible); and b) by main taxonomic group. Note the ‘others’ category includes 44 additional taxonomic groups, family level or higher (see Appendix Table 2).
Appendix Table A1. Reported fisheries landings for Tunisia vs. total reconstructed catch (in tonnes), 1950-2010, as well as catch by sector with discards shown separately.
Year National landings Total reconstructed domestic catch Industrial Artisanal Recreational (domestic) Discards industrial Foreign
1950 11,272 13,000 6,610 4,660 1,760 7,760 1951 14,840 16,500 8,700 6,140 1,650 8,200 1952 12,771 14,400 7,490 5,280 1,660 8,650 1953 11,277 12,900 6,610 4,670 1,580 9,090 1954 13,387 14,900 7,850 5,540 1,510 9,540 1955 10,636 12,100 6,240 4,400 1,460 9,980 1956 11,853 13,000 6,950 4,910 1,160 10,430 1957 13,883 15,300 8,140 5,740 1,410 10,870 1958 15,023 16,300 8,810 6,220 1,290 11,320 1959 14,781 16,300 8,660 6,120 1,570 11,760 1960 16,351 17,900 9,590 6,770 1,580 12,210 1961 21,366 22,900 12,530 8,840 3 1,560 12,650 1962 20,683 22,500 12,120 8,560 5 1,820 13,100 1963 25,530 29,400 14,970 10,560 8 3,860 13,540 1964 21,897 24,500 12,840 9,060 11 2,590 13,990 1965 23,323 26,600 13,670 9,650 13 3,240 14,430 1966 25,453 28,800 14,920 10,530 16 3,300 14,880 1967 32,710 37,100 19,180 13,530 18 4,420 15,940 1968 27,941 32,400 16,380 11,560 21 4,480 15,780 1969 29,631 34,100 17,370 12,260 24 4,400 16,360 1970 24,587 28,400 14,410 10,170 26 3,740 16,780 1971 27,504 31,300 16,120 11,380 29 3,750 15,420 1972 29,386 33,900 17,230 12,160 32 4,460 17,040 1973 33,559 38,300 19,670 13,890 34 4,690 18,240 1974 35,706 39,100 20,930 14,770 37 3,350 19,390 1975 37,646 41,700 22,070 15,580 40 4,060 19,180 1976 39,755 44,000 23,310 16,450 42 4,210 19,100 1977 53,210 58,700 31,200 22,010 45 5,470 18,550 1978 56,844 61,900 33,330 23,520 47 5,010 18,010 1979 57,047 62,400 33,440 23,600 50 5,300 17,460 1980 58,520 64,200 34,310 24,210 53 5,600 16,920 1981 57,471 63,600 33,690 23,780 55 6,090 16,370 1982 62,763 69,900 36,800 25,970 58 7,090 15,830 1983 66,615 75,000 39,050 27,560 61 8,340 15,280 1984 74,255 84,000 43,530 30,720 63 9,670 14,740 1985 88,195 97,800 51,710 36,490 66 9,500 14,190 1986 91,947 101,000 53,910 38,040 69 9,020 13,650 1987 98,391 108,000 57,690 40,700 71 9,550 13,100 1988 101,823 111,200 59,700 42,130 74 9,340 12,560 1989 94,338 104,100 55,310 39,030 76 9,680 12,010 1990 86,830 95,800 50,910 35,920 79 8,880 11,470 1991 84,307 92,900 49,430 34,880 82 8,530 10,920 1992 85,460 93,900 50,100 35,360 84 8,390 10,380 1993 79,823 89,300 46,800 33,020 87 9,410 9,830 1994 83,448 92,600 48,920 34,520 90 9,070 9,290 1995 70,775 80,300 43,050 27,720 92 9,390 8,740 1996 73,738 83,800 41,880 31,860 95 9,960 8,200 1997 81,194 93,000 49,200 31,990 98 11,720 7,650 1998 82,604 95,300 54,160 28,450 100 12,560 7,100 1999 82,058 95,300 54,990 27,070 103 13,100 6,560 2000 79,909 93,300 53,630 26,280 105 13,310 6,010 2001 81,385 95,000 55,260 26,130 108 13,560 5,470 2002 79,847 93,500 53,220 26,630 111 13,540 4,920 2003 82,955 97,000 56,830 26,120 113 13,890 4,380 2004 95,592 110,200 68,180 27,420 116 14,450 3,830 2005 93,855 107,000 67,260 26,590 119 12,980 3,290 2006 97,059 109,400 70,340 26,720 121 12,190 2,740 2007 90,886 102,500 65,150 25,730 124 11,490 2,200 2008 87,405 98,000 62,590 24,810 127 10,460 1,650 2009 82,136 92,800 58,280 23,850 129 10,520 1,110 2010 77,309 88,800 54,410 22,900 132 11,320 560
Appendix Table A2. Total reconstructed domestic catch (t) by major taxa for Tunisia, 1950-2010. ‘Others’ includes 44 additional taxa.
Year Clupeidae Sparidae Carangidae Mullidae Scombridae Octopodidae Others
1950 3,320 1,670 890 1,070 870 770 4,450 1951 4,360 2,190 1,160 1,410 1,140 1,010 5,220 1952 3,730 1,870 1,000 1,200 970 870 4,790 1953 3,270 1,640 880 1,060 850 760 4,400 1954 3,880 1,940 1,040 1,250 1,010 900 4,880 1955 3,050 1,530 820 990 800 710 4,200 1956 3,400 1,710 910 1,100 890 790 4,230 1957 3,980 1,990 1,060 1,280 1,040 920 5,020 1958 4,300 2,150 1,150 1,390 1,120 1,000 5,210 1959 4,210 2,110 1,130 1,360 1,100 980 5,460 1960 4,660 2,340 1,250 1,510 1,220 1,080 5,880 1961 6,120 3,080 1,640 1,980 1,600 1,420 7,100 1962 5,900 2,980 1,580 1,910 1,540 1,370 7,220 1963 7,320 3,690 1,960 2,370 1,910 1,700 10,460 1964 6,230 3,150 1,670 2,010 1,630 1,450 8,370 1965 6,640 3,350 1,770 2,140 1,730 1,540 9,390 1966 7,250 3,640 1,940 2,340 1,890 1,680 10,040 1967 9,370 4,720 2,500 3,020 2,450 2,180 12,910 1968 7,950 4,010 2,120 2,570 2,070 1,850 11,880 1969 8,430 4,240 2,250 2,720 2,200 1,960 12,250 1970 6,930 3,490 1,850 2,240 1,810 1,610 10,420 1971 7,770 3,920 2,080 2,510 2,030 1,800 11,170 1972 8,310 4,190 2,220 2,680 2,170 1,930 12,370 1973 9,520 4,810 2,550 3,080 2,490 2,210 13,630 1974 10,140 5,100 2,710 3,270 2,650 2,360 12,870 1975 10,700 5,390 2,860 3,450 2,790 2,480 14,080 1976 11,300 5,700 3,020 3,650 2,950 2,630 14,760 1977 15,250 7,700 4,080 4,930 3,980 3,540 19,250 1978 16,670 7,520 4,680 4,580 3,380 4,910 20,170 1979 16,300 7,770 4,630 4,930 4,550 4,130 20,090 1980 17,550 7,900 3,460 5,360 4,280 4,960 20,680 1981 17,110 7,770 4,380 5,640 4,070 3,690 20,960 1982 16,500 10,870 5,610 5,920 4,750 2,840 23,430 1983 19,080 9,720 5,100 6,180 4,990 4,430 25,510 1984 21,270 10,820 5,690 6,890 5,560 4,940 28,820 1985 25,260 12,820 6,760 8,180 6,600 5,870 32,280 1986 26,340 13,370 7,040 8,530 6,890 6,120 32,750 1987 28,180 14,300 7,540 9,120 7,370 6,540 34,950 1988 29,170 14,810 7,800 9,440 7,630 6,770 35,610 1989 27,020 13,760 7,230 8,760 7,070 6,270 33,980 1990 24,870 12,700 6,660 8,070 6,510 5,780 31,210 1991 24,150 12,350 6,470 7,840 6,320 5,610 30,190 1992 24,480 12,530 6,550 7,950 6,410 5,690 30,330 1993 22,860 11,740 6,120 7,430 5,990 5,310 29,870 1994 23,900 12,260 6,400 7,760 6,260 5,550 30,460 1995 17,320 12,710 6,500 5,280 1,980 2,480 33,980 1996 16,270 13,560 6,410 4,610 2,290 4,730 35,920 1997 16,510 12,810 10,180 5,250 2,380 6,350 39,530 1998 18,200 13,910 10,490 4,070 2,570 4,880 41,150 1999 18,260 14,360 9,080 4,210 3,160 2,750 43,430 2000 18,960 13,180 6,840 4,760 3,590 2,470 43,530 2001 18,780 13,300 8,000 6,150 3,270 2,450 43,100 2002 17,840 13,610 7,340 5,180 2,860 3,420 43,250 2003 18,300 13,740 8,710 6,210 2,650 3,380 43,960 2004 21,600 13,060 16,140 6,200 3,180 5,520 44,450 2005 26,210 13,010 14,430 5,510 2,230 4,750 40,800 2006 32,700 12,910 12,520 5,290 2,700 3,210 40,040 2007 29,910 12,540 12,080 5,750 3,090 3,350 35,790 2008 29,350 12,300 11,790 5,880 3,380 2,080 33,200 2009 22,510 12,120 10,300 5,290 2,770 3,140 36,640 2010 21,030 11,440 9,630 4,980 2,620 2,990 36,070