HAL Id: hal-02988645
https://hal.umontpellier.fr/hal-02988645
Submitted on 20 Nov 2020HAL is a multi-disciplinary open access
archive for the deposit and dissemination of sci-entific research documents, whether they are pub-lished or not. The documents may come from teaching and research institutions in France or
L’archive ouverte pluridisciplinaire HAL, est destinée au dépôt et à la diffusion de documents scientifiques de niveau recherche, publiés ou non, émanant des établissements d’enseignement et de recherche français ou étrangers, des laboratoires
Pierre Chevallier, Jean-luc Seidel, Jean-Denis Taupin, Ornella Puschiasis
To cite this version:
Pierre Chevallier, Jean-luc Seidel, Jean-Denis Taupin, Ornella Puschiasis. Headwater Flow Geochem-istry of Mount Everest (Upper Dudh Koshi River, Nepal). Frontiers in Earth Science, Frontiers Media, 2020, 8, �10.3389/feart.2020.00351�. �hal-02988645�
Headwater Flow Geochemistry of Mount Everest
(Upper Dudh Koshi River, Nepal)
Pierre Chevallier1*, Jean-Luc Seidel1, Jean-Denis Taupin1, Ornella Puschiasis2 1
1Laboratoire HydroSciences Montpellier (CNRS, IRD, Université de Montpellier), Université de
2
Montpellier, 163, avenue Auguste Broussonnet, CC 57, 34090 Montpellier, France 3
2Centre d’Etudes en Sciences Sociales sur les Mondes Africains, Américains et Asiatiques
4
(INALCO, Université de Paris, IRD), 65, rue des Grands Moulins, 75013 Paris, France; Associate 5
Scientist, Centre d’Etudes Himalayennes (CNRS) 6 * Correspondence: 7 Pierre Chevallier 8 pierre.chevallier@ird.fr 9
Keywords: major ions, trace elements, stable isotopes, precipitation, river flow, water use, 10
Central Himalaya. 11
Abstract 12
The aim of this work, conducted in the upper valley of the Khumbu on the southern part of Mount 13
Everest, is to approach in parallel three topics: (i) the dynamics of the water geochemistry, major ions 14
and trace elements; (ii) the stable water isotopes of precipitation and rivers; and (iii) the water uses by 15
the inhabitants. As in most mountain environments, the Khumbu area is threatened by climate change, 16
which impacts the cryosphere and consequently the people and the landscapes. Moreover, changes in 17
water use are also related to new needs stemming from tourism, which strongly affect local livelihood. 18
For the first two topics, new results are presented. They provide details on the global chemical quality 19
of the river water and show how certain elements are seasonally influenced and how other elements 20
allow us to distinguish the water origins within the study zone. Beside the use of stable isotopes to 21
determine mainly the origin of the water flow in the rivers, the isotopic patterns confirm the double 22
climatic influence of the westerly fluxes in the winter season and of the Asian monsoon in the summer 23
season. Regarding water use, the study confirms that the chemical quality of the water course is good,
24
but does not conclude on the biological quality, which has not been investigated. In conclusion, we 25
attempt to predict the future of the geochemistry patterns submitted to the double pressure of climate 26
change and the surge in tourism. 27
1 Introduction 28
The future of the cryosphere (glacier and snow cover) in the Hindu Kush Himalaya high mountains is 29
a major concern (Pörtner et al. 2019; Wester et al. 2019); it is threatened not only by global warming 30
due to greenhouse gas emissions, but also by local air pollution due to the atmospheric brown cloud, 31
and especially the transportation and deposition of black carbon aerosol (Bonasoni et al. 2010; Kaspari 32
et al. 2011; Jacobi et al. 2015) from human activities in the densely inhabited regions of the south and 33
southwest of the central Himalaya mountain range as well as the rapid increase of tourist activity 34
(Jacquemet 2018). 35
In this context, the Paprika and Preshine projects (see Funding section) joined the efforts of Nepalese, 36
French, and Italian research teams (see Acknowledgments section) to explore the impact of these 37
anthropogenic constraints on the water cycle dynamics in the Dudh Koshi River Basin (Figure 1) on 38
the south side of Mount Everest (8847 m). Several reasons justified the choice of this study zone that 39
is characterized by two confluent watercourses, the Imja River and the Khumbu River, respectively, 40
originating from the southern and western faces of the main range of Mount Everest and its satellite 41
summits. 42
Among these reasons, the following are particularly important in the context of this article: 43
• Relative facility of access with the Everest Base Camp Trail; 44
• Settlements at high altitude (above 3500 m) where inhabitants are facing a wide range of
45
changes beside climatic one as a more tourism-centered economy involving integration to
46
global markets, agropastoral and lifestyles changes, and new migration patterns (Puschiasis
47
2019);
48
• Presence of a high-altitude scientific laboratory, the Pyramid of Lobuche (5050 m), 49
administrated by the Italian Ev-K2/CNR association in agreement with the Nepalese Academy 50
of Science and Technology (NAST). 51
In this framework, a working task of the Paprika and Preshine projects has been devoted to the 52
identification of water resources and the perception of this held by the local inhabitants. In the
53
preliminary exchanges with the scientists of the Paprika and Preshine projects, the Khumbu valley
54
inhabitants manifested a deep concern regarding their water resource and its future. They were acutely
55
aware that climate and economic changes will have a direct impact on the environment in which they
56
live. As a consequence, it appears as a necessity to also aboard the climate processes and the water
57
balance through the geochemical angle, even though this was not the primary route chosen for these
58
projects.
59
The village of Pangboche, which includes several settlements, was chosen as the most convenient. The 60
main settlement is located at an elevation of approx. 3950 m on the right bank of the Imja River, 4 km 61
after the confluence of its two main branches: the Khumbu River flowing from the north and the Upper 62
Imja River flowing from the west. An important concern of the local population is the future of the 63
water resources, not only in quantity, but also in quality. Considering the latter point, it was also stated 64
that the water quality could be a substantial indicator of the water flow processes, especially regarding 65
the different origins of these flows: glacier melt, snowmelt, groundwater, or direct surface flow. 66
During the past decade, geochemistry studies have been conducted of the Himalaya water flows (e.g., 67
Jeelani et al. 2011; Ghezzi et al. 2017), but no study has been undertaken in the context of very high 68
altitudes covering dynamically an entire year. This issue underlines the exploratory character of the 69
current study, which, however, does not aim to address all the questions raised in this exceptional 70
framework. 71
Numerous isotopic precipitation and river studies have been carried out in Himalaya at the local or 72
regional scale in the past few years (Garzione et al. 2000; Wen et al. 2012; Jeelani et al. 2013; Balestrini 73
et al. 2014; Balestrini et al. 2016; He and Richards 2016; Ren et al. 2017; Florea et al. 2017; Jeelani 74
and Deshpande 2017; Jeelani et al. 2017; Guo et al. 2017; Li and Garzione 2017; Kumar et al. 2018; 75
Verma et al. 2018; Shen and Poulsen 2019; Singh et al. 2019). The main aim of these studies was to 76
link the isotopic variability recorded in precipitation to climate parameters and air mass circulation 77
and the transfer of this isotopic signal through the global and complex altitudinal hydrosystem from 78
glaciers to tropical valleys. Regional precipitation studies of the southern external border of Himalaya 79
(Jeelani and Deshpande 2017) from Kashmir (western Himalaya) to Assam (eastern Himalaya), or of 80
the whole Tibetan Plateau (Li and Garzione 2017), showed that the isotopic variation observed in 81
precipitation across the Himalayas conforms to the regional repartition of the two main moisture 82
out in central Nepal, Kathmandu, and the north of Kathmandu (Wen et al. 2012) as well as in the 84
Khumbu Valley at the Pyramid Laboratory (Balestrini et al. 2014; Balestrini et al. 2016). 85
The current paper aims to present, analyze and discuss, on the one hand, the geochemical behavior of 86
the water flows used by the inhabitants of Pangboche for their activities, during the year 2011, 87
exploring the conductivity, pH, major ions, and trace elements dissolved in the water; and, on the other 88
hand, the water-stable isotopes in the precipitation and river flows of the Khumbu area, during the 89
period from November 2014 to May 2017. The paper aims to link these data to the water origins and 90
seasonal variability in the context of global change. 91
2 Study area and methods 92
2.1 Study area 93
The climate of the study area is dominated from June to September by monsoon dynamics (Wang 94
2006; Bookhagen and Burbank 2010; Immerzeel et al. 2010; Turner and Annamalai 2012), but winter 95
and pre-monsoon precipitations can occur from December to April due to the Western Disturbances, 96
which are part of the westerlies entry, originating from the Mediterranean region (Pisharoty and Desai 97
1956; Madhura et al. 2015). 98
Above 5000 m in general, and lower during the winter, satellite imagery shows that the snow cover 99
can be wide; however, the difficulty of monitoring snowfall in high mountains (Sevruk 1989; Tahir et 100
al. 2011) does not allow us to quantify precisely the volume of snowfall in the study area. Recent 101
studies have explored the spatial distribution of precipitation in this area (Savéan et al. 2015; Gonga-102
Saholiariliva et al. 2016; Eeckman et al. 2017; Mimeau et al. 2019). They roughly show, beside a large
103
local heterogeneity mainly due to the steep relief, the valley orientation and the slope aspect, a positive
104
gradient with the altitude until a peak of annual precipitation between 2500 and 3200 m and a negative
105
one above.
106
The geology of the southern area of Mount Everest has been detailed by Bortolami (1998) and by 107
Searle et al. (2003). It is dominated by Precambrian-Early Paleozoic sillimanite gneisses in the high
108
faces, which alternate in some places with intrusive Miocene leucogranites. The highest zone (Everest,
109
Lhotse), above 6500 m, presents Ordovician shale series and limestone layers. Except for those slopes 110
covered by glaciers or rock glaciers, the valley slopes and valley bottoms are mainly composed of 111
fluvio-glacial deposits and debris, with the presence of moraines of different levels and ages. 112
According to Bortolami (1998), the composition of the rocks leads to a low weathering and a low 113
impact on the chemical composition of the flows. The same author notes that the aquifers located in 114
the debris material have a high porosity. Their thicknesses are largely unknown. By contrast, the 115
fissured rocks, which constitute the bed rock, are generally impermeable. A few other studies are 116
devoted to groundwater storage in the Himalayas. Although their findings are not very helpful with 117
regard to the geological characteristics (Dongol et al. 2005; Jeelani 2008) or the scale of the approach 118
used (Andermann et al. 2012), these studies highlight a notable contribution of snow and glacier melt
119
to groundwater. Andermann et al. (2012) assess the storing capacity of the whole Dudh Koshi basin 120
(3700 km²) to be approx. 300 mm, i.e., less than 20% of the average annual discharge, which represents 121
a low impact of the groundwater in our study area, considering that most of the reservoirs are very 122
likely concentrated in the bottom material of the middle and low elevations. Other authors, including 123
Nepal et al. (2014), Savéan et al. (2015), and Eeckman et al. (2019), consider in their modeling 124
approaches that the volume stored over a long period in groundwater reservoirs is negligible. 125
2.2 Water resources for local population 126
The Khumbu zone (Figure 1) encompasses an area of approximately 1100 km² along the border 127
between Nepal and the Tibet Autonomous Region of China. It is included in the Nepalese 128
administrative division of the Solu-Khumbu district. The area is divided into three major distinct 129
valleys—Imja Valley, Dudh Koshi Valley, and Bhote Khosi Valley—forming a U-shape, a testimonial 130
to the glacial erosion and draining of the main rivers in the region. The Dudh Koshi first meets the 131
Imja Khola on the eastern side of the region, and it then meets the Bhote Koshi before running out of 132
Khumbu toward the south into a deep gorge. Khumbu settlements span elevations from 2805 m 133
(Jorsalle) to 5170 m (Gorak Shep). The villages are located extensively on the rare alluvial terraces, 134
hanging valleys, and amphitheater slumps and comprise mostly south- and north-facing slopes. 135
Khumbu corresponds to the former Village Development Committees (VDCs, before administrative 136
restructuring in 2017) of Khumjung and Namche hosting approximately 3500 residents belonging 137
mostly to the Sherpa ethnic group with a growing number of non-Sherpa residents (Rais, Tamangs, 138
Magar, and Bahun-Chhetri). With the establishment of the Sagarmatha National Park (SNP) in 1976 139
and its designation as a UNESCO World Heritage Site in 1979, the economy of the region has shifted 140
to a more tourism-centered form (Spoon 2011). The number of visitors to the SNP increased to 45,000 141
in 2017 (Jacquemet 2018) leading to an important trekking and expedition tourism hub, including the 142
popular trekking route to Mount Everest Base Camp. 143
All these territorial and economic mutations have led to profound changes in water resources, 144
increasing needs previously limited to domestic (drinking water, cooking, personal hygiene), 145
agricultural (irrigation of barley), and religious purposes (water-driven prayer wheels, water spirit 146
shrine) (Aubriot et al. 2019). Water is taken directly from springs or small streams flowing through 147
the settlements or channeled by pipes to houses, since large rivers are not the primary source of water 148
for villagers (McDowell et al. 2012). In Pangboche village, changes appeared some 20 years ago with 149
the installation of running water supplying guest houses, a bottled-water manufacturing plant in 2003, 150
and a micro-hydroelectric plant in 2004 (Puschiasis 2015). Water has become a “commodity” (André-151
Lamat 2017) with a proliferation of uses for tourism (shower, flushing toilets, bottled water) and for 152
electrification. Khumbu inhabitants have become highly dependent on reliable water supply systems 153
to respond to the new types of usages, which is key to local development. Nevertheless, there is a lack 154
of a proper management system at a regional level to reduce the pressure on water resources. 155
2.3 Methods of sampling and analysis 156
Labels A to Y refer to the sampling points shown in Figure 1 and described in Table 1. They are 157
ordered by altitude from bottom to top. 158
2.3.1 Conductivity, major and trace elements 159
Temperature, pH, and electrical conductivity (Tref =25°C) were measured in the field, using a portable
160
pH meter and conductivity meter (WTW 3210i®). Water samples (125 mL) were filtered in the field 161
with a PP syringe and Durapore® membrane (0.22 µm) and stored in acid-washed HDPE bottles. 162
Aliquots for major cations and trace elements were acidified with ultrapure HNO3 (1‰ v/v). Samples
163
were stored at 4°C before reaching Montpellier for analysis. 164
Five sites in the surroundings of Pangboche village were selected for the water sampling (G, H, I, J, 165
L): 166
• The G point on the Imja River represents the reference site for the main river after the 167
confluence of the Khumbu branch and the Imja branch. These catchments include, on the one 168
moraine lake, which concentrates the melting runoff from the majority of the glaciers of the 170
upper Imja Valley. 171
• The Tauche point (J) on the east stream of the southern slope of the Tauche Peak (6542 m). 172
This watercourse collects the melt flow from the very small glacier located on the peak summit. 173
• The Teouma (L) and Kisang (I) points on the central stream flow do not receive water of glacial 174
origin. Because this watercourse flows through the village of Pangboche, the first point was 175
chosen upstream and the second downstream from the village in order to analyze how the water 176
quality of the stream is influenced by the village. 177
• The Chomar (H) source on the west side of Pangboche was also sampled, because its water 178
was drawn and bottled in 2011 by a small company to be sold to tourists under the brand name 179
of “Namaste Sabina Tabuche Beiu.” After 2013, the company no longer produced bottled water 180
for unknown reasons. 181
The water flows were sampled 18 times between February and November 2011 following the complete 182
annual cycle (Figure 2). A total of 12 samplings benefitted from a complete protocol (64 samples) and
183
6 more samplings, in winter and autumn, from measurements of electrical conductivity and pH only.
184
Two complementary water samples were collected in June 2012 in Imja Lake (Y) and a rainfall 185
reference was taken in the settlement of Pheriche (P). In addition, several measurements of electrical 186
conductivity were carried out in different watercourses within the Imja River basin. 187
Chemical analyses were performed at the HydroSciences water chemistry laboratory in Montpellier 188
(France). Total alkalinity was measured by acid titration with HCl 0.01 N (Gran method). Major ions 189
(Cl-, NO3-, SO42-, Ca2+, Mg2+, Na+, and K+)were analyzed by ionic chromatography (Dionex ICS
190
1000®). The precision error was < ± 5%. Trace elements (Li, B, Al, Si, Ti, V, Cr, Mn, Fe, Co, Ni, Cu, 191
Zn, As, Rb, Sr, Mo, Cd, Cs, Ba, Pb, and U) were analyzed with Q-ICPMS (X series2 Thermo 192
Scientific®) on the AETE (Analyse des Elements en Trace dans l’Environnement) technical platform 193
of Montpellier University. The precision error was < ± 8%. 194
2.3.2 Stable isotopes 195
Six sampling campaigns in rivers located between 1985 m (Kharikola, label A) and 5000 m (foot of 196
glaciers, X, Y) were carried out (November to December 2014, November 2015, November 2016, 197
March 2015, May 2016, May 2017). 198
In addition, during the study interval from November 2014 to December 2016, monthly rainfall was 199
collected at Pangom (2890 m, E) using a homemade rain gauge with an 80-cm² cross-section in a 5-L 200
plastic tank inside an isotherm box, which was linked to the gauge with a flexible pipe and hermetically 201
sealed to avoid direct evaporation. 202
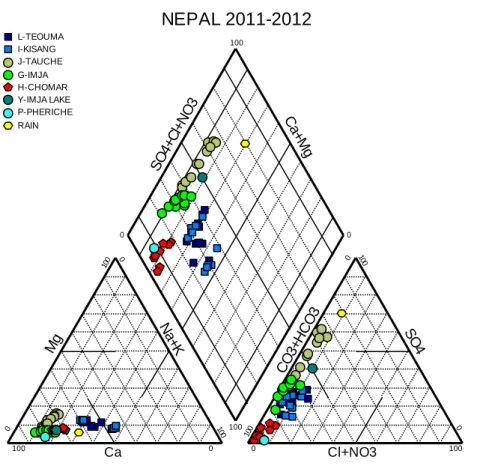
The rainfall and river samples were stored in amber glass bottles (25 mL) with conical plugs and 203
transported in shaded conditions to the laboratory in Montpellier. 204
Water-stable isotopes were measured with an Isoprime® mass spectrometer on the LAMA platform 205
of HydroSciences Montpellier (LAboratoire Mutualisé d’Analyse des isotopes stables de l’eau). The 206
oxygen isotopic composition was measured after equilibration of 200 µL of water with CO2 via the
207
dual-inlet technique, with an overall precision of ± 0.06‰. Deuterium was measured by continuous-208
flow using a Eurovector Pyr-OH ® elemental analyzer converting 0.5-µL injections of water to H2 on
209
Cr powder at 1070°C, with an overall precision of ±0.6‰. 210
Water isotopic compositions are reported as δ18O and δ2H on the V-SMOW scale.
3 Results 212
3.1 Electrical conductivity and pH 213
Figure 2 shows the dynamics of the electrical conductivity and pH during the year 2011 at the five 214
measurement points (G, H, I, J, L) of the Pangboche area. 215
Regarding electrical conductivity, the absolute values are below 60 µS/cm. These very low values 216
indicate the slight level of mineralization of the flows. Specifically, the five sites present two main 217
behaviors: (i) Kisang and Teouma located on the same watercourse have an almost identical and 218
constant extremely low conductivity during the year (approx. 20 µS/cm), (ii) for Tauche and Imja the 219
values are 2–3 times higher, with a slight decrease during and shortly after the monsoon (July-220
October), meaning that the increasing runoff generates a dilution effect. The Chomar site fits between 221
the two, with a decrease during the monsoon season. 222
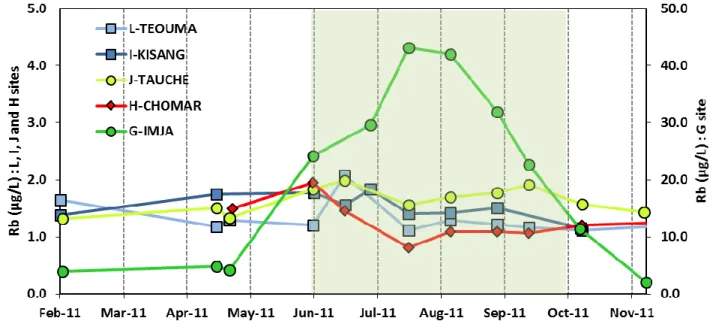
The pH varies between 7 and 8, except for Pangboche-Chomar bottled drinking water (8.6) and for the 223
rain sample (6.8). The different sites present a short-term variability from date to date. However, two 224
main behaviors can be observed: (i) for the slope water courses (Tauche, Kisang, Teouma, and 225
Chomar), the amplitude of the short-term variability reaches 0.5 and a relative dilution effect appears 226
during the monsoon; (ii) the valley river (Imja) has an almost stable pH value (≈ 7.8) during the course 227
of the year, but higher than the pH of the slope water courses. 228
3.2 Major ions 229
The following ranges in concentration were shown by the major cations and anions: Ca2+ (1.1-11.1
230
mg/L), Mg2+ (0.1-0.7 mg/L), Na+ (0.4-1.8 mg/L), K+ (0.2-1.3 mg/L), HCO3-(5.1-32.3 mg/L), SO4
2-231
(0.4-14.5 mg/L), NO3- (0.1-1.5 mg/L), Cl-(0.1-0.6 mg/L). Silica ranges from 1.3 to 20.8 mg/L. Average
232
concentrations of major ions are reported in Table 2. The Piper diagram for major cations and anions 233
(Figure 3 and Table 2) shows variations in the chemical composition of the surface waters, which is 234
dominated by Ca2+ and HCO3-. The waters are mainly of Ca+-Mg+-HCO3- type. Waters influenced by
235
glacier melt (Tauche and Imja sites) exhibit an enrichment in SO42-, particularly for the Tauche site
236
during the monsoon season. Ca2+ is the dominant cation contributing more than 70% to the cation 237
budget, followed by Na+ (< 20%) and Mg2+ (<10%). In Kisang waters and to a less extent in Teouma 238
waters, before the monsoon season, Na+ is the dominant cation. Cl- and NO3- concentrations are very
239
low, <0.6 mg/L and <1.5 mg/L, respectively. The HCO3- contribution to the anion budget ranges
240
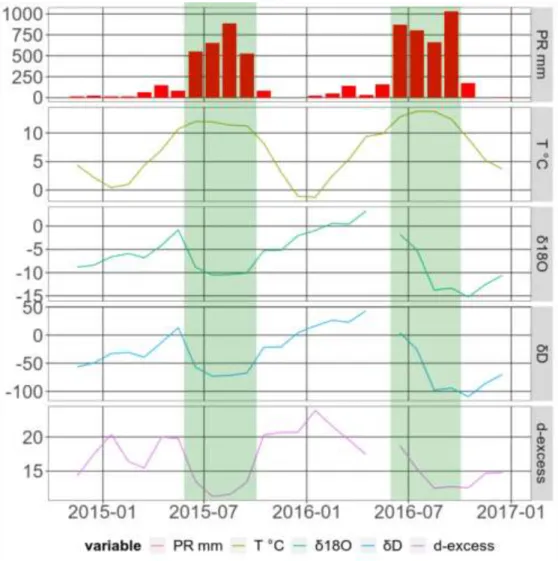
between 60 and 90%, except for Tauche water during the monsoon season, which evolves to a 241
Ca+-Mg+-SO42- type. The origin of sulfates is found in sulfide oxidation via glacier runoff, as suggested
242
by Hodson et al. (2002), because no anhydrite or gypsum have been identified in the region. The plot 243
of Ca++Mg++Na+ versus HCO3-+SO42- from all the waters shows that most of the samples lie close to
244
the 1:1 line, indicating the dissolution of calcite, dolomite, silicates, and sulfides (Figure 4) as
245
suggested by Crespo et al. (2017). 246
For all major elements, including SiO2, the temporal evolution of the concentrations displays a dilution
247
effect during the monsoon season, except for the Imja site where an increase in the concentration of all the 248
major elements occurs during the same season, especially in August 2011, which corresponds to the 249
maximum glacier melt. This enrichment demonstrates that the glaciated catchment undergoes more intense 250
chemical weathering taking place beneath the glacier than catchments that do not have a glacier because
251
the CO2 dissolved in the proglacial zone with the aerated flow conditions characteristic of the meltwater
252
environments may promote chemical weathering by maintaining the acid potential of the water (Reynold
253
& Johnson 1972) in Singh and Hasnain (1998). 254
3.3 Trace elements 255
Average concentrations for measured trace elements are presented in Table 3. Dissolved trace elements 256
such as Li, B, Ni, Zn, Cu, Rb, Sr, Ba, and U show a dilution effect during the monsoon season at the 257
Teouma, Kisang, Tauche, and Chomar sites whereas the Imja site in the same season exhibits, except 258
for boron, a high concentration increase, by a factor of 10 to 100, as shown, for example, for rubidium 259
(Figure 5). The origin of this increase can be found in the glacier melt enriched in subglacial material 260
leached by the heavy rain during the monsoon. This phenomenon underlines the integrating power of 261
the Imja Khola River. On the other hand, Al, Ti, Fe, and Mn to a lesser extent increase in all the sites 262
during the monsoon season. In comparison with the Upper Mustang rivers in the western region of
263
Nepal Himalaya (Ghezzi et al. 2017), the concentrations are elevated, from 5 to 6600 µg/L for Al, from 264
0.5 to 485 µg/L for Ti, from 5 to 7130 µg/L for Fe, and from 2 to 200 µg/L for Mn. These elements 265
are mobilized by the surface runoff during the monsoon season and their common origin is to be found 266
in the weathered bedrock. 267
In regards of the WHO drinking water guidelines, no major or trace elements exceed the recommended
268
values, even if the concentrations for some major or trace elements of the Imja River are elevated. 269
3.4 Stable isotopes 270
Three complete years (2014–2016) of meteorological data (P, T) are available at the Pangom station 271
(2885 m, label D) (Chevallier et al. 2017), and a monthly sampling of rainfall for water isotope analysis 272
was carried out between November 2014 and December 2016. The comparison of all the results is only 273
qualitative owing to the small temporal record at the Pangom weather station. 274
The mean annual temperature measured at Pangom in 2015 was 6.7°C (7.6°C in 2014 and 8.0°C in 275
2016) with lower temperatures in the dry season (min. in December: -1.1°C) and higher temperatures 276
during the monsoon season (Figure 6) (max. in June: 12°C). In the higher part of the Khumbu valley 277
at the Pyramid Laboratory station, monthly temperatures follow the same pattern ranging between -12 278
and 4°C for the 2012–2014 interval (Balestrini et al. 2016). 279
3.4.1 Precipitations 280
Annual rainfall in Pangom was 3046 mm in 2015 (3683 mm in 2014 and 3947 mm in 2016). The South 281
Asia monsoon (JJAS) accounts for more than 80% of the precipitation amount (Figure 6) (84.7 to 282
86.1% from 2014 to 2016) with no specific rainier month in this season (JAS between 888 and 283
1075 mm). 284
During the sampling interval (November 2014 to December 2016, with a gap in May 2016), a large 285
isotopic variation is observed (Figure 6): 3.25 to -15.26‰ V-SMOW for δ18O and 43.3 to -109.5‰
286
V-SMOW for δ2H. Figure 6 shows the isotopic composition of all precipitations giving a local water 287
line following the equation: 288
δ2H = 8.57 δ18O + 20.5 (R2 = 0.997; n = 25)
289
The slope is slightly higher than the slope of the global meteoric water line (GMWL,
290
δ2H = 8.13 δ18O + 10.13) defined by Rozanski et al. (1993) and also shows an intercept d = 20.5 higher,
291
close to the meteoric line of the precipitation in the southern Tibetan plateau (Yao et al. 2013): 292
δ2H = 8.89 δ18O + 23.0 (R2 = 0.980; n = 374).
293
At the Pyramid Laboratory station at the weekly scale between June 2012 and December 2013, 294
Balestrini et al. (2016) found: 295
δ2H = 8.17 δ18O + 16.6
In Pangom, if one distinguishes between the seasons, the equations are: 297 ONDJFMAM (non-monsoon) δ2H = 8.46 δ18O + 20.6 (R2 = 0.997; n = 17) 298 JJAS (monsoon), δ2H = 8.52 δ18O + 18.4 (R2 = 0.999; n = 8). 299
The more enriched monthly values above -1‰ in δ18O (n=5) do not show an evaporation mark; a high 300
deuterium excess is observed (between 17.4 and 21.6‰) for low to medium rainfall amount (21 to 142 301
mm). These values belong to the extra-monsoon season and are linked to notable continental recycling 302
mainly from non-fractional processes such as transpiration or soil evaporation. In the regional study 303
by Jeelani and Deshpande (2017), stations in Nepal and Assam also showed a high d-excess (> 20‰) 304
associated with a high δ18O > -1‰ value, suggesting a dominant influence of transpiration, increasing
305
the δ18O of vapor over the forest floor (Lai and Ehleringer 2010).
306
The isotopic values recorded during the 2 years, including monsoon and extra-monsoon seasons, 307
display different patterns, globally more depleted in the monsoon season (2015, -10.05‰; 308
2016, -8.48‰, weighted mean for δ18O) and more enriched in the extra-monsoon season 309
(2015, -4.48‰; 2016, -0.81‰, weighted mean for δ18O). The much more enriched values in the extra-310
monsoon season in 2016 could be an effect on isotope composition and deuterium excess in the 311
beginning of the monsoon season with a possibly late isotope re-equilibration of the air mass, perhaps 312
due to higher mixing with the recycled continental vapor. Indeed, in June and July 2016, isotope values 313
were more enriched than in June and July 2015, also with a greater d-excess. Then, it is only in August 314
2016, in the middle of the monsoon season, that isotope values and d-excess seem to be consistent with 315
isotope values in the monsoon season, and this continues until the beginning of the extra-monsoon 316
season (October 2016) with a dephasing of 2 months. 317
The relationship between isotope values and temperature (temperature effect) shows an inverse
318
correlation with a low coefficient (R = -0.336; n = 25) as well as with rainfall (amount effect) with
319
R = -0.392, which are not significant using a t-distribution with n-2 degrees of freedom at a
320
significance level a = 0.05; the critical values associated with df = 23 are ±0.396 (Bravais-Pearson
321
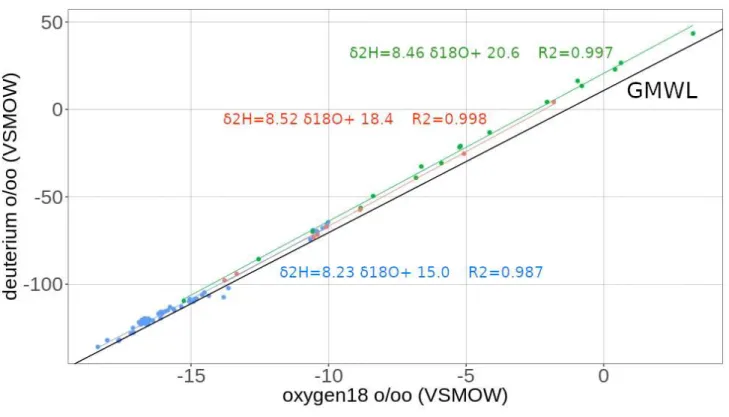
table). The monsoon season corresponds to a more depleted rainfall (Dansgaard 1964). In fact, the 322
main effect on isotope variability in our site is the origin of air masses, as shown in previous regional 323
studies cited in this article or in the local Khumbu Valley at the Pyramid Laboratory (Balestrini et al. 324
2016). 325
The year 2015, which is complete, gives a weighted annual value (Σ(Pi δi) / ΣPi) of -9.24‰ V-SMOW
326
for δ18O and -60.1‰ V-SMOW for δ2H (2016: 95.9‰ of rainfall, -8.20‰ and -50.6‰), which is in
327
good agreement with the altitude effect in the region, regarding the results obtained in Kathmandu 328
(1320 m, -8.7‰) and Nyalang (3811 m, -11.3‰) (Wen et al. 2012; Balestrini et al. 2016); at the 329
Pyramid Laboratory station (5050 m), the isotope content during the monsoon season in 2012 and 2013 330
does not show a large variation (-17.74 to -17.81‰ in δ18O). The gradient is -0,23‰ / 100 m, in good 331
agreement with the range of the isotope altitudinal gradient in Himalaya (-0.15, -0.33‰) (Wen et al. 332
2012). 333
The d-excess is a good indicator for evaluating the contribution of different water vapor sources (Clark 334
and Fritz 1997). In Himalaya, low d-excess values characterize moisture coming from the Indian 335
Ocean and the Bay of Bengal, and high values continental moisture carried by the Western Disturbance 336
(Jeelani and Deshpande 2017). At Pangom in 2015 and 2016, d-excess values during the monsoon 337
season were between 11.3 and 18.7‰ (n = 8, mean = 13.6‰), while in the two extra-monsoon seasons 338
(2015 and 2016) d-excess values were between 14.3 and 23.9‰ (n = 14, mean = 19.1‰). 339
At the Pyramid Laboratory, we have the same pattern for isotope content and d-excess during the 340
monsoon (depleted values up to -30‰ for δ18O and d-excess < 15‰) and the extra-monsoon seasons 341
(more enriched values and high d-excess until 26‰). The difference observed with the local meteoric 342
line (LML) in d-excess is due to the different repartition of measurements in the monsoon season 343
(n = 38) and the extra-monsoon season (n = 8). 344
We note in the total observed interval a good correlation between oxygen-18 and d-excess values 345
(R2 = 0.62; n=25), which reaches R2 = 0.72 if the more enriched point is removed (April 2016); this 346
may indicate a slight alteration in isotope air mass signal by the evaporation process. 347
To conclude, in Pangom as in other Himalayan sites, the change in air circulation patterns, marine 348
vapor from the Indian Ocean and the Bay of Bengal, on the one hand, and continental vapor from the 349
Western Disturbances, on the other, modify the isotope composition and d-excess of precipitation. 350
3.4.2 Rivers 351
For the river isotope sampling, in the general spatial pattern, depleted values are observed in the 352
headwaters of the streams and enriched values at lower elevations of the catchments. The water isotope 353
variability of stream water shows a lower variability with respect to local precipitation at Pangom, in 354
spite of altitudinal sampling (1981–4935 m) and six campaigns between November 2014 and May 355
2017 (local sampling between one and six campaigns) that ranged from -10.10 to -18.39‰ for δ18O 356
and from -64.5 to -135.8‰ for δ2H (Figure 7, Table 4). The sampling was carried out at the beginning 357
of the extra-monsoon season, with possibly the influence of the end of the monsoon season, and at the 358
end of the extra-monsoon season. However, the variability registered is mainly very low, lower than 359
0.6‰ for δ18O for 89% of local stations. Two stations with at least five samplings (D – Pangom and J
360
– Tauche) show a large difference; both stations in March 2015 have a high depleted value (-16.65 and 361
-16.53‰ in δ18O, respectively); not considering this result, Pangom has a mean value of -10.47‰ with 362
a range interval of 0.45 (n = 4) and Tauche has a mean value of -15.31‰ with a range interval of 1.22 363
(n = 5). Both sampling points are located in non-glaciated catchment for Pangom and small glaciated 364
catchment (less than 1% of the basin area) for Tauche. The river in this extra-monsoon season with 365
few precipitations (at Pangom in 2015, precipitation amounts are 19 mm in January, 19 mm in
366
February and 66 mm in March) is supplied mainly by superficial aquifer whose main characteristic is 367
an isotopic composition relatively constant over the year at a local altitudinal point (Jeelani et al. 2018). 368
The main hypothesis to explain this important change is the presence of snow cover at higher altitude 369
with more depleted isotopic content during this season, which was melting and supplied by direct 370
runoff from the river. 371
Although there were no measurements during the monsoon season in this study, the works of 372
Balestrini, Polesello, and Sacchi (2014) in the high part of the Khumbu Valley (> 4200 m) have shown 373
a higher variability (2‰) close to glacier and morainic lake inflow and low variability (0.39‰ in δ18O)
374
at Pheriche (label P in Figure 1) during monthly sampling between July and October 2008. The authors 375
suggest that the area extension of the hydrological basin buffers the isotopic signal. Another fact is the 376
difficulty to link directly the isotope content of monthly precipitation and isotopic content of river 377
water at the same time. 378
The isotopic composition of the stream water in the whole study interval is close to the local 379
precipitation regression line (Figure 7) following the equation: 380
δ2H = 8.23 δ18O + 15.0 (R2 = 0.987; n = 58)
For each season the slope and the d-excess value can differ greatly, but the number of samples is small 382
(except for May 2017, which is close to the global river equation) and these variations are not
383
representative of a particular process: 384 November 2014 δ2H = 8.11 δ18O + 4,1 (R2 = 0.972; n = 5) 385 March 2015 δ2H = 7.56 δ18O + 22.2 (R2 = 0.999; n = 9) 386 November 2015 δ2H = 6.71 δ18O + 9.3 (R2 = 0.934; n = 11) 387 May 2016 δ2H = 8.24 δ18O + 16.3 (R2 = 0.994; n = 10) 388 November 2016 δ2H = 8.08 δ18O + 13.3 (R2 = 0.992; n = 9) 389 May 2017 δ2H = 8.47 δ18O + 19.1 (R2 = 0.997; n = 17) 390
The mean d-excess value at each sampling point is between 5.6 and 14.4‰. For the whole dataset, 391
d-excess values vary between 3.1 and 15.6‰ with 19% of samples lower than 10‰, which are altered 392
by an evaporation process. The samples with d-excess between 10 and 14‰ do not show a special 393
trend, likely linked to glacier melt and aquifer discharge where the main accumulation and recharge 394
are during monsoon season when the d-excess value of the monthly precipitation is between 11 and 395
14‰. For d-excess values higher than 14‰, there is possibly a partial contribution of rainfall or melted 396
snow during the extra-monsoon season where d-excess values of monthly precipitation can reach 24‰ 397
during the 2014–2016 interval. 398
Contrary to the results of another study in southern Himalaya by Wen et al. (2012), who found a very 399
good correlation between the isotope content in the Boqu River and altitude (n = 39, R2 = 0.90, Sept. 400
2011) between 1845 and 5060 m, the relationship between the altitude of the sampling sites and isotope 401
content is not well correlated (R2 = 0.399; n=18) very likely due to the heterogeneity of the catchments 402
and their glacier cover varying between 0% and 70%. The river in catchments with glacier cover at all 403
altitudes is mainly controlled by the ice melting and by higher depleted value with respect to no glacier 404
catchments. This is the case of the Phakding samples, located at a low altitude (2620 m), which show 405
an isotope content in δ18O of -15.89‰, with a 20.9% glacier cover (Everest catchment). By
406
comparison, the weighted mean annual rainfall in Pangom (2890 m) yields -9.24‰, in better 407
accordance with the isotope values collected in the Pangom River (watershed without glacier) and 408
reflecting the isotope composition of rainfall in the whole study area (-11.71‰). 409
By contrast, rivers in catchments without any or with small glacier cover (Kharikola, Pangom, Tauche, 410
Chomar, Teouma), spring (Lobuche spring), or surface flow not connected to glacier melt such as wet 411
saturated pastures (kharka in Nepali; e.g., Phulung Kharka) show (Figure 8) a better correlation with 412
altitude (R2 = 0.809; n = 8). Focusing only on the river sampling points that depending on glacier melt,
413
the correlation with altitude is significantly improved (R2 = 0.525; n = 10). Indirectly, the lower the 414
altitude, the more the glacier component in the river decreases and the more the aquifer component 415
increases. 416
The isotopic altitude gradient for river sampling in no or in a lightly glaciated catchments shows for 417
δ18O a value of -0.20‰/100m; this is in the range (-0.11/- 0.36‰/100 m) of other studies referenced
418
by Wen et al. (2012) and Ren et al. (2017) in Himalaya and is close to results found by Florea et al. 419
(2017), in the same zone, i.e., -0.28‰/100 m. By comparison with the study of Florea et al. (2017), in 420
the Dudh Koshi River with a sampling set located between Gorak Shek (5180 m), upstream of 421
Lobuche, and downstream of Phakding (2550 m) in May 2011, values in δ18O are between -17.9 and 422
-9.7‰. The relationship between δ18O and δ2H demonstrates a lower slope and d-excess value than
423
our global study, with the equation: 424
δ2H = 7.8 δ18O + 4.0 (R2 = 0.94; n = 32)
Individually, tributary streams and direct sampling in the Dudh Koshi River show a d-excess ranging 426
between 4.4‰ and 12.7‰ (72% of samples lower than 10‰), which is globally lower than the 427
d-excess measured in this study. The slope is lower than 8, but overall the low d-excess values imply 428
that an evaporation process during the study interval (Florea et al. 2017) may be due to the sampling 429
time (end of extra-monsoon season), with warmer conditions than during the sampling times of this 430 study. 431 4 Discussion 432 4.1 Water origins 433
Not surprisingly, the isotope properties of the precipitation highlight the double climatic influence 434
from the arrival of the westerlies in winter and from the Asian monsoon in summer. 435
The isotope response to ground ice melt has been investigated since the mid-1970s (Stuiver et al.,
436
1976; Fujino and Kato, 1978) who relies on isotope fractionation that occurs during phase changes
437
(i.e. freezing, condensation, adsorption) and the resulting difference in the slope of the regression of
438
δD on δ18O with a slope between 3 and 7 (Jouzel and Souchez, 1982; Lacelle et al., 2011). Ala-aho et
439
al. (2018) show in western Siberia the possible discrimination of water origin between precipitation,
440
river, lakes and thawing permafrost. The slope of the regression of δD on δ18O was lower than the
441
precipitation (7.6) with soils/permafrost (4.64) < lakes (5.54) < rivers (6.08) and a strong variability
442
of median isotope content in precipitation (-15.6‰ in δ18O), rivers (-15.3‰), soils/permafrost
443
(-13.0‰) and lakes (-11.1‰) > rivers (-15.1‰). In our study case the river points do not show an
444
obvious influence of thawing permafrost during the sampling period which correspond before or after
445
monsoon when temperatures are lower, may-be during monsoon period of higher temperature, an
446
important thawing permafrost could be detected in some rivers.
447
Locally, the results of the current study confirm that few chemical patterns can be used to distinguish 448
the waterflow origins during the different seasons. Rb, as Li, Cu, Sr, Ba and SiO2, originating from the
449
minerals of the bedrock, characterizes substantially the water originating from glacier melt, as shown
450
in Figure 5, especially during the monsoon season. Nevertheless, the isotopic results appear to be less 451
useful for that task, even if differences are observed: The isotopic climate signal in the water courses 452
is very likely mixed with the signal emitted by the storage in groundwater temporary reservoirs, which 453
limits a clear interpretation. Factually, it depends on the sampling location and of the ratio of
454
glacierized area. In the high altitudes (> 4000 m) the river reflects the isotope content mainly of the
455
ice and snow melt because the climatic conditions do not allow an important weathering of the rocks
456
and a strong development of an aquifer structure; the consequence is a reduced groundwater capacity,
457
and a fast groundwater circulation reflecting isotope content of ice and snow. At lower altitude, the
458
weathering is higher and the aquifer can develop itself with a higher storage capacity involving local
459
recharge by rainfall; the isotope content is enriched with respect to ice and snow melt (altitude effect):
460
the lower the altitude, the richer is the isotope content of total flow. It is a consequence of the higher
461
base flow in the dry season and of the higher contribution of the surface runoff in the monsoon season,
462
this last being enriched in isotope with respect to ice and snow melt more depleted.
463
However, the meltwater marking (glacier as snow cover melt) by the isotopes can be more visible than 464
by the chemical signature in downstream sampling sites, because it is less dissolved, with the 465
inconvenience of a smoothed seasonal effect. The result at the Phakding (20.9‰ glacier covered) and 466
Pangom (no glacier) stations, detailed in the previous section, is, therefore, significant. 467
The pH remains in a relatively narrow range in the different sampling points and does not seem useful 468
for characterizing the water paths or the seasons, while electrical conductivity shows slightly higher 469
values for flows originating from glaciers and lower values in the monsoon runoffs of streams not fed 470
by glacier melt (Figure 2). 471
In addition to the previous considerations, complementary observations on electrical conductivity were 472
made in the main rivers of this area and in the Imja Lake during a 3-day interval in the second half of 473
June 2012, in the early monsoon season. They are summarized in Table 5, which shows that the flows 474
arising from the Imja Lake are approximately twofold less mineralized than those of the Khumbu upper 475
valley. Both basins have similar areas and ratios of glaciated surfaces. Because the flows are from the 476
same geological and glaciological origin, the conductivity difference observed can only be explained 477
by the presence of the lake. The higher value observed in the lateral Imja River, which does not flow 478
from the lake, confirms this hypothesis. This phenomenon could be attributed to the sedimentation
479
only within the lake of the solid load generated by the glacier abrasion, due to quieter hydraulic
480
conditions. This hypothesis is reinforced by the visual observations at the confluence between the Imja 481
and the Khumbu rivers, which showed that the turbulence of the runoff was higher in the Khumbu 482
branch than in the Imja branch (Figure 9). 483
4.2 Water uses 484
Before commenting, it must be stressed that in the framework of this study no analysis was performed 485
regarding the bacterial quality of the water used by the inhabitants and by the visitors. The reason is 486
that, at the time of the study, the only laboratory for analyzing samples, poorly equipped and without 487
dedicated manpower, was located in the Khumjung Hospital, close to the village of Namche Bazar, 488
several hours' walking distance from the sampling points. This is unfortunate, because the sources of 489
bacterial pollution are numerous, especially high-altitude pastures, perfunctory toilet installations, 490
uncontrolled waste disposal, etc. (Manfredi et al. 2010). These sources of pollution are increasing with 491
the rapid development of tourist activities. Furthermore, inhabitants in Pangboche expressed more 492
concerns about the future of the water quality than about water quantity since no proper sewage system 493
exists and they are witnessing a dissemination of plastic waste in streams. 494
The quality of the natural water can be chemically considered good with a very low mineralization
495
degree. It appears that the reticence to consider the water of the large valley river is mainly justified
496
by the danger in accessing and harvesting it and also by its white color, due to the fine particles
497
mentioned in the previous section. This particular property gave its name to the Dudh Koshi River,
498
which means Milk River in Nepali. Nevertheless, these statements cannot conclude on the drinkability
499
of the river water, since, as written above, organic and microbiological analysis have not been done in
500
the current study framework. 501
The sampling points L (Pangboche-Teouma) and I (Pangboche-Kisang) were chosen for their location, 502
upstream and downstream of the village, respectively, in order to examine an eventual degradation due 503
to the human activities. No notable differences can be observed in terms of the major ions (Table 2). 504
Nevertheless, in Figure 4, the trace elements collected throughout the year in Teouma (upstream)
505
appear grouped, when a dispersion is noted for those collected downstream in Kisang. This dispersion 506
is very likely due to the limited pollution of the water used in the village. Shortly after Kisang, the 507
slope torrent is intercepted by the large Dudh Koshi River, where the low chemical pollution is 508
dissolved. 509
Finally, the issue of bottled water consumption by tourists is of some importance to the local economy, 510
because it is a non-negligible income for the communities (Puschiasis 2015; Jacquemet 2018). Several 511
small companies have been established in the region to exploit this niche. One of them collected water 512
at the Pangboche-Chomar point (labeled H in Figure 1) and, after a basic filtration process, bottled it. 513
transported to France after several months in the original PET bottle and not in a standard analysis 515
recipient (see Section 2.3.1). As shown in Figure 4, no difference is observed between the bottle and 516
the other samples from the Chomar site. In Table 2, a few differences are notable, especially regarding 517
pH, Cl-, NO3-, and Na+. They can be explained by the very long storage in a bad-quality recipient, but
518
this is the reality for most of the water bottles available in the study zone. Nevertheless, in terms of 519
chemical quality, the bottled water and the river water are similar. It seems that for some reason the 520
water company did not pursue the exploitation of the Chomar site, which no longer functioned after 521
2013. However, water bottles from other places, particularly those collected in the surroundings of 522
Namche Bazar, were sold in the Pangboche shops and lodges. 523
5 Conclusion 524
Between many studies, the recent IPCC special report on the cryosphere future (Pörtner et al. 2019)
525
confirms the loss of cryospheric mass and the rapid permafrost thaw. It is also verified in the Central
526
Himalaya, which presents threats on physical entities (water resources, flood, landslide, avalanche)
527
and on ecosystems (forest, tundra). The Khumbu inhabitants are strongly preoccupied by this situation,
528
which directly impacts their livelihood. In addition, they face difficulties in terms of inequalities in the 529
social water management system, failing to regulate proper access of water in villages (Puschiasis 530
2015; Faulon and Sacareau 2020). More than climatic variations, changes in water use over the past 531
decades are due to a growing need for tourism and for domestic purposes. Regarding the future of 532
accessible water resources, this does not seem to be threatened in terms of quantity, even if seasonal 533
pressures should lead to a better water management, especially during the high season of tourism 534
activities (Aubriot et al. 2019). However, water quality could evolve in a worrisome direction. 535
Apart from the bacteriological issue, which is not considered here, the points addressed could change 536
as follows: 537
• The isotopic signature of precipitation and rivers is a good indicator of climate change and flow 538
paths. It should be periodically analyzed. On the one hand, it could follow changes observed 539
in the seasonal precipitation patterns in the study region (Shea et al. 2015). On the other hand, 540
it facilitates the recognition of the transitory storage of surface water (glacier, snow cover, or 541
underground reservoirs). 542
• In this study the chemical properties of the water used for domestic activities do not seem to 543
be hazardous to human and animal health at present. However, with changes in precipitation 544
and river regimes, in land use and land cover due to economic income, in cropping strategies, 545
in the very low level of waste and toilet water management, the current fragile balance could 546
be seriously jeopardized. The project of road construction in the valley, for instance, validated 547
until Surkhe, close to Lukla (“The Rising Nepal: Everest Region Closer with Bridge over 548
Sunkoshi” 2020), will lead to the importation of chemical products and molecules that have 549
been thus far unknown. 550
6 Conflict of Interest 551
The authors declare that the research was conducted in the absence of any commercial or financial 552
relationships that could be construed as a potential conflict of interest. 553
7 Author Contributions 554
Pierre Chevallier coordinated the whole study, including the field collection, wrote the introduction, 555
discussion, and conclusion sections, and assembled the different parts of the paper. Jean-Luc Seidel 556
contributed to the geochemistry analysis of the major ions and trace elements and Jean-Denis Taupin 557
of the stable isotopes. Ornella Puschiasis lived in Pangboche during the whole year in 2011 at an 558
elevation of 4000 m, collecting the water samples and she wrote the parts regarding water use by the 559 local inhabitants. 560 8 Funding 561
The global research action, the sample analysis, and the PhD grant, followed by a post-doctoral grant, 562
of Ornella Puschiasis were supported by Agence Nationale de la Recherche - France (references: 563
ANR-09-CEP-005-04/PAPRIKA and ANR-13-SENV-005-03/PRESHINE). Some monitoring 564
equipment was acquired through the Glacioclim SNO (French National Observation Service). 565
9 Acknowledgments 566
The analyses of major ions and trace elements were done by Sandra Van Exter and Jean-Luc Seidel, 567
and the analysis of stable isotopes by Nicolas Patris at the Laboratoire HydroSciences Montpellier 568
(CNRS, IRD, University of Montpellier). Dawa Nuru Sherpa translated the dialogs with Pangboche’s
569
inhabitants and facilitated the measurements. Ang Jangmu Sherpa collected and stored the 570
precipitation samples in Pangom. Yves Arnaud, Olivia Aubriot, Anneke De Rouw, François Delclaux, 571
Judith Eeckman, Michel Esteves, Frédéric Hernandez, Devesh Koirala, Luc Neppel, Rémi Muller, 572
Marie Savéan, Joëlle Smadja, and Patrick Wagnon participated in the field operations, as well as
573
extraordinary, indispensable and friendly local porters. 574
Yves Arnaud and Isabelle Sacareau were, respectively, the coordinators of the Paprika and Preshine 575
projects, which benefited from a partnership with the following institutions: Nepalese Academy of 576
Science and Technology (Kathmandu, Nepal), EvK2-CNR Association (Bergamo, Italy), International 577
Center of Integrated Mountain Development (Kathmandu, Nepal), Tribhuvan University (Kathmandu, 578
Nepal), and Department of Hydrology and Meteorology (Kathmandu, Nepal). 579
Finally, the authors thank the two anonymous reviewers who allow to substantially improve the
580
definitive version of the paper.
581
10 References 582
Ala-aho, P., C. Soulsby, O.S. Pokrovsky, S.N. Kirpotin, J. Karlsson, S. Serikova, S.N. Vorobyev, R.M.
583
Manasypov, S. Loiko and D. Tetzlaff, 2018. “Using stable isotopes to assess surface water
584
source dynamics and hydrological connectivity in a high-latitude wetland and permafrost
585
influenced landscape”. Journal of Hydrology 556 (2018) 279–293
586
Andermann, C., L. Longuevergne, S. Bonnet, A. Crave, P. Davy, and R. Gloaguen. 2012. “Impact of 587
Transient Groundwater Storage on the Discharge of Himalayan Rivers.” Nature Geoscience 5: 588
127–32. https://doi.org/10.1038/ngeo1356. 589
André-Lamat, Véronique. 2017. “De l’eau Source à l’eau Ressource : Production d’un Capital 590
Environnemental Ou d’un Commun. L’exemple de l’eau Domestique Au Pharak (Népal).” 591
Développement Durable et Territoires. https://halshs.archives-ouvertes.fr/halshs-01959313.
592
Aubriot, Olivia, Marie Faulon, Isabelle Sacareau, Ornella Puschiasis, Etienne Jacquemet, Joëlle 593
Smadja, Véronique André-Lamat, Céline Abadia, and Alix Muller. 2019. “Reconfiguration of 594
the Water–Energy–Food Nexus in the Everest Tourist Region of Solukhumbu, Nepal.” 595
Mountain Research and Development 39 (1).
https://doi.org/10.1659/MRD-JOURNAL-D-17-596
00080.1. 597
Balestrini, Raffaella, Carlo A. Delconte, Elisa Sacchi, Alana M. Wilson, Mark W. Williams, Paolo 598
Cristofanelli, and Davide Putero. 2016. “Wet Deposition at the Base of Mt Everest: Seasonal 599
and its Environmental Effects: Recent Scientific AdvancesPapers from the Ninth International 601
Conference on Acid Deposition, 146 (December): 100–112. 602
https://doi.org/10.1016/j.atmosenv.2016.08.056. 603
Balestrini, Raffaella, Stefano Polesello, and Elisa Sacchi. 2014. “Chemistry and Isotopic Composition 604
of Precipitation and Surface Waters in Khumbu Valley (Nepal Himalaya): N Dynamics of High 605
Elevation Basins.” Science of The Total Environment 485–486 (July): 681–92. 606
https://doi.org/10.1016/j.scitotenv.2014.03.096. 607
Bonasoni, P., P. Laj, A. Marinoni, M. Sprenger, F. Angelini, J. Arduini, U. Bonafe, et al. 2010. 608
“Atmospheric Brown Clouds in the Himalayas: First Two Years of Continuous Observations 609
at the Nepal Climate Observatory-Pyramid (5079 m).” Atmospheric Chemistry and Physics 10: 610
7515–31. https://doi.org/10.5194/acp-10-7515-2010. 611
Bookhagen, Bodo, and D. W. Burbank. 2010. “Toward a Complete Himalayan Hydrological Budget: 612
Spatiotemporal Distribution of Snowmelt and Rainfall and Their Impact on River Discharge.” 613
Journal of Geophysical Research-Earth Surface 115. https://doi.org/10.1029/2009jf001426.
614
Bortolami, Giancarlo. 1998. “Geology of the Khumbu Region, Mt Everest, Nepal.” In Limnology of 615
High Altitude Lakes in the Mt Everest Region, Nepal, edited by A. Lami and G Giussani, 57:41–
616
49. Memorie Dell’ Istituto Italiano Di Idrobiologia. 617
Chevallier, Pierre, François Delclaux, Patrick Wagnon, Luc Neppel, Yves Arnaud, Michel Esteves, 618
Devesh Koirala, et al. 2017. “Paprika - Preshine Hydrology Data Sets in the Everest Region 619
(Nepal). 2010-18.” Data base. 2017. https://doi.org/10.23708/000521. 620
Clark, Ian, and Peter Fritz. 1997. Environmental Isotopes in Hydrogeology. Boca Raton, New York: 621
Lewis Publisher. 622
Crespo, S., J. Aranibar, L. Gomez, M. Schwikowski, S. Bruetsch, L. Cara and R. Villalba, R. 2017.
623
Ionic and stable isotope chemistry as indicators of water sources to the Upper Mendoza River
624
basin, Central Andes of Argentina. Hydrological Sciences Journal, 62(4), 588-605. doi:
625
10.1080/02626667.2016.1252840
626
Dansgaard, W. 1964. “Stable Isotopes in Precipitation.” Tellus, no. 16: 436–68. 627
https://doi.org/10.1111/j.2153-3490.1964.tb00181.x. 628
Dongol, B. S., J. Merz, M. Schaffner, G. Nakarmi, P. B. Shah, S. K. Shrestha, P. M. Dangol, and M. 629
P. Dhakal. 2005. “Shallow Groundwater in a Middle Mountain Catchment of Nepal: Quantity 630
and Quality Issues.” Environmental Geology 49 (December): 219–29. 631
https://doi.org/10.1007/s00254-005-0064-5. 632
Eeckman, J., P. Chevallier, A. Boone, L. Neppel, A. De Rouw, F. Delclaux, and D. Koirala. 2017. 633
“Providing a Non-Deterministic Representation of Spatial Variability of Precipitation in the 634
Everest Region.” Hydrol. Earth Syst. Sci. 21 (9): 4879–93. https://doi.org/10.5194/hess-21-635
4879-2017. 636
Eeckman, Judith, Santosh Nepal, Pierre Chevallier, Gauthier Camensuli, Francois Delclaux, Aaron 637
Boone, and Anneke De Rouw. 2019. “Comparing the ISBA and J2000 Approaches for Surface 638
Flows Modelling at the Local Scale in the Everest Region.” Journal of Hydrology 569 639
(February): 705–19. https://doi.org/10.1016/j.jhydrol.2018.12.022. 640
Faulon, Marie, and Isabelle Sacareau. 2020. “Tourisme, gestion sociale de l’eau et changement 641
climatique dans un territoire de haute altitude : le massif de l’Everest au Népal.” Journal of 642
Alpine Research | Revue de géographie alpine, no. 108–1 (April). 643
https://doi.org/10.4000/rga.6759. 644
Florea, Lee, Broxton Bird, Jamie K. Lau, Lixin Wang, Yanbin Lei, Tandong Yao, and Lonnie G. 645
Thompson. 2017. “Stable Isotopes of River Water and Groundwater along Altitudinal 646
Gradients in the High Himalayas and the Eastern Nyainqentanghla Mountains.” Journal of 647
Hydrology: Regional Studies 14 (December): 37–48. 648
https://doi.org/10.1016/j.ejrh.2017.10.003. 649
Fujino K.and K. Kato. 1978. “Determination ofoxygen isotopic concentration in the ground ice of a
650
tundra area”. In “Joint Studies on Physical and Biological Environments in the Permafrost,
651
Alaska and North Canada, July to August 1977”, Kinosita S. (ed). The Institute of Low
652
Temperature Science, Hokkaido University: Sapporo; 77–83.
653
Garzione, C.N., J. Quade, P.G. De Celles, and N.B. English. 2000. “Predicting Paleoelevation of Tibet 654
and the Himalaya from Δ18O vs Altitude Gradients in Meteoric Water across the Nepal 655
Himalaya.” Eaarth Planet Sci. Lett., no. 183: 215–29. 656
Ghezzi, L., R. Petrini, C. Montomoli, R. Carosi, K. Paudyal, and R. Cidu. 2017. “Findings on Water 657
Quality in Upper Mustang (Nepal) from a Preliminary Geochemical and Geological Survey.” 658
Environmental Earth Sciences 76 (19): 651. https://doi.org/10.1007/s12665-017-6991-0.
659
Gonga-Saholiariliva, N., L. Neppel, Pierre Chevallier, F. Delclaux, and M. Savéan. 2016. 660
“Geostatistical Estimation of Daily Monsoon Precipitation at Fine Spatial Scale: Koshi River 661
Basin.” Journal of Hydrologic Engineering, April, 05016017. 662
https://doi.org/10.1061/(ASCE)HE.1943-5584.0001388. 663
Guo, Xiaoyu, Lide Tian, Rong Wen, Wusheng Yu, and Dongmei Qu. 2017. “Controls of Precipitation 664
Δ18O on the Northwestern Tibetan Plateau: A Case Study at Ngari Station.” Atmospheric 665
Research 189 (June): 141–51. https://doi.org/10.1016/j.atmosres.2017.02.004.
666
He, Siyuan, and Keith Richards. 2016. “Stable Isotopes in Monsoon Precipitation and Water Vapour 667
in Nagqu, Tibet, and Their Implications for Monsoon Moisture.” Journal of Hydrology 540 668
(September): 615–22. https://doi.org/10.1016/j.jhydrol.2016.06.046. 669
Hodson, Andy, Phil Porter, Andy Lowe, and Paul Mumford. 2002. “Chemical Denudation and Silicate 670
Weathering in Himalayan Glacier Basins: Batura Glacier, Pakistan.” Journal of Hydrology 262 671
(1): 193–208. https://doi.org/10.1016/S0022-1694(02)00036-7. 672
Immerzeel, W.W., L. P. H. van Beek, and M. F. P. Bierkens. 2010. “Climate Change Will Affect the 673
Asian Water Towers.” Science 328: 1382–85. https://doi.org/10.1126/science.1183188. 674
Jacobi, H.-W., S. Lim, M. Ménégoz, P. Ginot, P. Laj, P. Bonasoni, P. Stocchi, A. Marinoni and Y. 675
Arnaud. 2015. “Black carbon in snow in the upper Himalayan Khumbu Valley, Nepal: 676
observations and modeling of the impact on snow albedo, melting, and radiative forcing”. The 677
Cryosphere 9, 1685–1699. https://doi.org/10.5194/tc-9-1685-2015
678
Jacquemet, Etienne. 2018. “The Sherpa Community in the ‘Yak Donald’s’ Era : Locational Struggles 679
for Access to Resources in Mount Everest Touristic Region (Nepal).” Theses, Université 680
Michel de Montaigne - Bordeaux III. https://tel.archives-ouvertes.fr/tel-02275425. 681
Jeelani, Ghulam. 2008. “Aquifer Response to Regional Climate Variability in a Part of Kashmir 682
Himalaya in India.” Hydrogeology Journal 16 (December): 1625–33. 683
https://doi.org/10.1007/s10040-008-0335-9. 684
Jeelani, Ghulam, N. A. Bhat, K. Shivanna, and M. Y. Bhat. 2011. “Geochemical Characterization of 685
Surface Water and Spring Water in SE Kashmir Valley, Western Himalaya: Implications to 686
Water-Rock Interaction.” Journal of Earth System Science 120 (October): 921–32. 687
Jeelani, Ghulam, and R. D. Deshpande. 2017. “Isotope Fingerprinting of Precipitation Associated with 688
Western Disturbances and Indian Summer Monsoons across the Himalayas.” Journal of Earth 689
System Science 126 (8): 108. https://doi.org/10.1007/s12040-017-0894-z.
690
Jeelani, Ghulam, Rajendrakumar D. Deshpande, Rouf A. Shah, and Wasim Hassan. 2017. “Influence 691
of Southwest Monsoons in the Kashmir Valley, Western Himalayas.” Isotopes in 692
Environmental and Health Studies 53 (4): 400–412. 693
https://doi.org/10.1080/10256016.2016.1273224. 694
Jeelani, Ghulam, U. Saravana Kumar, and Bhishm Kumar. 2013. “Variation of Δ18O and ΔD in 695
Precipitation and Stream Waters across the Kashmir Himalaya (India) to Distinguish and 696
Estimate the Seasonal Sources of Stream Flow.” Journal of Hydrology 481 (February): 157– 697
65. https://doi.org/10.1016/j.jhydrol.2012.12.035. 698
Jeelani, Ghulam, Rouf A. Shah and Rajendrakumar D. Deshpande. 2018. “Application of Water
699
Isotopes to Identify the Sources of Groundwater Recharge in a Karstified Landscape of Western
700
Himalaya”. Journal of Climate Change 4(1):37-47.
701
Jouzel J. and R.A. Souchez. 1982. “Melting andrefreezing at the glacier sole and the isotopic
702
composition of the ice”. Journal of Glaciology 28: 35–42.
703
Kaspari, S. D., M. Schwikowski, M. Gysel, M. G. Flanner, S. Kang, S. Hou, and P. A. Mayewski. 704
2011. “Recent Increase in Black Carbon Concentrations from a Mt. Everest Ice Core Spanning 705
1860-2000 AD.” Geophysical Research Letters 38 (February). 706
https://doi.org/10.1029/2010gl046096. 707
Kumar, Amit, Sameer K. Tiwari, Akshaya Verma, and Anil K. Gupta. 2018. “Tracing Isotopic 708
Signatures (ΔD and Δ18O) in Precipitation and Glacier Melt over Chorabari Glacier– 709
Hydroclimatic Inferences for the Upper Ganga Basin (UGB), Garhwal Himalaya.” Journal of 710
Hydrology: Regional Studies 15 (February): 68–89. https://doi.org/10.1016/j.ejrh.2017.11.009.
711
Lacelle, D. 2011. “On the d18O, dD and D-excess relations in meteoric precipitation and during
712
equilibrium freezing: theoretical approach and field examples”. Permafrost and Periglacial
713
Processes 22, 13–25.
714
Lai, C.T., and J.R. Ehleringer. 2010. “Deuterium Excess Reveals Diurnal Sources of Water Vapor in 715
Forest Air.” Oecologia. https://doi.org/10.1007/s00442-010-1721-2. 716
Li, Lin, and Carmala N. Garzione. 2017. “Spatial Distribution and Controlling Factors of Stable 717
Isotopes in Meteoric Waters on the Tibetan Plateau: Implications for Paleoelevation 718
Reconstruction.” Earth and Planetary Science Letters 460 (February): 302–14. 719
https://doi.org/10.1016/j.epsl.2016.11.046. 720
Madhura, R.K., R. Krishnan, J.V. Revadekar, M. Mujumdar, and B. N. Goswami. 2015. “Changes in 721
Western Disturbances over the Western Himalayas in a Warming Environment.” Climate 722
Dynamics, no. 44: 1157–68.
723
Manfredi, Emanuela Chiara, Bastian Flury, Gaetano Viviano, Sudeep Thakuri, Sanjay Nath Khanal, 724
Pramod Kumar Jha, Ramesh Kumar Maskey, et al. 2010. “Solid Waste and Water Quality 725
Management Models for Sagarmatha National Park and Buffer Zone, Nepal Implementation 726
of a Participatory Modeling Framework.” Mountain Research and Development 30 (2): 127– 727
42. https://doi.org/10.1659/MRD-JOURNAL-D-10-00028.1. 728
McDowell, G., J. D. Ford, B. Lehner, L. Berrang-Ford, and A. Sherpa. 2012. “Climate-Related 729
Hydrological Change and Human Vulnerability in Remote Mountain Regions: A Case Study 730