HAL Id: hal-00317499
https://hal.archives-ouvertes.fr/hal-00317499
Submitted on 14 Jul 2004
HAL is a multi-disciplinary open access
archive for the deposit and dissemination of
sci-entific research documents, whether they are
pub-lished or not. The documents may come from
teaching and research institutions in France or
abroad, or from public or private research centers.
L’archive ouverte pluridisciplinaire HAL, est
destinée au dépôt et à la diffusion de documents
scientifiques de niveau recherche, publiés ou non,
émanant des établissements d’enseignement et de
recherche français ou étrangers, des laboratoires
publics ou privés.
and spatial characteristics
T. Johansson, S. Figueiredo, T. Karlsson, G. Marklund, A. Fazakerley, S.
Buchert, P.-A. Lindqvist, Hans Nilsson
To cite this version:
T. Johansson, S. Figueiredo, T. Karlsson, G. Marklund, A. Fazakerley, et al.. Intense high-altitude
au-roral electric fields - temporal and spatial characteristics. Annales Geophysicae, European Geosciences
Union, 2004, 22 (7), pp.2485-2495. �hal-00317499�
SRef-ID: 1432-0576/ag/2004-22-2485 © European Geosciences Union 2004
Annales
Geophysicae
Intense high-altitude auroral electric fields – temporal and spatial
characteristics
T. Johansson1, S. Figueiredo1, T. Karlsson1, G. Marklund1, A. Fazakerley2, S. Buchert3, P.-A. Lindqvist1, and
H. Nilsson4
1Division of Plasma Physics, Alfv´en Laboratory, Royal Institute of Technology, SE-100 44 Stockholm, Sweden
2Mullard Space Science Laboratory, University College London, Holmbury St. Mary, Dorking, Surrey RH5 6NT, UK
3Swedish Institute of Space Physics, Box 537, SE-751 21 Uppsala, Sweden
4Swedish Institute of Space Physics, Box 812, SE-981 28 Kiruna, Sweden
Received: 30 September 2003 – Revised: 5 February 2004 – Accepted: 8 March 2004 – Published: 14 July 2004 Part of Special Issue “Spatio-temporal analysis and multipoint measurements in space”
Abstract. Cluster electric field, magnetic field, and energetic electron data are analyzed for two events of intense auro-ral electric field variations, both encountered in the Plasma Sheet Boundary Layer (PSBL), in the evening local time
sector, and at approximately 5 RE geocentric distance. The
most intense electric fields (peaking at 450 and 1600 mV/m, respectively) were found to be quasi-static, unipolar, rel-atively stable on the time scale of at least half a minute, and associated with moving downward FAC sheets
(peak-ing at ∼10 µA/m2), downward Poynting flux (peaking at
∼35 mW/m2), and upward electron beams with
characteris-tic energies consistent with the perpendicular potentials (all
values being mapped to 1 REgeocentric distance). For these
two events in the return current region, quasi-static electric field structures and associated FACs were found to dominate the upward acceleration of electrons, as well as the energy transport between the ionosphere and the magnetosphere, al-though Alfv´en waves clearly also contributed to these pro-cesses.
Key words. Magnetospheric physics (electric fields; auroral phenomena; magnetosphere-ionosphere interactions)
1 Introduction
Intense perpendicular (to the background magnetic field) electric fields at high altitudes above the auroral region have been the subject of much interest and intense research, be-cause they serve as an indication of electric fields parallel to the background magnetic field in the region between the s/c and the ionosphere. One implication of upward paral-lel electric fields is that they will accelerate electrons
down-Correspondence to: T. Johansson
ward, leading to auroral emissions when these particles pre-cipitate into the upper atmosphere. The energy consumed
in accelerating the auroral particles, at around 1 RE altitude,
must be available in terms of an energy flux, originating from higher altitudes. Intense perpendicular electric fields at
geo-centric distances of approximately 5 RE are often found in
the Plasma Sheet Boundary Layer, PSBL, which is an im-portant source region for the energy flux powering the au-rora. A fundamental question is the nature of this energy flux. Presumably, the dominant flux is an electromagnetic energy flux (Poynting flux), which can either be associated with (quasi-) static field-aligned currents (FACs) or dynamic processes, such as travelling Alfv´en waves or field-line res-onances (FLRs). The transport mechanism might change, so that the way by which the energy flux is carried is different at different altitudes. There is also the possibility that energy is transported as kinetic energy carried by particles, see, for example, Ostgaard et al. (2002).
Up-going (down-going) FACs are associated with nega-tive (posinega-tive) potential structures, corresponding to converg-ing (divergconverg-ing) quasi-static electric fields. This is supported by Marklund et al. (2001), who have utilized the possibil-ities of the Cluster mission, consisting of four s/c, to ob-serve the growth and decay of a diverging electric field struc-ture accelerating electrons upward, i.e. in the return current region. (The return and primary current regions are also known as the downward and upward current regions, respec-tively, but the former denotation will be used here.) An in-crease in a positive electric field peak and the increasing en-ergy of an upward electron beam were found to match, i.e. consistency between the parallel acceleration potential and the perpendicular potential was found, supporting the quasi-static model. However, recent studies on Polar observations (in the primary current region) have focused on the impor-tance of Alfv´en wave Poynting flux. High-altitude (above the
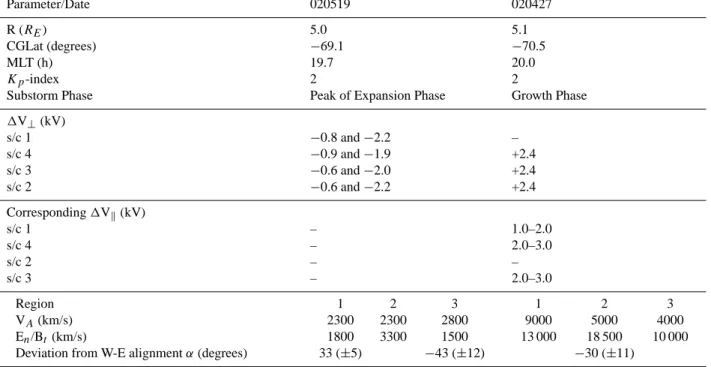
Table 1. Summary of the events of 27 April and 19 May 2002. Positive (negative) α corresponds to anti-clockwise (clockwise) rotation
of the current sheet from east-west alignment. The different α given for 19 May 2002 corresponds to the two different regions of spatial variations, see the text.
Parameter/Date 020519 020427
R (RE) 5.0 5.1
CGLat (degrees) −69.1 −70.5
MLT (h) 19.7 20.0
Kp-index 2 2
Substorm Phase Peak of Expansion Phase Growth Phase
1V⊥(kV) s/c 1 −0.8 and −2.2 – s/c 4 −0.9 and −1.9 +2.4 s/c 3 −0.6 and −2.0 +2.4 s/c 2 −0.6 and −2.2 +2.4 Corresponding 1Vk(kV) s/c 1 – 1.0–2.0 s/c 4 – 2.0–3.0 s/c 2 – – s/c 3 – 2.0–3.0 Region VA(km/s) En/Bt (km/s)
Deviation from W-E alignment α (degrees)
1 2 3 2300 2300 2800 1800 3300 1500 33 (±5) −43 (±12) 1 2 3 9000 5000 4000 13 000 18 500 10 000 −30 (±11)
auroral acceleration region) intense electric field structures
(E⊥≥100 mV/m) were found to be associated with large
downward directed Poynting fluxes, many of which were consistent with Alfv´en waves (Keiling et al., 2000, 2001, 2002, 2003; Wygant et al., 2000, 2002). The consistency of the observed structures with Alfv´en waves were concluded by comparing the local Alfv´en speed with the E/B-ratio of correlated electric to magnetic fields. These authors argue that the Alfv´enic Poynting flux is a major contributor to the powering of the aurora, since at least one-third of the total energy required to produce the global ionospheric auroral luminosity can be accounted for by Alfv´en waves (Keiling et al., 2003). Also, a relation between the large Alfv´enic Poynting fluxes and the expansion phase of both strong and weak substorms was found by Keiling et al. (2000, 2001). However, the observations reported by Keiling et al. (2001) are consistent with both the quasi-static model and dynamic Alfv´en wave processes. In a FAST/Polar conjunction study, Schriver et al. (2003) have found intense electric fields asso-ciated with Alfv´en waves in the primary current region and shown in several events that both FAC and Alfv´en waves transport energy into the auroral region, with the presence of the Alfv´en waves depending on the geomagnetic activity (no Alfv´en waves during periods of low activity). The above referred to Polar studies (primary current region), this study, as well as Marklund et al. (2001) (return current region), are studies, on parts of the same current system, connected via perpendicular currents in the ionosphere and driven by a gen-erator, presumably in the magnetosphere.
A special case of Alfv´en wave phenomena is FLRs. These have electric and magnetic field topologies similar to those of discrete auroral arcs, hence FLRs have been proposed as a producer of aurora. There is observational support for this proposition, see, from example, Samson et al. (1996, 2003). Further, Lotko et al. (1998) found that their FLR model can reproduce the large-scale field structure of an auroral accel-eration region.
Two events of intense electric fields observed in the au-roral return current region in the evening sector, from April and May 2002, have been studied using Cluster data. They are connected to the PSBL, as deduced from PEACE (Plasma Electron And Current Experiment) electron and CIS (Cluster Ion Spectrometry) ion data. For descriptions of the Clus-ter instruments, see Escoubet et al. (1997). The s/c are for both events located at a geocentric distance of approximately
5 RE. The geomagnetic activity is low or moderate,
in-ferred from the Kp-index, and both events are in the Southern
Hemisphere.
The intent of this paper is to describe the two events and to present a view of the stability or variations of some rele-vant parameters, such as electric and magnetic fields, Poynt-ing fluxes, FACs, the potentials along the spacecraft tra-jectory, and electron and ion distributions. The capability of simultaneous measurements provided by the four closely spaced Cluster s/c allows us to reveal whether variations are temporal or (and) spatial. The method used for separating spatial and temporal variations in the electric and magnetic fields is described by Karlsson et al. (2004) in this issue
(hereafter called the “companion paper”). The variations of some parameters and the stability of others can, together with a knowledge of whether the variations are spatial or tem-poral, improve the understanding of the different means of energy transport between the magnetosphere and the iono-sphere. More specifically, the relative roles of the FACs and the Alfv´en waves in this process are investigated.
2 Observations of intense electric fields
The criterion used when selecting the events was the pres-ence of intense electric fields mapping to at least 100 mV/m at ionospheric altitude. Further, a similar electric field pat-tern should be recognized by at least two s/c. Twenty-four events of intense electric fields that fulfilled the selection cri-teria were found in the period January to June 2002. Two of these were chosen to be studied in more detail. The selection was based on the characteristics of the events and on legible data. In this section, data for the two events are presented and discussed. The results are summarized in Table 1.
2.1 19 May 2002
On 19 May 2002, 05:26–05:36 UT, the Cluster s/c were at a
geocentric distance of 5.0 RE, around −70 CGLat and close
to 20 MLT, i.e. in the evening local time sector and in the Southern Hemisphere. This event took place at the peak of a substorm expansion phase (the auroral oval at its maximum expanded state, revealed by a maximal peak in the AL index, after which a decrease begins, corresponding to the recovery
phase), with moderate geomagnetic activity (a Kp-index of
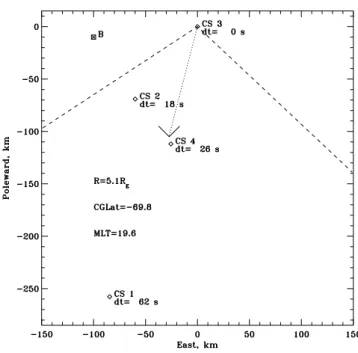
2). Figure 1 gives the configuration of the four s/c, the di-rection of motion of the s/c and the orientation of the current sheets (see below) in a plane perpendicular to the background magnetic field.
Using the method described in the companion paper to solve the temporal and spatial ambiguity problem, three re-gions of different electric and magnetic characteristics could be identified; 200–300 s, 300–380 s and 380–440 s after 05:26 UT. (See Figs. 2–5, described below.) In regions I and III, similar features in the electric and magnetic field data where observed by the consecutive s/c with a time lag of ap-proximately 10 s (1–15 s). No clear correlations between the electric and magnetic fields are observed when looking at the data. (“Correlation”, used here and later, does not refer to a calculated correlation but to a clear similarity between a parameter observed by consecutive s/c or between different parameters observed by the same s/c.) The Alfv´en veloci-ties (calculated assuming, for simplicity, equal amounts of hydrogen and oxygen ions and the plasma density estimated from the s/c potential) are 2300 and 2800 km/s, respectively,
and the En/Bt-ratios (see discussion of normal and
tangen-tial direction below) are 1800 and 1500 km/s, respectively. Note that there are relatively large uncertainties in these
esti-mates such that the Alfv´en velocity and the En/Bt-ratio may
differ by as much as a factor of two, even for the case of
Fig. 1. 19 May 2002. The direction of motion (dotted line) and
configuration of the s/c in a plane perpendicular to the background magnetic field. dt is the time separation of the satellites passing through this plane, with respect to s/c 3. The orientations of the current sheets (see the text) are shown as dashed lines.
clear Alfv´en waves. In regions I and III, the variations are concluded to be predominantly spatial and corresponding to moving field-aligned current sheets having peaks coinciding with the electric field peaks. From the separations between the s/c and the observations of the current sheets, it is cluded that the current sheets are moving with a fairly con-stant angle of deviation from east-west alignment within each of the two regions. The current sheet orientations obtained are not the same in regions I and III. The deviations from
east-west alignment, α, were approximately 34 and −43◦,
respectively (determined by a minimum variance analysis on the residual magnetic field), and the current sheet velocity perpendicular to this orientation was 8 and 14 km/s, respec-tively. Positive (negative) α corresponds to an anti-clockwise (clockwise) rotated current sheet with respect to the east-west orientation. The order in which the s/c encountered the current/electric field structures was 1, 4, 2 and 3 and the satellite data are presented in this order. The time dif-ference between the structure crossings in region I by s/c 1 and by s/c 4, 2 and 3 were approximately 1, 7 and 12 s. In region III, the time differences between the crossings of the spatial structures were 6, 9 and 13 s, respectively. There is a large-scale upward current of Region 1 type between 100 and 200 s, and a large-scale downward current of Region 2 type between 200 and 290 s which coincides with region I of this event. After 300 s, for regions II and III of this event, the large-scale current consists of both upward and down-ward currents. In region II, the electric and magnetic field data are closely correlated with almost no time lag, indicating that temporal variations are dominating there. The calculated
Cluster 1 PEACE Electrons at 0,90,180 deg V wrt to B 10-6 10-5 10-4 10-3 ergs/cm**2-s-str-eV dEF 10-6 10-5 10-4 10-3 ergs/cm**2-s-str-eV 10-6 10-5 10-4 10-3 ergs/cm**2-s-str-eV 102 103 104 Center Energy eV 102 103 Center Energy eV 2002/139 SM Lat ILAT MLT SM Radius 101 102 103 Center Energy eV 05:26 -38.21 69.76 19.59 5.05 05:29 -37.01 69.34 19.52 5.01 05:32 -35.80 68.92 19.50 4.97 05:35 -34.56 68.50 19.50 4.93
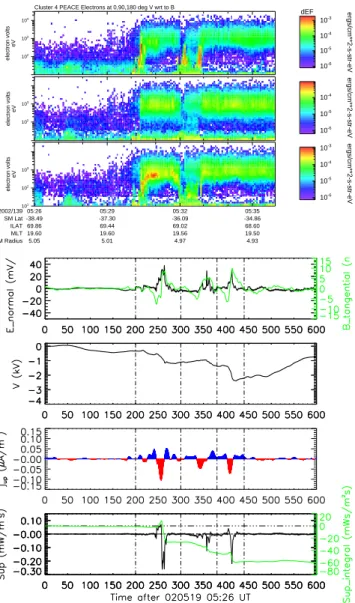
Fig. 2. 19 May 2002, s/c 1. Electron energy-time spectrograms at
pitch angles 0, 90 and 180◦are shown in the first three panels. This event is on the Southern Hemisphere, hence the first panel shows electrons going upward from Earth and the downward electrons are seen in the third spectrogram panel. The following panel shows the component of the electric field normal to the current sheet (black line) and the tangential component of the magnetic field (green line). Only these two components are shown, since they are the ones where the dominating variations are seen. The next panel displays the potential along the spacecraft trajectory. A negative (positive) value in the second to last panel corresponds to downward (upward) FACs and is shown with red (blue) color. Poynting flux (black line) and the integrated Poynting flux (green line) are plotted in the bot-tom panel. The vertical dash-dot lines delimit the regions of domi-nating spatial and temporal variations (see the text). All panels are local value plots, with the ionospheric mapping factors being 11.2 for E and 125 for FAC and S.
local Alfv´en velocity, 2300 km/s, agrees roughly with the
lo-cal En/Bt-ratio of 3300 km/s, considering the uncertainties
in the calculations caused by the rough estimate of the ion composition. The frequencies of these Alfv´en waves are in
Cluster 4 PEACE Electrons at 0,90,180 deg V wrt to B
10-6 10-5 10-4 10-3 ergs/cm**2-s-str-eV dEF 10-6 10-5 10-4 ergs/cm**2-s-str-eV 10-6 10-5 10-4 10-3 ergs/cm**2-s-str-eV 102 103 104 electron volts eV 102 103 electron volts eV 2002/139 SM Lat ILAT MLT SM Radius 101 102 103 electron volts eV 05:26 -38.49 69.86 19.60 5.05 05:29 -37.30 69.44 19.60 5.01 05:32 -36.09 69.02 19.56 4.97 05:35 -34.86 68.60 19.50 4.93
Fig. 3. 19 May 2002, s/c 4. The same panels as in Fig. 2.
the range 25–50 mHz, somewhere in between those of FLRs and those associated with the Alfv´enic resonator. A closer investigation of the variations can be found in the companion paper.
S/c 1: At the top of Fig. 2, electron data from the PEACE instrument are shown in the first three panels. The electron data are in the form of energy-time spectrograms at pitch
an-gles of 0, 90 and 180◦, up-going electrons are seen in the
first panel and downward flowing electrons in the third panel. Note the different scales for up-going and down-going elec-tron fluxes. The electric and magnetic fields were projected into a local coordinate system determined by the direction of minimum variance in the residual magnetic field. If the en-countered variations are predominantly spatial, as concluded to be the case in regions I and III, the direction of minimum variance in the residual magnetic field is tangential to the cur-rent sheet. Panel 4 shows the electric field component nor-mal to (what in regions I and III can be interpreted as) the local current sheet orientation (black line) and the magnetic
Fig. 4. 19 May 2002, s/c 2. The same panels as in Fig. 2 but without
PEACE electron data.
field component tangential to the local current sheet orien-tation (green line). The electric field was measured by the EFW (Electric Field and Wave) instrument and the magnetic field by the FGM (FluxGate Magnetometer) instrument. Due to a probe failure, only spin resolution electric field data are available from s/c 1. From the measured magnetic field data, a running-window average (1-min wide and steps of 10 s) was subtracted to remove the background field. The poten-tial along the spacecraft trajectory was obtained by integrat-ing the electric field, and is presented in panel 5. Panel 6 shows the FAC distribution estimated from the residual mag-netic field (assuming spatial magmag-netic variations). The calcu-lated FAC is unreliable in regions where the variations were found to be predominantly temporal due to Alfv´en waves, such as in region II. A negative (positive) value corresponds to downward (upward) FACs and is shown with red (blue) color. From the electric field and the residual magnetic field data, the Poynting flux along the background magnetic field,
Sk, was calculated and is displayed in the bottom panel (black
line), together with the time integrated Poynting flux (green line). The data presented are all local values and in order to refer to the ionospheric level, the mapping factors are given in the text below Fig. 2.
Two peaks in the electric field data, one in each of the two regions dominated by spatial variations, are seen at 260 and 400 s. Their magnitudes are, if mapped to the ionosphere, 280 and 200 mV/m, respectively. Two downward FAC peaks and two downward Poynting flux peaks are well correlated with the electric field peaks. At 260 s, the magnitude of the
mapped downward Poynting flux peak is 33 mW/m2and the
magnitude of the mapped downward FAC (this estimate de-pends on the filtering of the magnetic field and should be
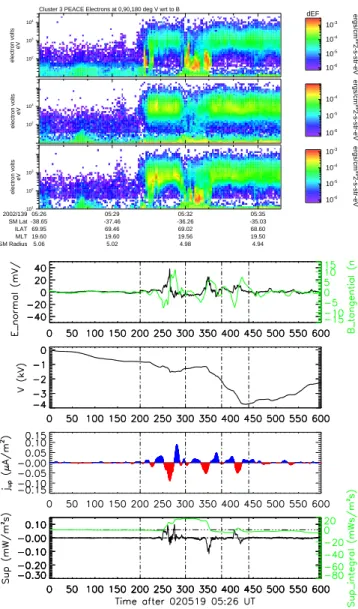
Cluster 3 PEACE Electrons at 0,90,180 deg V wrt to B
10-6 10-5 10-4 10-3 ergs/cm**2-s-str-eV dEF 10-6 10-5 10-4 ergs/cm**2-s-str-eV 10-6 10-5 10-4 10-3 ergs/cm**2-s-str-eV 102 103 104 electron volts eV 102 103 electron volts eV 2002/139 SM Lat ILAT MLT SM Radius 101 102 103 electron volts eV 05:26 -38.65 69.95 19.60 5.06 05:29 -37.46 69.46 19.60 5.02 05:32 -36.26 69.02 19.56 4.98 05:35 -35.03 68.60 19.50 4.94
Fig. 5. 19 May 2002, s/c 3. The same panels as in Fig. 2.
considered with care; this study is mostly concerned with the
variations between consecutive s/c) is 15 µA/m2. The
ing flux is downward dominated but the integrated Poynt-ing flux is close to zero. The remainPoynt-ing parameter, the per-pendicular potential, is seen to display a large-scale nega-tive valley structure. There are also superposed small-scale valley shapes between 400 and 470 s, the total minimum be-ing −3.4 kV. By comparison with CIS data (not shown here) it was found that the small-scale negative potentials agreed roughly with the characteristic energy of the up-going ions. From inspection of the PEACE electron data (a sharp in-crease in the electron flux, supported by CIS data showing also an ion flux increase) for this and the other s/c passages, it is concluded that the s/c are traversing the PSBL.
S/c 4: Three distinct more or less unipolar electric field structures, one in each region, are seen in the data from the passage by s/c 4 (Fig. 3), with the most intense peak at 250 s mapping to 420 mV/m at ionospheric altitude. The peak in the middle region was not present in the electric field data
Fig. 6. 27 April, 2002. The direction of motion (dotted line) and
configuration of the s/c in a plane perpendicular to the background magnetic field. dt is the time separation of the satellites passing through this plane, with respect to s/c 3. The orientation of the current sheet (see the text) is shown as a dashed line.
from the passage by s/c 1. Three distinct regions of intense up-going electrons with characteristic energies of 2–3 keV, not seen in the data observed by s/c 1, are seen well sepa-rated, with the first and the last of these being well correlated with the downward FAC peaks at 260 and 410 s (the FAC pat-tern is fairly similar to that observed by s/c 1), and also with the intense electric field peaks and the downward Poynting flux peaks. The Poynting flux is in this passage more down-ward dominated, due to more downdown-ward contributions from the two peaks at 260 and 410 s. The magnitude of the later
peak has increased to 25 mW/m2, all compared to the
obser-vations by s/c 1. In the region dominated by temporal vari-ations, a downward Poynting flux peak is observed in con-trast to what was observed in the passage by s/c 1. Finally, the depth of the large-scale potential valley in the later part of the interval has decreased to −2.4 kV. Note that the nega-tive valley in the perpendicular potential pattern between 250 and 350 s coincides well with the inverted V-structure in the precipitating electrons, implying that these electrons will be subject to further acceleration by the order of 1 kV before they reach the auroral ionosphere.
S/c 2: The large-scale, electric field pattern, with the peak at 260 s (mapping to 450 mV/m), and the FAC pat-tern are both roughly the same as for the passage by s/c 4 (Fig. 4). The Poynting flux has decreased significantly
(the main downward peak has decreased from 33 mW/m2
to 12 mW/m2) and the integrated Poynting flux is small but
negative. However, the correlation between the intense elec-tric field peaks, the downward FAC peaks and the downward Poynting flux peaks, at approximately 260 and 400 s,
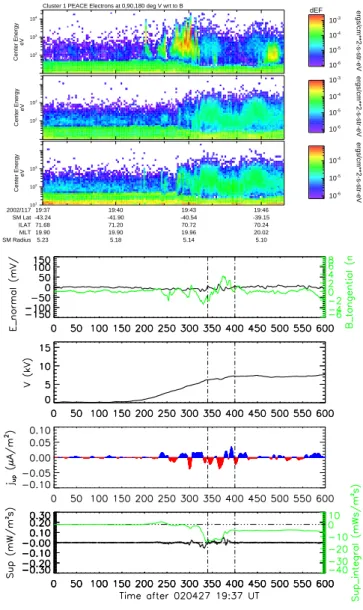
per-Cluster 1 PEACE Electrons at 0,90,180 deg V wrt to B
10-6 10-5 10-4 10-3 ergs/cm**2-s-str-eV dEF 10-6 10-5 10-4 10-3 ergs/cm**2-s-str-eV 10-6 10-5 10-4 ergs/cm**2-s-str-eV 102 103 104 Center Energy eV 102 103 Center Energy eV 2002/117 SM Lat ILAT MLT SM Radius 101 102 103 Center Energy eV 19:37 -43.24 71.68 19.90 5.23 19:40 -41.90 71.20 19.90 5.18 19:43 -40.54 70.72 19.96 5.14 19:46 -39.15 70.24 20.02 5.10
Fig. 7. 27 April 2002, s/c 1. The same panels as in Fig. 2. The
verti-cal dash-dot lines delimit the region of dominating spatial variations (see the text).
sists. No significant variations are observed in the perpendic-ular potential. Neither PEACE nor CIS data were available from s/c 2.
S/c 3: The electric and magnetic field patterns are very similar to those of the previous s/c crossings, although the third electric field peak at 410 s in region III has decreased in magnitude (Fig. 5). Thus, the FAC pattern is also fairly unchanged but the downward peak around 260 is now seen to be somewhat broader. The enhancements in the up-going electron flux (more intense than for s/c 4), with character-istic energies of 2–3 keV, are consistent with the downward FAC peaks and well correlated with the electric field peaks in regions I and III.
In region II, the downward peak of the Poynting flux dominated by temporal variations is seen to have increased
to 12 mW/m2, locally, while the Poynting flux in regions I
and III is similar to the corresponding Poynting flux in the passage by s/c 2 but not to the fluxes observed by s/c 1 and 4.
Cluster 4 PEACE Electrons at 0,90,180 deg V wrt to B 10-6 10-5 10-4 10-3 ergs/cm**2-s-str-eV dEF 10-6 10-5 10-4 ergs/cm**2-s-str-eV 10-6 10-5 10-4 ergs/cm**2-s-str-eV 102 103 104 electron volts eV 102 103 electron volts eV 2002/117 SM Lat ILAT MLT SM Radius 101 102 103 electron volts eV 19:37 -43.50 71.78 19.90 5.23 19:40 -42.17 71.30 19.90 5.19 19:43 -40.81 70.82 19.96 5.14 19:46 -39.43 70.34 20.02 5.10
Fig. 8. 27 April 2002, s/c 4. The same panels as in Fig. 2.
It can also be seen that the potential profile differs from the two previous crossings in that the depth of the large-scale negative perpendicular potential structure has increased from
−2.4 kV to −3.7 kV and is resembling the profile observed
by s/c 1.
2.2 27 April 2002
For the event of 27 April 2002 (19:37–19:47) the Cluster
s/c were at a geocentric distance of 5.1 RE, close to 20 MLT
and around −71 CGLat, in the Southern Hemisphere (Fig. 6).
The Kp-index for this event was 2, indicating moderate
geo-magnetic activity, and from the AL-index it is concluded that the measurements were taken during the growth phase of a substorm.
Based on the method described in the companion paper, applied to this event, and on the characteristics of the elec-tric and magnetic field data, and the electron flux data (see Figs. 7–10), it is found that the region of predominantly spa-tial variations encompasses the entire upward electron beam
Fig. 9. 27 April 2002, s/c 2. The same panels as in Fig. 2 but
without PEACE electron data.
structure, i.e. between 340 and 400 s after 19:37 UT. Inspec-tion of the various data affirms that spatial variaInspec-tions are dominating in this whole region, although the strongest sup-port to the interpretation that the variations are of a quasi-static nature is obtained for the later half of this interval. The
deviation from east-west alignment, α, was −30◦, and the
structure had a velocity perpendicular to this orientation of 3.7 km/s. The order by which the s/c encountered the cur-rent/electric field structure was 1, 4, 2 and 3 and the time dif-ferences between the crossings of the structure were approxi-mately 14, 16 and 23 s, respectively. A large-scale downward current of Region 2 type between 300 and 400 s coincides with the downward current in this event. Starting approxi-mately 100 s before this region, an upward current of Region 1 type is seen.
S/c 1: The electric field is small over the whole inter-val (Fig. 7) and so are the magnitudes of the predominantly downward Poynting flux. The FAC pattern is characterized by multiple and weak up- and down-going currents. A re-gion of downward FAC between 340 and 380 s is correlated with enhanced upward electron flux, with characteristic ener-gies of about 1 keV. Overlapping this region, the perpendic-ular potential increases during the first 400 s after 19:37 UT, and then remains constant at 7.5 kV. From inspection of the PEACE electron data for all four passages, it was concluded that the s/c were in the PSBL.
S/c 4: At the time of the crossing by s/c 4 (Fig. 8) the electric field has intensified, the magnitude of the main peak at 380 s is now 1500 mV/m, mapped to the ionosphere. The strongest variations in both the electric and magnetic fields are found to be correlated with intensifications in the up-ward electron flux, downup-ward FAC and intense Poynting flux and are identified to be clearly of a quasi-static nature. The
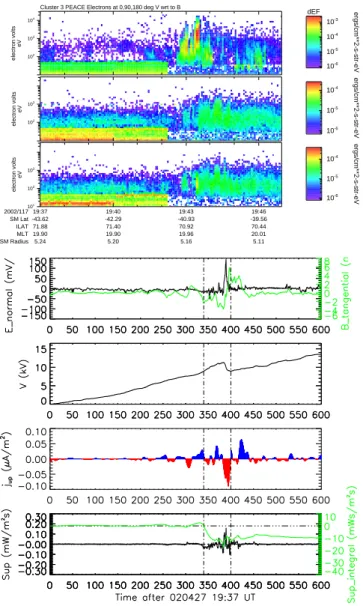
Cluster 3 PEACE Electrons at 0,90,180 deg V wrt to B 10-6 10-5 10-4 10-3 ergs/cm**2-s-str-eV dEF 10-6 10-5 10-4 ergs/cm**2-s-str-eV 10-6 10-5 10-4 ergs/cm**2-s-str-eV 102 103 104 electron volts eV 102 103 electron volts eV 2002/117 SM Lat ILAT MLT SM Radius 101 102 103 electron volts eV 19:37 -43.62 71.88 19.90 5.24 19:40 -42.29 71.40 19.90 5.20 19:43 -40.93 70.92 19.96 5.16 19:46 -39.56 70.44 20.01 5.11
Fig. 10. 27 April 2002, s/c 3. The same panels as in Fig. 2.
region of electron flux enhancement around 375 s, having a characteristic energy of 2–3 keV, was not observed in the passage by s/c 1, and is more intense and corresponds to a higher energy than the region of electron flux enhancement around 350 s. The intensifications are consistent with intense down-going FAC peaks. Compared to the passage by s/c 1, a hill-structure has developed in the potential profile and there is also a larger potential difference over the whole interval, 13 kV compared to 7.5 kV. Two smaller peaks are seen at the edges of the potential hill-structure. Note that none of the good correlated features in electric field structure, the po-tential peak and the intense region of electron flux at 375 s were observed in the passage by s/c 1, nor where the in-tense Poynting fluxes between 370 and 400 s observed in the passage by s/c 1. The downward Poynting flux peak close
to 380 s, mapping to 27 mW/m2, is well correlated with the
main peak in the electric field and the main downward FAC
peak of 10 µA/m2(mapped) and most intense electron flux.
Most of the Poynting flux is restricted to the region domi-nated by spatial variations in the electric and magnetic fields.
S/c 2: The large-scale electric pattern is fairly unchanged (Fig. 9), but a decrease in the amplitude of the peak can be seen and the peak has split into two peaks, and this is also true for the FAC pattern. The correlation between downward FAC peaks and the electric field peak is good. Significant varia-tions compared to the passages by s/c 1 and 4 are observed in the Poynting flux. The main peak at 380 s is upward but the integrated Poynting flux is negative, hence the net Poynt-ing flux is downward, havPoynt-ing contributions from a downward Poynting flux peak at 300 s and another peak around 340 s. The intense positive Poynting flux peak at 385 s is seen to be co-located with a downward FAC peak. The first of the mi-nor peaks at the edges of the potential hill, observed in the passage by s/c 4, is not present in the data from this passage. S/c 3: The electric field pattern is again roughly the same (the amplitude of the peak is higher) but the slope on the equatorward flank of the positive potential hill around 380 s is seen to be steeper than in the passage by s/c 2 (Fig. 10), corresponding to the increase in the electric field peak to 150 mV/m (1700 mV/m mapped). Also, the FAC pattern is fairly unchanged compared to the passages by the other s/c. The narrow region of intense electron flux at 390 s with char-acteristic energy of 2–3 keV is more intense than what was observed by the other s/c in this event and well correlated with the downward FAC peak, with the Poynting flux en-hancement (with the clearest peak in the upward direction and with overall Poynting flux less downward dominated) and the intense electric field peak. The other region of en-hanced electron flux has decreased significantly in intensity compared to the passage by s/c 1 and 4, and the first minor peak in the potential hill-structure is absent, as was also the case for the previous crossing. The correlations between the variations in the electric and magnetic fields, the potential and the electron flux, support the view that spatial variations dominate between 340 and 400 s.
2.3 Summary of observations
Table 1 summarizes the events of 27 April 2002 and 19 May 2002, displaying Geocentric Distance (R), Corrected Geo-magnetic Latitude (CGLat), Magnetic Local Time (MLT),
Kp-index, substorm phase (determined from the AL-index),
evolution of 1V⊥, corresponding 1Vkvalue (inferred from
the characteristic energy of the up-going electrons observed
by the PEACE instrument), Alfv´en velocity (VA) and
devi-ation of the current sheet orientdevi-ation from east-west
align-ment, α. 1V⊥ represents the hill- (positive 1V⊥) and
valley- (negative 1V⊥) shapes in the potential along the s/c
trajectory. The 1Vkand 1V⊥in Table 1 are given for
com-parison; if there is a positive U-shaped potential structure,
these two should be similar. Since the 1V⊥is negative for
the 19 May 2002 event, i.e. a potential well, this cannot be
compared with a 1Vkinferred from up-going electrons. The
calculated Alfv´en velocity is presented together with the ra-tio between the electric field component normal to the current
sheet and the magnetic field tangential component, En/Bt,
3 Discussion and conclusions
The intense electric field events presented here both took place in the local time evening sector, approximately at 20 MLT, in good agreement with statistical results from lower altitudes (Karlsson and Marklund, 1996), and from the relation between intense electric fields and low ionospheric background conductivity (Marklund et al., 1997). The mag-nitude of the maximum electric fields observed here are, if mapped to ionospheric altitudes, approximately 400 and 1500 mV/m, for the two events, similar to reported maximum magnitudes observed at lower altitudes. Also, the two in-tense electric field events were encountered within the PSBL, which could be concluded from inspection of the PEACE electron data and CIS ion data (not shown here).
The question whether the structures encountered are spa-tial or temporal, or both, is fundamental for the understand-ing of their origin. Usunderstand-ing the method described in the com-panion paper, it was found that spatial and temporal varia-tions dominate in different regions. This is supported by the stability of the FAC and the electron distribution between the different s/c, indicating that the most intense variations in the two events described here were predominately spatial. How-ever, in both events, a mix of both Alfv´en waves and current sheets (FACs), sometimes well separated from each other and sometimes superposed, is observed. Alfv´en waves could thus contribute to the variations also in the regions with domi-nating spatial structures. The observed spatial variations are quasi-static electric field structures associated with FAC cur-rent sheets and hence represent an energy transport between the magnetosphere and the ionosphere by FACs. Tempo-ral variations correspond predominately to Alfv´en waves and energy transport by Alfv´enic Poynting flux. The most intense electric fields were found to be associated with spatial varia-tions, whereas Alfv´en wave-dominated regions were found to be characterized by less intense electric fields. An al-ternative interpretation of, what in this paper is considered to be, the quasi-static regions might be that Alfv´en waves travel along the spatial boundaries and that the time delays are given by the encounters by the s/c with these waves. However, these Alfv´en waves must have very low frequen-cies.
The most intense Poynting fluxes in these two events are directed downward and they are correlated with the intense quasi-static electric fields, with downward FAC peaks asso-ciated with up-going electrons and also with the acceleration potential structures. The Alfv´en wave-dominated regions were typically associated with less intense electric fields and less intense Poynting fluxes. Thus, in the events studied here, there is a clear connection between the intense electric fields, FAC current sheets and strong downward Poynting fluxes.
Cluster offers the first opportunity to observe the stabil-ity of the different parameters on various time scales. Vari-ations seen between the satellites indicate which parame-ters are more stable than others on the time scale given by the separation between the s/c in the reference frame of the moving FAC sheet (typically 10–20 s for the events studied
here). The electric and magnetic field patterns, and the asso-ciated FAC pattern are qualitatively not so variable between the satellites, while the perpendicular potential is a parameter that displays some variations. The Poynting flux is seen to be concentrated to a few locations, whose positions remain the same, whereas the magnitudes show strong variations on the time scale of 10–50 s. The variations in the electron energy-time spectrograms between the s/c are generally fairly small, but they show enhancements for the up-going electrons con-sistent with the downward FAC.
In the event of 27 April 2002, the growth of a positive potential structure accelerating electrons away from Earth is seen. A good consistency was obtained between the charac-teristic energy of the up-going electrons, i.e. the acceleration
potential 4Vk, inferred from PEACE electron spectrograms,
and the calculated perpendicular potential 4V⊥ during this
growth period, serving as evidence of quasi-static U- or S-shaped positive potential structures in the auroral return cur-rent region. The effective time lag between the crossings by s/c 1 and s/c 3 was 25 s, taking into account the motion of the structure. During this period the acceleration potential grew by 2.4 kV, but a decay was not observed. In the study by Marklund et al. (2001), where the separations between the s/c were longer, the growth and decay of an acceleration po-tential took place within 200 s. It was suggested by Marklund et al. (2001) that the lifetime is clearly related to the time it takes to evacuate the ionospheric electrons within the flux tube of the downward current, which depends on the FAC magnitude. Since the magnitudes of the FACs in the 27 April 2002 event are about half of that in Marklund et al. (2001), the expected lifetime of the acceleration potential would be more than 200 s. However, the separation between the s/c is small and only growth is observed.
An interesting difference from the event discussed by Marklund et al. (2001) is that the intense electric field struc-tures observed in the two events studied here are unipolar, not bipolar. This is somewhat unexpected since observations at lower altitudes mostly have shown divergent bipolar elec-tric field structures. An S-shaped potential structure might explain the unipolar field structures.
There can be no doubt that both quasi-static structures and Alfv´enic Poynting flux are important for the energy transport between the ionosphere and the magnetosphere. Schriver et al. (2003), for example, have shown that FAC and Alfv´en waves both contribute to the energy transport into the auroral region. Where and under what circumstances each of the two is present and/or dominates is a question of importance and one that is subject to on-going work. The results from Po-lar discussed above pointed at the Alfv´en wave Poynting flux as a major contributor to the powering of the aurora (Keil-ing et al., 2003), and Wygant et al. (2002) have shown that the Alfv´en wave Poynting flux was the larger contributor in their events. The events investigated and presented here im-ply that the most intense electric field structures, associated with FACs and intense downward Poynting flux, were signa-tures of quasi-static acceleration strucsigna-tures. These events oc-curred in the return current region, while the referred work on
Polar data is from the primary current region. This could be a reason for the discrepancy between the results. It has been shown (Keiling et al., 2001) that Alfv´en wave aurora can be associated with aurora at the poleward edge of the PSBL. The results presented here indicate that intense electric fields near the polar cap can also be associated with quasi-static structures. The nature of the electric field structures may depend on whether they are encountered in the primary or return current region, which may explain the differences in observations.
The main conclusions drawn in this study of two intense electric field events are:
1. The energy transport between the magnetosphere and the ionosphere, in these two events (return current re-gion), has contributions from both FACs and Alfv´en wave Poynting fluxes.
2. The most intense electric fields were found to be quasi-static structures associated with moving quasi-quasi-static FAC current sheets. The Alfv´en wave dominated re-gions were found to be associated with less intense electric fields. The most intense Poynting fluxes are downward directed and well correlated with the intense quasi-static electric fields, which implies that, for the
events studied here at a geocentric distance of 5 RE and
during moderate geomagnetic activity, the quasi-static FACs represented the dominant contribution to the en-ergy transport between the magnetosphere and the iono-sphere in the return current region.
3. The FACs and the structure of the associated electron distributions tend to be fairly stable, while the perpdicular potential, correlated with the characteristic en-ergy of the up-going electrons, shows more variations on the time scale between consecutive s/c crossings, of 10–40 s. The Poynting flux peaks vary in magnitude, whereas their locations remain stable.
4. The observed growth of a positive potential structure ac-celerating electrons away from Earth during effectively 25 s gives a lower limit of the lifetime of an acceleration potential growing in magnitude.
5. Upward ions associated with negative potential peaks are observed which demonstrate that at least some neg-ative U-shaped potential structures extend up to 5–
5.5 RE. However, the most significant potential
struc-tures observed at this altitude are positive and associ-ated with up-going accelerassoci-ated electron beams as in the event reported by Marklund et al. (2001).
Acknowledgements. This work was supported by the Swedish Na-tional Space Board and the Royal Institute of Technology. One of the authors, S. Figueiredo, acknowledges the support of the Fundac¸˜ao para a Ciˆencia e a Tecnologia (FCT) under the grant SFRH/BD/6211/2001.
Topical Editor T. Pulkkinen thanks H. Koskinen and A. Keiling for their help in evaluating this paper.
References
Escoubet, C., Russell, C., and Schmidt, R.: The Cluster and Phoenix missions, Space Sci. Rev., 79/1–2, 1–658, 1997. Karlsson, T. and Marklund, G.: A statistically study of intense
low-altitude electric fields observed by Freja, Geophys. Res. Lett., 23, 1005–1008, 1996.
Karlsson, T., Marklund, G., Figueiredo, S., Johansson, T., and Buchert, S.: Separating spatial and temporal variations in auroral and magnetic fields by Cluster multipoint measurements, Ann. Geophys., 22, 7, 2463–2472, 2004.
Keiling, A., Wygant, J., Cattell, C., Johnson, M., Temerin, M., Mozer, F., Kletzing, C., Scudderm, J., Russell, C., Lotko, W., and Streltsov, A.: Large Alfv´en wave power in the plasma sheet boundary layer during the expansion phase of substorms, Geo-phys. Res. Lett., 27, 3169–3172, 2000.
Keiling, A., Wygant, J., Cattell, C., Johnson, M., Temerin, M., Mozer, F., Kletzing, C., Scudder, J., and Russell, C.: Properties of large electric fields in the plasma sheet at 4–7 RE measured with Polar, J. Geophys. Res., 106, 5779–5798, 2001.
Keiling, A., Wygant, J., Cattell, C., Peria, W., Parks, G., Temerin, M., Mozer, F., Russell, C., and Kletzing, C.: Correlation of Alfv´en wave Poynting flux in the plasma sheet at 4–7 RE with
ionospheric electron energy, J. Geophys. Res., 107, A7 SMP 24 1–13, 2002.
Keiling, A., Wygant, J., Cattell, C., Mozer, F., and Russell, C.: The global morphology of wave Poynting flux: Powering the aurora, Science, 299, 383–386, 2003.
Lotko, W., Streltsov, A., and Carlson, C.: Discrete auroral arc, elec-troststic shock and suprathermal electrons powered by disper-sive, anomalously resistive field line resonance, Geophys. Res. Lett., 25, 4449–4452, 1998.
Marklund, G., Karlsson, T., and Clemmons, J.: On low-altitude par-ticle acceleration and intense electric fields and their relation to black aurora, J. Geophys. Res., 102, 17 509–17 522, 1997. Marklund, G., Ivchenko, N., Karlsson, T., Fazakerley, A., Dunlop,
M., Lindquist, P.-A., Buchert, S., Owen, C., Taylor, M., Vaivalds, A., Carter, P., Andr´e, M., and Balogh, A.: Temporal evolution of the electric field accelerating electrons away from the auroral ionosphere, Nature, 414, 724–727, 2001.
Ostgaard, N., Vondrak, R., Gjerlov, J., and Germany, G.: A relation between the energy deposition by electron precipitaion and geo-magnetic indicies during substorms, J. Geophys. Res., 107, A9 SMP 16 1–7, 2002.
Samson, J., Cogger, L., and Pao, Q.: Observations of field line res-onances, auroral arcs, and auroral vortex structures, J. Geophys. Res., 101, 17 373–17 383, 1996.
Samson, J., Rankin, R., and Tikhonchuk, V.: Optical signatures of auroral arcs produced by field line resonances: comparison with satellite observations and modeling, Ann. Geophys., 21, 933– 945, 2003.
Schriver, D., Ashour-Abdalla, M., Strangeway, R., Richard, R., Klezting, C., Dotan, Y., and Wygant, J.: FAST/Polar conjunc-tion study of field-aligned auroral acceleraconjunc-tion and correspond-ing magnetotail drivers, J. Geophys. Res., 108, A9 COA 21 1–21, 2003.
Wygant, J., Keiling, A., Cattell, C., Johnson, M., Lysak, R., Temerin, M., Mozer, F., Kletzing, C., Scudder, J., Peterson, W., Russell, C., Parks, G., Brittnacher, M., Germany, G., and Spann, J.: Polar spacecraft based comparisons of intense electric fields and Poynting flux near and within the plasma sheet-tail bound-ary to UVI images: An energy source for the aurora, J. Geophys. Res., 105, 18 675–18 692, 2000.
Wygant, J., Keiling, A., Cattell, C., Lysak, R., Temerin, M., Mozer, F., Kletzing, C., Scudder, J., Streltsov, V., Lotko, W., and Russell, C.: Evidence for kinetic Alfv´en waves and parallel electron ener-gization at 4–6 REaltitudes in the plasma sheet boundary layer,