HAL Id: hal-00317219
https://hal.archives-ouvertes.fr/hal-00317219
Submitted on 1 Jan 2004
HAL is a multi-disciplinary open access
archive for the deposit and dissemination of
sci-entific research documents, whether they are
pub-lished or not. The documents may come from
teaching and research institutions in France or
abroad, or from public or private research centers.
L’archive ouverte pluridisciplinaire HAL, est
destinée au dépôt et à la diffusion de documents
scientifiques de niveau recherche, publiés ou non,
émanant des établissements d’enseignement et de
recherche français ou étrangers, des laboratoires
publics ou privés.
M. K. Hudson, R. E. Denton, M. R. Lessard, E. G. Miftakhova, R. R.
Anderson
To cite this version:
M. K. Hudson, R. E. Denton, M. R. Lessard, E. G. Miftakhova, R. R. Anderson. A study of
Pc-5 ULF oscillations. Annales Geophysicae, European Geosciences Union, 2004, 22 (1), pp.289-302.
�hal-00317219�
Geophysicae
A study of Pc-5 ULF oscillations
M. K. Hudson1, R. E. Denton1, M. R. Lessard2, E. G. Miftakhova1, and R. R. Anderson3
1Department of Physics and Astronomy, Dartmouth College, Hanover, NH 03755, USA 2Thayer School of Engineering, Dartmouth College, Hanover, NH 03755, USA
3Department of Physics and Astronomy, University of Iowa, Iowa City, IA 52245, USA
Received: 24 September 2002 – Revised: 15 April 2003 – Accepted: 17 April 2003 – Published: 1 January 2004
Abstract. A study of Pc-5 magnetic pulsations using data
from the Combined Release and Radiation Effects Satellite (CRRES) was carried out. Three-component dynamic mag-netic field spectrograms have been used to survey ULF pul-sation activity for the approximate fourteen month lifetime of CRRES. Two-hour panels of dynamic spectra were exam-ined to find events which fall into two basic categories: 1) toroidal modes (fundamental and harmonic resonances) and 2) poloidal modes, which include compressional oscillations. The occurence rates were determined as a function of L value and local time. The main result is a comparable probabil-ity of occurence of toroidal mode oscillations on the dawn and dusk sides of the magnetosphere inside geosynchronous orbit, while poloidal mode oscillations occur predominantly along the dusk side, consistent with high azimuthal mode number excitation by ring current ions.
Pc-5 pulsations following Storm Sudden Commencements (SSCs) were examined separately. The spatial distribution of modes for the SSC events was consistent with the statistical study for the lifetime of CRRES. The toroidal fundamental (and harmonic) resonances are the dominant mode seen on the dawn-side of the magnetosphere following SSCs. Power is mixed in all three components. In the 21 dusk side SSC events there were only a few examples of purely compres-sional (two) or radial (one) power in the CRRES study, a few more examples of purely toroidal modes (six), with all three components predominant in about half (ten) of the events.
Key words. Magnetospheric physics (MHD waves and
in-stabilities; magnetospheric configuration and dynamics) – Space plasma physics (waves and instabilities)
1 Introduction
Ultra-low-frequency (ULF) waves were first observed in ground-based magnetometer measurements more than a
Correspondence to: M. K. Hudson
century ago by Stewart (1861) including the appearance of quasi-sinusoidal magnetic oscillations with periods of a few minutes (150–600 s, 2–7 mHz frequency), now categorized as Pc-5 oscillations (Jacobs, 1964). In situ measurements of ULF oscillations, primarily at geosynchronous orbit, were reported in the 1960s. Statistical studies were performed with the ISEE 1 and 2 (Zhu and Kivelson, 1991), AMPTE CCE (Anderson et al., 1990) and AMPTE IRM (Lessard et al., 1999) satellites with more eccentric orbits. A number of studies using different devices such as ground magnetome-ters, radars, and geosynchronous satellites, have been car-ried out (see review by Hughes, 1994) prior to the ISEE and AMPTE studies. Since magnetometers measure the mag-netic field at a single point, the definition of wave propaga-tion direcpropaga-tion and wavelength is ambiguous unless multipoint measurements are made (Takahashi et al., 1985) or wave electric field measurements are incorporated (Clemmons et al., 2000). Radar measurements have provided additional constraints on these parameters, radial localization and local time distribution (Walker et al., 1979; Fenrich et al., 1995). The purpose of these and the present CRRES study has been to understand the global morphology and to identify the gen-eration mechanisms of ULF waves.
There are several properties of pulsations to be taken into account in such studies: frequency characteristics, including harmonic structure; spatial distribution; polarization proper-ties; correlation with solar wind parameters; relation to ge-omagnetic activity, for example, phases of storms and sub-storms; correlation with particle signatures. ULF waves have a range of frequencies from 1 mHz corresponding to the low-est frequency that the magnetospheric cavity can support to the ion gyrofrequency, which is in the 1 Hz range out-side the plasmapause. The amplitude of the perturbations varies from fractions of a nanotesla to several hundred, with the largest amplitude usually occurring in the longer-period waves at high latitudes (auroral zone). A variety of mecha-nisms can produce ULF waves. Dungey (1954) first recog-nized that magnetic pulsations observed on the ground are hydromagnetic eigenmodes of approximately dipolar
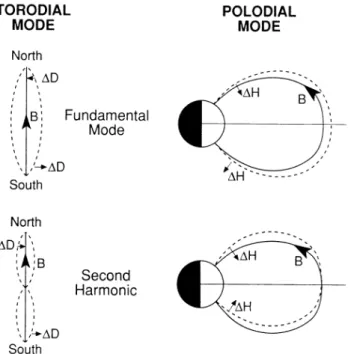
geo-Fig. 1. Toroidal and poloidal mode fundamental and second
har-monic perturbations sketched in a meridional plane, right, and look-ing earthward at a field line stretched from north to south, left (Hughes, 1994). 1D and 1H refer to east-west and north-south perturbations, respectively.
magnetic field lines. The physical model is that of field lines fixed at both ends in a perfectly conducting ionosphere, with harmonic standing waves between hemispheres whose fre-quency is a function of the length of the field line and number of nodes along the field line, as well as the plasma density and magnetic field which determine the Alfv´en speed. As-suming that a wave propagates in the form of exp(imφ −iωt) in an axially symmetric field, where φ is the azimuthal phase angle and m is the azimuthal mode number, we can write the full hydrodynamic wave equations in cylindrical coordinates in terms of the usual fluid density ρ, velocity u, electric and magnetic field variables as follows (Radoskii, 1967; Hughes, 1994): ω2µ0ρ − 1 r(B · 5)r 2(B · 5)(uφ r ) = ωm( B · b r ) (1) (ω2µ0ρ − rB2(B · 5) 1 r2B2(B · 5))(rEφ) = ıωB2(B · 5)φ B · b B2 (2) iωB · b = 1 r(B · 5)φ(rEφ) − imB 2uφ r . (3)
The left-hand sides of the first two equations have deriva-tives along the magnetic field direction b, B · 5 (defined in terms of the total magnetic field, background plus perturbed); they can be considered as one-dimensional wave equations.
The right-hand sides of both equations depend on the com-pressional part of the hydromagnetic wave. The third equa-tion closes the set. Though the equaequa-tions are coupled and have not been solved in general, with certain assumptions they can be solved for toroidal, poloidal and compressional mode waves.
In the limit that the azimuthal mode number m goes to in-finity, the product B·b must be zero, in order for the left-hand side of the first equation to be finite. Then, the right-hand side of the second equation vanishes and the equation de-scribes a poloidal mode standing Alfv´en wave (in a homoge-neous system, the dispersion relation would be ω2=k||2VA2, where VA2 = B2/(µ0ρ)). The corresponding fundamental
and next (here labeled second) harmonic poloidal modes are shown on the right side of Fig. 1.
The electric field varies azimuthally (east-west) and the magnetic field oscillates radially. For this limit, perturba-tions on a meridional plane can be considered to be decou-pled from those on adjacent planes.
In the m = 0 limit, the first two equations decouple and two independent solutions result. The first equation describes the toroidal mode. The left side of Fig. 1 illustrates the two low-est harmonics of this mode. The magnetic field and velocity oscillate in the azimuthal direction, while the electric field has radial fluctuations. Each L-shell oscillates azimuthally independent of the others. The second equation describes the compressive (or fast) mode.
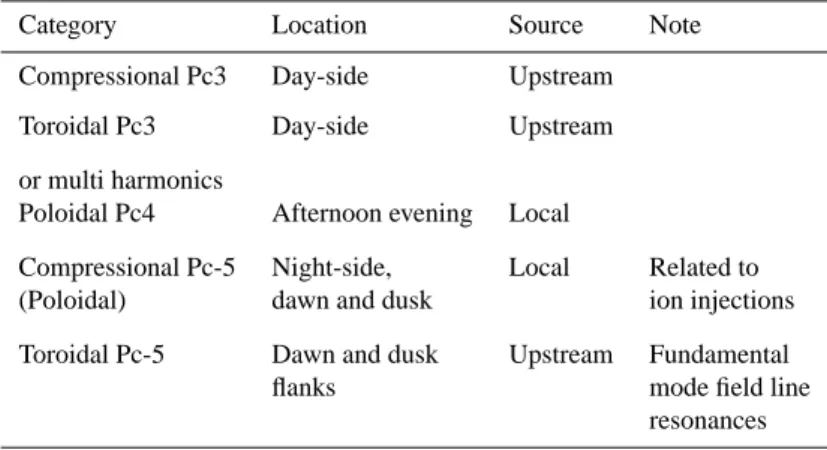
If m goes to 0 but is not equal to it, modes described by Eq. (1) and (2) can couple. Physically, field lines with standing Alfv´en wave frequencies matching one of the cav-ity mode eigenfrequencies may be excited (Goldstein et al., 1999). Thus, the energy of the magnetospheric cavity trans-fers to field line resonances. Ultimately, ULF pulsations derive their energy from the solar wind. Pulsations pro-duced either in the solar wind/magnetosheath or at the mag-netopause/boundary layer (so-called “upstream source”) may couple energy directly from the solar wind, while the ring current can act as an intermediary in transferring solar wind energy. It is important to determine whether the source of the waves is external or internal to the magnetosphere (Fenrich et al., 1995), in order to understand the efficiency and time-scale of solar wind driven excitation of ULF waves. Those modes, typically low m number toroidal oscillations, excited directly by upstream solar wind perturbations and velocity shear instability at the magnetopause (Miura, 1992), will re-spond more immediately to changing solar wind conditions than internal instabilities requiring a buildup of the ring cur-rent. Internal instabilities of high m-number poloidal modes are excited by ring current ions injected into the dusk to noon sector (Southwood, 1976; Chen and Hasegawa, 1991), which, in turn have been energized by the convection electric field imposed by the solar wind. According to their origin, Pc perturbations have been classified as in Table 1 (Ander-son, 1994).
The focus of the present study is on Pc-5 oscillations, par-ticularly poloidal and toroidal Pc-5 modes. Poloidal Pc-5
Table 1. Category, location and source of different types of Pc 3-5 oscillations (based on Anderson, 1994).
Category Location Source Note
Compressional Pc3 Day-side Upstream Toroidal Pc3 Day-side Upstream or multi harmonics
Poloidal Pc4 Afternoon evening Local
Compressional Pc-5 Night-side, Local Related to (Poloidal) dawn and dusk ion injections Toroidal Pc-5 Dawn and dusk Upstream Fundamental
flanks mode field line
resonances
waves with power in both radial and compressional com-ponents were first observed in situ and reported by Son-nerup et al. (1969), based on Explorer 26 magnetometer data. These waves commonly occur on the dusk-side of the magnetosphere. It has been shown that poloidal Pc5 pulsations may be generated by the pressure anisotropy of the ions, which drives local wave-particle instability (South-wood, 1974; Chen and Hasegawa, 1974). The excitation mechanism is fundamentally kinetic for a plasma beta (ratio of kinetic to magnetic pressure) typical of the ring current, involving drift bounce resonance of ring current ions with high (m ∼ 100) azimuthal mode number oscillations.
Toroidal mode Pc-5 waves are low m number field line res-onances (see review by Glassmeier, 1995). Statistical stud-ies using radar and ground magnetometers have shown that toroidal mode Pc-5s have a peak occurrence on the dawn-side of the magnetosphere. Some satellite studies have shown greater dawn-dusk symmetry (Glassmeir and Stellmacher, 2000), while others support a higher probability of occur-rence on the dawn-side (Anderson et al., 1990; Lessard et al., 1999; Takahashi et al., 2002). Toroidal mode Pc-5 waves have been attributed to excitation by the Kelvin-Helmholz instability due to velocity shear, which is greatest along the flanks of the magnetosphere (Miura, 1992).
2 Observations
The Combined Release and Radiation Effects Satellite (CR-RES) was launched on 25 July 1990, at 19:21 UT into a geosynchronous transfer orbit, with an apogee near geosyn-chronous orbit (actually 6.3 RE, but larger in L), perigee
at 350 km, an orbital period of 9.9 h and an inclination of 18.2 degrees relative to the equatorial plane. The spin axis was oriented within 15 degrees of the Sun such that the so-lar panels (located on top of the spacecraft) were continu-ously illuminated by the Sun and the spin period was about 30 s. The orientation and relatively low spin rate provided very low levels of solar-array interference as compared to most other magnetospheric spacecraft. In the approximate
fourteen months that CRRES operated, the magnetic local time (MLT) of apogee regressed at a rate of 15 h/yr from
≈08:00 MLT through midnight to 13:30 MLT, so a complete local time sweep was not covered. CRRES carried a wide range of particle detectors and a triaxial fluxgate magnetome-ter mounted at the end of a 6.1 m boom (Singer et al., 1992), and a plasma wave receiver connected to a 100 m long-wire electric dipole antenna perpendicular to the spin axis (An-derson et al., 1992). The magnetic field data was sampled at a rate of 16 samples per second. The telemetered data stream in sensor coordinates was routinely calibrated and transformed into a 2-s data base in a VDH coordinate system. In this cylindrical system, H is anti-parallel to the magnetic dipole axis (parallel to the magnetic field at the equator), V is radially outward in the magnetic equatorial plane (in the magnetic meridian perpendicular to H), and D is eastward, completing the set. The spin axis of CRRES was roughly parallel to the x-component of the GSE system. The mag-netometer was capable of operating in two resolution modes and was controlled automatically, however, for the data used in this analysis, it was operated in high gain mode with a sensitivity of 0.43 nT (for fields < 850 nT).
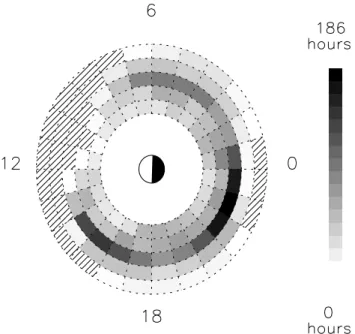
The total observation time is presented in Fig. 2, binned in equatorial plane radial distance (referred to here as L-shell) and local time. The hatched bins are those where CRRES spent less than 9 h. As can be seen, while the CRRES satel-lite covered most local times and L-shells in a range from 2 to 9, it spent more time on the dawn and dusk sides of the magnetosphere and nightside, with little coverage on the day-side around noon.
The magnetic field data with a 2-s resolution was first lin-early interpolated to fill the gaps of 120 s or less and then averaged over a period of 30 min, to obtain the background magnetic field. For each data point, a segment of 900 data en-tries centered on a given data point was fitted with a straight line. The value of the midpoint of the fitted line was taken to be the magnitude of the background magnetic field at the time of the given data point. The segment of 900 data points was chosen in order to remove the background field without reducing Pc-5 pulsation amplitudes. The calculated
Fig. 2. Total observation time spent in each L-LT bin (L = 4–9) by
the CRRES satellite.
background field was subtracted from the original data and the obtained detrended data were used to calculate the dy-namic spectra. For each component, segments of 256 points were extracted and a Hanning window was applied (Lessard et al., 1999). The spectral power was calculated using a fast Fourier transform. The calculations were repeated un-til enough spectra were accumulated to fill two-hour panels. The power spectral density was then plotted using a log scale that spans several orders of magnitude to cover the range in wave power. The magnetic local time, L-shell and magnetic latitude are included on the plot. The plots of detrended magnetic field data and its dynamic spectra were visually scanned to find various events. The data were compared with the fundamental field line resonance (FLR) frequency calculated using the electron density determined from mea-surements by the plasma wave instrument on CRRES (An-derson et al., 1992) of either the upper hybrid resonance or the electron plasma frequency. Physically, the FLR model is a standing Alfv´en wave with endpoints tied to an assumed perfectly conducting ionosphere. Figure 1 shows examples of harmonics.
Calculation of the normalized FLR toroidal mode fun-damental frequency from the measured plasma density and background magnetic field is described by Schulz (1996) or Denton and Gallagher (2000), using the mass factor (ratio of mass density to electron density) from the Global Core Plasma Model (GCPM) (Gallagher et al., 2000). (In the GCPM, the mass factor is close to 1.15 in the regions we will be considering.) This frequency is superimposed on the spectral plots of each field component shown later to assist in mode identification. In the following section we present a statistical analysis of Pc-5 oscillations as measured by the CRRES magnetometer and sorted by toroidal and poloidal
polarization in the VDH coordinate system. An analysis of Storm Sudden Commencement (SSC) events during the 14-month lifetime of CRRES is then summarized. In the absence of continuous solar wind measurements during the lifetime of CRRES, SSCs were chosen to enable a focus on sudden changes in solar wind conditions as a driver of ULF wave oscillations. This was a particularly active time period around the Cycle 22 solar maximum, rich in SSC events.
3 Statistical study
The purpose of this study is to determine the occurrence rates of different types of pulsations over all local times in the region from L=2 to L=10 for the lifetime of CRRES (14 months). Two types of events were considered in the study: toroidal and poloidal mode pulsations, including both fundamental and harmonic resonances. Plots with dynamic spectra and magnetic field data along with coordinate plots were visually examined to find those events. The duration of the events, the magnetic local time and the position of the satellite were recorded. The resulting occurrence rates were normalized to the total observation time for each space bin (L-shell, MLT), shown in Fig. 2.
4 Toroidal pulsations
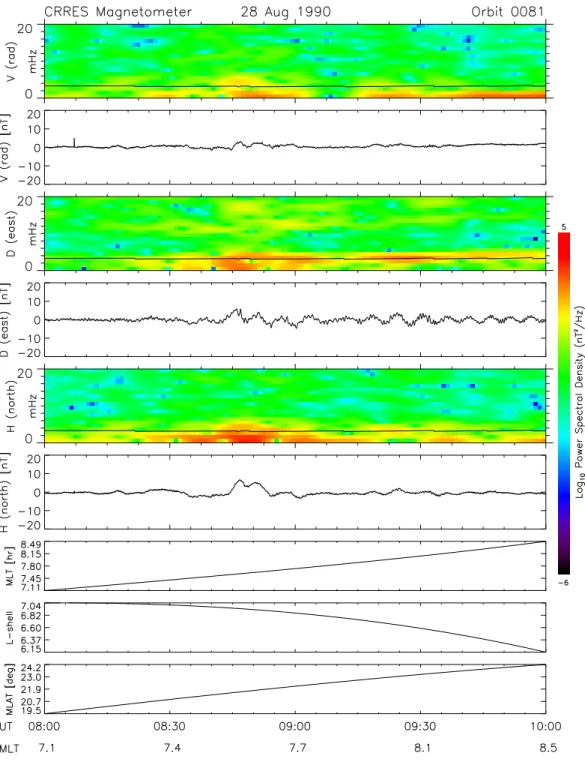
Toroidal pulsations are the most frequently observed and well-defined magnetic pulsations. In this study the defini-tion given by Anderson et al. (1990) was used to identify fundamental and harmonic resonances. The narrow band signal, with 1f <2 mHz seen in the toroidal component and frequency decreasing as L-shell increases (Samson and Ros-toker, 1972), is considered to be the resonance. If the fre-quency is less than 10 mHz, the event is identified as a fun-damental resonance, otherwise as a harmonic. An example of such an event is shown in Fig. 3 for the time interval 08:00– 10:00 UT, orbit 81, 28 August 1990. The first two panels show the dynamic spectra and detrended magnetic field data radial component (V component). The second set presents the eastward component (D) and the third is the compres-sional (parallel to B) component (H). The next three plots show the magnetic local time (MLT), L-shell and magnetic latitude (Mlat). The black curve on the dynamic spectra represents the fundamental Field Line Resonance (FLR) fre-quency calculated using local density determined from the upper hybrid resonance or electron plasma frequency mea-sured by the plasma wave instrument on CRRES (Anderson et al., 1992). The frequency range on the dynamic spectra is 0–20 mHz, chosen in order to see the signature of Pc-5 os-cillations. The magnetic field range is −20 nT to 20 nT in this example, −5 nT to 5 nT or −50 nT to 50 nT in other ex-amples, depending on the maximum value of the magnetic field perturbation for a given interval. A well-defined sig-nal is seen in the eastward magnetic field component for the time interval 08:30–10:00 UT. The frequency of the pulsation is about 3 mHz, with a 2 mHz bandwidth, and is consistent
Fig. 3. Sample of toroidal pulsation measured by the CRRES magnetometer on 28 August 1990. See Toroidal Pulsations text for detailed
Fig. 4. Occurence rates of toroidal Pc-5 pulsations measured by
CRRES.
with the theoretical fundamental FLR frequency, indicated by the solid curve. The amplitude is 5 nT, which is com-mon for satellite measurements of toroidal Pc-5 oscillations near geosynchronous orbit. The L dependence of the funda-mental frequency can be observed. While the L-shell is de-creasing from 7 to 6.15, the fundamental frequency slowly increases from 3 mHz to 4 mHz. Along with the funda-mental resonance, the third and fourth harmonics are seen in the toroidal component with frequencies of 12 mHz and 17 mHz, respectively. The second harmonic which has an equatorial maximum could not be observed at CRRES be-cause the satellite had an 18.2 degree inclination. (These identifications are consistent with a mass density distribution
ρ = ρ0(LRE/R)1, where ρ0 is the equatorial mass density
(Schulz, 1996; Denton and Gallagher, 2000).) These har-monics are observed for the time periods 08:55–09:10 UT and 09:28–09:38 UT. No signal is seen in the poloidal com-ponents consistent with the fundamental or harmonics.
The statistical distribution of the fundamental toroidal res-onance is presented in Fig. 4, normalized by the observation time spent in each L–LT bin (Fig. 2). As seen, toroidal os-cillations tend to occur on the dawn and dusk sides of the magnetosphere at L = 6 to 8 for the CRRES study. Lack of spatial coverage between 08:00–13:00 LT (Fig. 2) precludes a conclusion about dayside occurence, but there is a clear absence of fundamental toroidal mode power near midnight. The local time distribution is consistent with the compara-ble dawn-dusk occurence of narrow band Pc-5 wave power reported by Glassmeier and Stellmacher (2000) based on geosynchronous GOES 6 data, while the AMPTE IRM study by Lessard et al., (1999) found more events on the dawn than dusk side of the magnetosphere at higher L-values, as did the AMPTE CCE study of Anderson et al., (1990) and Taka-hashi et al., (2002). The apogee of CRRES was at 6.3 RE,
so the satellite spent most of its time at L-values between 5 and 8, while AMPTE IRM had an apogee at 18 RE, and
thus crossed low L-shells rapidly. AMPTE CCE, with a 9 RE
apogee, was intermediate in L-coverage. AMPTE IRM also had a higher geographic inclination (28.6 degrees) than CR-RES (18.2 degrees), while AMPTE CCE was lower (4.8 de-grees), which can affect the probability of observing modes with an equatorial or near-equatorial node (Denton et al., 2001).
The interpretation of toroidal mode FLRs as standing Alfv´en waves is well suported by our calculation of the fun-damental frequency based on the CRRES plasma wave in-strument determination of local plasma density. The dawn-dusk occurrence has been attributed to the excitation of sur-face waves on the magnetopause by the Kelvin-Helmholtz instability (Miura, 1992). Coupling of surface wave energy into field line resonances has been examined by Chen and Hasegawa (1974). Figure 4 is consistent with other studies in finding a greater probability of occurrence at higher L-values, closer to the magnetopause source (Anderson et al., 1990; Lessard et al., 1999). Ground-based observations of Pc-5 pulsations show a strong dawn-dusk asymmetry which has been attributed to, among other things, ionospheric screen-ing of shorter wavelength modes on the dusk side (Yumoto et al., 1983), local time dependence of field line resonance widths (Glassmeier and Stellmacher, 2000) and a variation in the instability at the magnetopause. The critical veloc-ity threshold for the Kelvin-Helmholz instabilveloc-ity increases with the intensity of the magnetosheath magnetic field (Lee et al., 1981), which is greater at the dusk side due to mag-netosheath compression. Since the magmag-netosheath flow ve-locity increases along the flanks of the magnetosphere from an ideal subsolar stagnation point, the flow may be unsta-ble farther downstream on the dusk side than dawn-side, due to magnetosheath magnetic field compression (Lee et al., 1981), leading to the type of asymmetry observed by Lessard et al. (1999, Fig. 6).
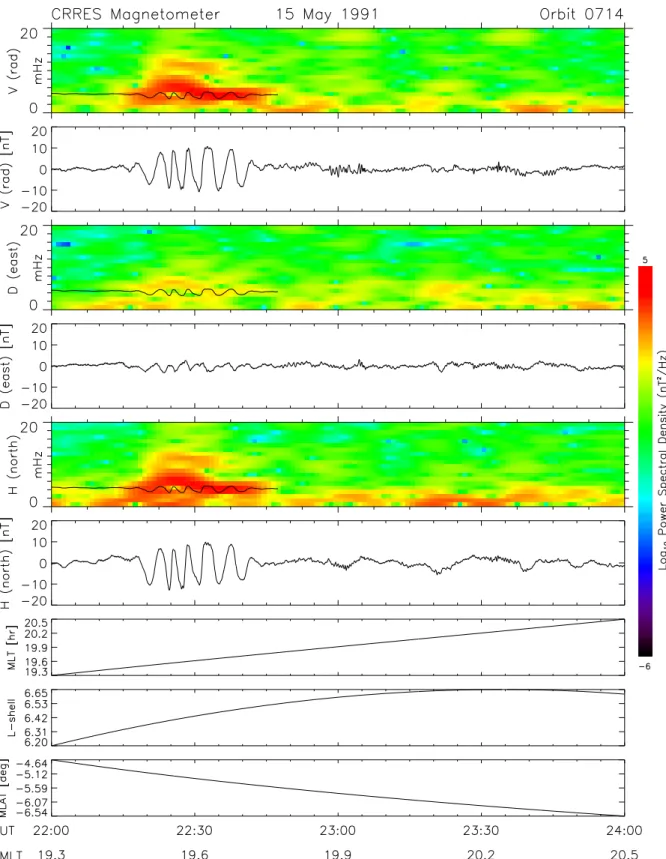
5 Poloidal pulsations
Poloidal mode pulsations are characterized by a narrow band signal in the radial and compressional components with fre-quencies less than 10 mHz. Figure 5 shows an example of this type of event. The pulsation starts at 22:15 UT and lasts for half an hour. It has an amplitude of 9 nT and a frequency of 4–5 mHz. The signal is 3 mHz wide and is about equal to the theoretical fundamental FLR frequency (black curve). For zero pressure, poloidal pulsations are expected to have slightly lower FLR frequencies than the toroidal mode, as discussed in Cummings et al. (1969). A larger effect (for odd modes, not necessarily the fundamental) occurs when an inward pressure gradient reduces the poloidal but not the toroidal mode frequency (Vetoulis and Chen, 1996). The agreement here of the observed poloidal mode frequency and that of the fundamental toroidal mode argues that the ob-served wave may have fundamental structure along the field
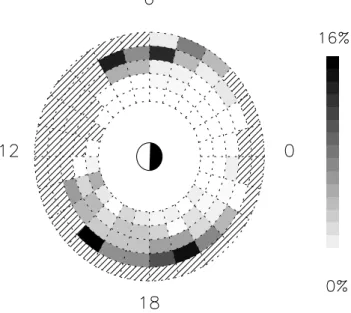
Fig. 6. Occurence rates of poloidal Pc-5 pulsations measured by
CRRES.
line, although on theoretical grounds, we would expect the second harmonic (Cheng and Lin, 1987). The black curve in Fig. 5 shows a variation in frequency which most likely results from the large amplitude oscillation in B. This obser-vation is rare and not a necessary feature of poloidal pulsa-tions. While there is strong evidence of oscillations in radial and compressional components with the same shape, the dy-namic spectra in the eastward (toroidal) component shows very weak activity. Other events similar to the one shown in Fig. 5 were found and recorded.
Figure 6 shows the occurrence rates of poloidal pulsations. The oscillations occur predominantly on the dusk side of the magnetosphere. None are seen at noon, where spacecraft coverage was limited (Fig. 2). Higher occurence rates are evident at L = 7–9. This distribution suggests ion injection as a possible source of poloidal mode oscillation. Ions injected into the ring current during geomagnetic storms produce high
mnumber poloidal modes, as they drift around the dusk side, by a drift-bounce resonant kinetic interaction (Southwood et al., 1969; Chen and Hasegawa, 1991). Dipolarization during substorms and bursty bulk flows will also produce a poloidal mode signature in the evening sector (Lessard et al., 1999).
6 Storm Sudden Commencement (SSC) events
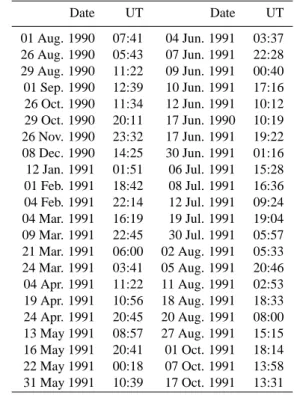
In this section several Storm Sudden Commencement (SSC) events are discussed. Times were chosen according to the A-Quality (“very remarkable”) SSC list from the IAGA Bul-letin, Geomagnetic Data 1990–91 (Table 2).
Classification of the SSC events was based on low latitude ground magnetometer observatories. An SSC or sudden im-pulse (SI) is defined as a sudden increase in the geomagnetic-field intensity of a few tens or more nanotesla, caused ulti-mately by an increase in solar-wind dynamic pressure. This
Table 2. SSC List. Date UT Date UT 01 Aug. 1990 07:41 04 Jun. 1991 03:37 26 Aug. 1990 05:43 07 Jun. 1991 22:28 29 Aug. 1990 11:22 09 Jun. 1991 00:40 01 Sep. 1990 12:39 10 Jun. 1991 17:16 26 Oct. 1990 11:34 12 Jun. 1991 10:12 29 Oct. 1990 20:11 17 Jun. 1990 10:19 26 Nov. 1990 23:32 17 Jun. 1991 19:22 08 Dec. 1990 14:25 30 Jun. 1991 01:16 12 Jan. 1991 01:51 06 Jul. 1991 15:28 01 Feb. 1991 18:42 08 Jul. 1991 16:36 04 Feb. 1991 22:14 12 Jul. 1991 09:24 04 Mar. 1991 16:19 19 Jul. 1991 19:04 09 Mar. 1991 22:45 30 Jul. 1991 05:57 21 Mar. 1991 06:00 02 Aug. 1991 05:33 24 Mar. 1991 03:41 05 Aug. 1991 20:46 04 Apr. 1991 11:22 11 Aug. 1991 02:53 19 Apr. 1991 10:56 18 Aug. 1991 18:33 24 Apr. 1991 20:45 20 Aug. 1991 08:00 13 May 1991 08:57 27 Aug. 1991 15:15 16 May 1991 20:41 01 Oct. 1991 18:14 22 May 1991 00:18 07 Oct. 1991 13:58 31 May 1991 10:39 17 Oct. 1991 13:31
sudden increase is called an SSC if the event is followed by a storm and an SI, if it is not.
During the lifetime of CRRES, there were 44 such SSC events from which we have excluded 13 due to the absence of data, invalid measurements, for example, near perigee where the background magnetic field strength precludes an accu-rate measurement of the fluctuating field, or the presence of very strong activity which saturates the measurement of FLR mode structure. The spatial distribution of the remaining 31 events are shown in Fig. 7.
The events are color coded by their dominant polariza-tion, with toroidal (red), compressional (green), radial (light blue), all three components (black) and no response (yellow). Open circles indicate less certainty in the identification of the modes, but a clear presence of ULF oscillations in the 1–10 mHz range. The dawn-side SSC events were clearly dominated by toroidal mode oscillations (red), while there is a mixture of polarizations observed on the dusk side. The predominant noon to dusk signature is power in all three modes (black).
For each event we examined 2-s CRRES detrended mag-netic field data, its dynamic spectra and orbital summary plots for the appropriate time interval. Two are presented as examples, 26 August 1990, because of the availability of simultaneous IMP 8 solar wind data, and 1 September 1990, as an example of a double SSC interval.
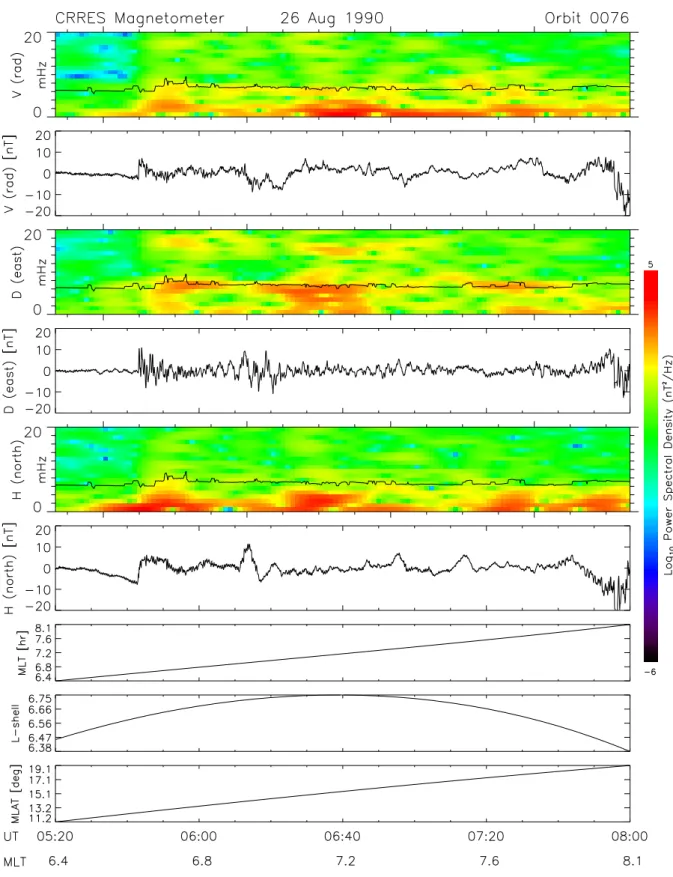
6.1 26 August 1990
A sample SSC event occurred at 05:43 UT, orbit 76, 26 August 1990. Figure 8 shows data for the interval
X
Y
Fig. 7. CRRES SSC events color coded by their dominant
polariza-tion, with toroidal (red), compressional (green), radial (light blue), all three components (black) and no response (yellow). Open circles indicate less certainty in identification of the modes.
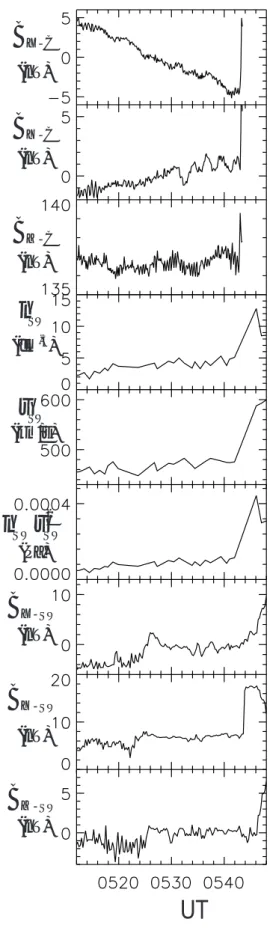
05:20–08:00 UT. The CRRES satellite was near apogee at L = 6.3, MLT = 6.8 and Mlat = 12.0 degrees at the time of the SSC. The magnetic field increased in 3 min by 14.5 nT in the compressional component, 11 nT in the radial and by 7 nT in the eastward component, with a rise of 22 nT in the total field. Oscillations are evident in all three components for almost 8 h. The toroidal oscillation, with amplitude of 3 nT, is seen for the interval 05:32–05:43 UT. The dynamic spectra show power around 7 mHz, which is consistent with the theoretical fundamental FLR frequency calculated from the local plasma density measurement (solid curve). A precursor toroidal os-cillation of amplitude 1–2 nT at the same fundamental fre-quency indicated by the line plot is seen prior to the SSC, greatly amplified and lasting about 90 minutes after the SSC, along with enhanced power in the poloidal (radial and com-pressional) components. IMP 8 data at x = 0, y = −30 RE,
z = 5 RE in GSM coordinates, along the dawn-side of the
magnetosphere, is shown in Fig. 9.
These data show evidence of solar wind Bx oscillations prior to the SSC in the same frequency range as the precur-sor oscillations evident at CRRES in By (eastward compo-nent), both following a sudden increase in solar wind Bx at 05:26 UT. The data also shows a sudden increase in the solar wind speed and density that corresponds to the arrival of the interplanetary shock at 05:43 UT, responsible for the SSC.
In the toroidal component of Fig. 8 we can also see the presence of the second harmonic during the intervals 05:40– 06:00 UT and 06:10–06:40 UT. The frequency of this pulsa-tion is about 16–18 mHz for the first period and 15–17 mHz for the second one. Presence of the harmonic is seen in
the radial component for the first period with a frequency of 17 mHz. The theoretically calculated frequency for the second harmonic is 18.4 mHz in this case.
6.2 1 September 1990
Figure 10 shows plots for 10:10–13:00 UT, orbit 91, 1 September 1990, with an example of a double SSC, a “B-Quality” (fair, ordinary but unmistakable) SSC at 10:24 UT followed by an “A-Quality” SSC at 12:39 UT, from IAGA Bulletin, Geomagnetic Data 1990–91, Table 2). Such events are not uncommon, caused by forward and reverse solar wind shocks, resulting from a steepening of a disturbance propa-gating upstream and downstream in the solar wind frame, away from a discontinuity (Holzer, 1979). When the sec-ond SSC occurred at 12:39 UT, CRRES was near apogee at L = 7.68, Mlat = 28.2 degrees and MLT = 8.3. Following the first SSC, toroidal oscillations are evident with a frequency fitting the theoretical fundamental FLR calculation (black curve). This pulsation starts at 10:24 UT and lasts for 2 h, continuing after the second SSC. The amplitude after the first SSC is about 5 nT, and it increases to 20–50 nT after the sec-ond, stronger SSC. The frequency of the pulsation slowly increases from 7 mHz at 12:00 UT to 8 mHz at 13:05 UT. There are weak and long period (below the fundamental) os-cillations in the toroidal and compressional components prior to the first SSC at 10:24 UT, but there is no solar wind data available for this period for comparison.
After the second SSC, power is evident in all three com-ponents during the time interval 12:35–13:00 UT. There is an average increase in the fundamental mode frequency due to increasing magnetic field strength, as indicated by the line plot on the color spectrograms, as CRRES moved radially inward in L. Any decrease in frequency due to increasing density as the plasmapause is approached is more subtle, as one might expect from the stronger dependence of Alfv´en speed, which determines the standing wave frequencies, on
Brather than on√ρ.
From the 31 SSC events analyzed, 10 were observed when CRRES was post midnight, on the dawn-side of the magne-tosphere; 21 were observed when CRRES was premidnight on the dusk side, reflecting the large number of SSC events from March – October, 1991, and rotation of the CRRES or-bital plane. A comparison of Fig. 7 with Fig. 2 shows that CRRES sampled SSC at all local times covered by the orbit. Figure 7 shows that dawn-side SSCs excite predominantly toroidal modes (red), and there is mixture of polarizations observed on the dusk side. The predominant noon to dusk signature is power in all three modes (black).
7 Discussion and conclusions
Analysis of magnetometer data from the CRRES satellite has been presented in two parts: a statistical study of the polar-ization and spatial distribution of modes in L and local time, independent of geomagnetic conditions; and a study of time
intervals marked by the occurence of Storm Sudden Com-mencements.
From the statistical survey for all conditions we conclude that:
1. Toroidal magnetic pulsations are fundamental field line resonances that match the frequency calculated from a deter-mination of the local plasma density based on the upper hy-brid resonance frequency or the electron plasma frequency measured by the CRRES plasma wave instrument (Ander-son, 1992). While there have been many studies, going back to Cummings et al. (1969), which compare measured Pc-5 ULF wave frequencies with model calculations, few have used local plasma density measurements to validate the cal-culation (Denton et al., 2001).
2. Toroidal mode power is distributed fairly equally be-tween the dawn and dusk flanks of the magnetosphere in-side L = 8, with greater probability of occurrence at higher L-values. The former result differs from AMPTE CCE and AMPTE IRM satellite studies at higher L-values at solar min-imum (Anderson et al., 1990; Lessard et al., 1999; Takahashi et al., 2002), but is consistent with a recent analysis of a six month interval of GOES 6 geosynchronous data in 1993, a period characterized by 27-day recurring high speed solar wind streams characteristic of the declining phase of the solar cycle (Knipp et al., 1998). The occurence of Pc-5 oscillations has been correlated with high speed solar wind periods (En-gebretson et al., 1998; O’Brien et al., 2001), providing some support for the Kelvin-Helmholtz theory of toroidal mode FLR excitation. The high occurrence rate of toroidal modes on the dusk side in the CRRES study may be affected by the large occurrence rate of SSCs during the March – October, 1991 phase of the CRRES orbit, see Table 2. To examine this posibility, a separate study of the SSC polarizations was undertaken.
3. Poloidal modes were observed to occur premidnight, consistent with the distribution of storm-time pulsations (An-derson et al., 1990; Lessard et al., 1999) and the injection of ring current ions as a source population for exciting high m-number poloidal modes via drift bounce resonance (South-wood et al., 1969; Chen and Hasegawa, 1988). They could also be signatures of substorm dipolarization or bursty bulk flows (Lessard et al., 1999).
The study of SSC events provides two main conclusions: 1. The toroidal fundamental (and harmonic) resonances are the dominant mode seen on the dawn-side of the magne-tosphere following a Storm Sudden Commencement (SSCs). 2. Power is mixed in all three components on the dusk side following SSCs, with few examples of purely compressional (two) or radial (one) power in the CRRES study, and more examples of purely toroidal (six) modes, but all three com-ponents predominant (ten) in the 21 dusk-side SSCs. The magnetosphere is more strongly disturbed during SSC peri-ods, with the injection of ring current ions available to drive poloidal modes in the dusk sector superimposed on any mag-netopause boundary-driven toroidal oscillations. It is not sur-prising that the SSC polarization characteristics indicated in Fig. 7 combine the spatial distribution of modes integrated
UT
C -XB
SW -XB
SW -YB
C -YB
C -ZB
SW -ZB
SWv
SWn
2 SW SWv
n
(nT)
(nT)
(nT)
(nT)
(nT)
(nT)
)
(cm
-3)
(Pa
)
(km/s
Fig. 9. Magnetic field at CRRES (top three panels) compared with
IMP 8 measurements of solar wind (next six panels) density, veloc-ity, dynamic pressure, and magnetic field in GSM coordinates for the time interval 05:10–05:50 UT, 26 August 1990.
over all levels of geomagnetic activity (Fig. 4 for toroidal and Fig. 6 for poloidal modes). It is important to note that our statistical study is based on 2–4 h intervals of data en-compassing the SSCs, which allows for the buildup of the ring current. A study of the polarization characteristics of ULF waves associated with SSCs with a longer period than the fourteen month lifetime of CRRES will improve our con-fidence in the statistical significance of Fig. 7.
CRRES provides the only near-equatorial plane, geosynchronous-transfer orbit data to date on ULF wave mode structure and power in the inner magnetosphere. CRRES measurements covered a period of high geomag-netic activity at the Cycle 22 solar maximum, which may account for the greater dawn-dusk symmetry in toroidal mode power than reported in the AMPTE studies from solar minimum. Consistency with the GOES 6 study during the active six month interval from July until December 1993 (Glassmeier and Stellmacher, 2000) suggests that one should look for a greater longitudinal extent of in situ toroidal mode power in the more recent Cycle 23 solar maximum data. Unfortunately, there is no comparable near-equatorial plane coverage available for the most recent solar maximum, although the Polar satellite apogee passes through the geo-magnetic equatorial plane in summer 2002, and may provide some complimentary data to that currently available from geosynchronous spacecraft. Also, there is now continuous solar wind data available from the Advanced Composition Explorer satellite located in a halo orbit about the L1 point, 230 RE upstream from Earth, unlike the CRRES
era when only one of the SSCs examined in the present study (26 August 1990) had good solar wind coverage by the Earth-orbiting IMP 8 spacecraft. Future studies will be able to address the question of directly driven oscillations in the magnetosphere, as Kepko et al. (2002) have recently shown in comparing WIND solar wind pressure measure-ments at L1 with GOES 10 geosynchronous magnetometer data. They conclude that discrete spectral peaks below
∼3 mHz at geosynchronous orbit may be directly driven by solar wind pressure variations at the same frequencies, below fundamental FLR eigenfrequencies. Simultaneous measurement of the local plasma density and calculation of the fundamental and harmonic eigenfrequencies has enabled us to distinguish higher frequency ULF wave observations as discrete eigenmodes of the magnetosphere at and inside geosynchronous orbit using the CRRES data set.
Acknowledgements. We thank NSSDC for making IMP-8 (GSFC and LANL) data available on OMNIWeb and Howard Singer and Jeff Hughes for use of the CRRES magnetometer data. Work at Dartmouth was supported by NSF grant ATM-9911975 and NASA grant NAG5-11712 and NAG5-11735.
Topical Editor T. Pulkkinen thanks H. Singer and K. Yumoto for their help in evaluating this paper.
References
Anderson, B. J.: An overview of spacecraft observations of 10 s to 60 s period magnetic pulsations in the Earth’s magnetosphere, in: Solar Wind sources of Ultra-Low-Frequency Waves, edited by Engebretson, M. J., Takahashi, K., and Scholer, M., AGU, Washington, D. C., 1994.
Anderson, B. J., Engebretson, M. J., Rounds, S. P., Zanettii, L. J., and Potemra, T. A.: A statistical study of Pc 3–5 pulsations ob-served by the AMPTE/CCE magnetic fields experiment: 1. Oc-currence distribution, J. Geophys. Res., 95, 10 495, 1990. Anderson, R. R., Gurnett, D. A., and Odem, D. L.: CRRES plasma
wave experiment, J. Spacecraft and Rockets, 29, 570, 1992. Chen, L., and Hasegawa, A.: A theory of long-period magnetic
pul-sation, 1, steady state excitation of field line resonance, J. Geo-phys, Res., 79, 1024, 1974.
Chen, L. and Hasegawa, A.: On magnetospheric hydromagnetic waves excited by energetic ring current particles, J. Geophys. Res., 93, 8763, 1988.
Chen, L. and Hasegawa, A.: Kinetic theory of geomagnetic pulsa-tions, 1, Internal excitations by energetic particles, J. Geophys. Res., 96, 1503, 1991.
Clemmons, J. H., Pfaff, R. F., Lennartsson, O. W., Mozer, F. S., Singer, H. J., Peterson, W. K., Scudder, J. D., Kletzing, C. A., Chi, P. J., Wallis, D. D., and Larson, D. E.: Observations of trav-elling Pc5 waves and their relation to the magnetic cloud event of January 1997, J. Geophys. Res. – Space Phys., 105 (A3), 5441– 5452, 2000.
Cheng, C. Z. and Lin, C. S.: Eigenmode analysis of compressional waves in the magnetosphere, J. Geophys. Res., 14, 884, 1987. Cummings, W. D., O’Sullivan, R. J., Coleman, Jr., P. J.: Standing
Alfv´en Waves in the Magnetosphere, J. Geophys. Res., 74, 778, 1969.
Denton, R. E. and Gallagher, D. L.: Determining the mass den-sity along magnetic field lines from toroidal eigenfrequencies, J. Geophys. Res., 105, 27 717, 2000.
Denton, R. E., Lessard, M. R., Anderson, R., Miftakhova, E. G. , and Hughes, J. W.: Determining the mass density along magnetic field lines from toroidal eigenfrequencies: Polynomial expansion applied to CRRES data, J. Geophys. Res., 106, 29 915, 2001. Dungey, J. W.: Electrodynamics of the outer atmospheres, Tech.
Rep. 69, Ions. Res. Lab. Pa. State Univ., University Park, 1954. Engebretson, M. J., Glassmeier, K.-H., Stellmacher, M., Hughes,
W. J., and Luhr, H.: The dependence of high latitude Pc-5 wave power on solar wind velocity and on the phase of high speed solar wind streams, J. Geophys. Res., 103, 26 271, 1998.
Fenrich, F. R., Samson, J. C., Sofko, G., and Greenwald, R. A.: ULF high and low-m field line resonances observed with SuperDARN, J. Geophys. Res., 100, 21 535, 1995.
Geomagnetic Data 1990, IAGA Bulletin no. 32u, 1996. Geomagnetic Data 1991, IAGA Bulletin no. 32v, 1998.
Gallagher, D. L., Craven, P. D., and Comfort, R. H.: Global core plasma model, J. Geophys. Res., 105, 18 819, 2000.
Goldstein, J., Hudson, M. K., and Lotko, W.: Possible evidence of damped cavity mode oscillations stimulated by the January, 1997 magnetic cloud event, Geophys. Res. Lett., 26, 3589, 1999. Glassmeier, K.-H.: ULF pulsations, in: Handbook of Atmospheric
Electrodynamics, Vol. 2, edited by Volland, H., CRC Press, 463– 502, Boca Raton, 1995.
Glassmeier, K.-H. and Stellmacher, M.: Concerning the local time asymmetry of Pc-5 wave power at the ground and field line reso-nance widths, J. Geophys. Res., 105, 18 847, 2000.
Holzer, T. E.: The solar wind and related astrophysical phenomena, in: Solar System Plasma Physics, V.1, 101–176, edited by Ken-nel, C. F., Lanzerotti, L. J., and Parker, E. N., North Holland Pub. Co., 1979.
Hughes, W. J.: Magnetospheric ULF waves: A tutorial with a his-torical perspective, in: Solar Wind sources of Ultra-Low- Fre-quency Waves, edited by Engebretson, M. J., Takahashi, K., and Scholer, M., AGU, Washington, D. C., 1994.
Jacobs, J. A., Kato, Y. , Matsushita, S., and Troitskaya, V. A.: Clas-sification of geomagnetic micropulsations, J. Geophys. Res., 69, 180, 1964.
Kepko, L., Spence, H. E., and Singer, H. E.: ULF waves in the solar wind as direct drivers of magnetospheric pulsations, J. Geophys. Res., 29, 39-1, 2002.
Knipp, D. J., Emery, B. A., Engebretson, M., Li, X., McAllister, A. H., Mukai, T., Kokubun, S., Reeves, G. D., Evans, D., Obara, T., Pi, X., Rosenberg, T., Weatherwax, A., McHarg, M. G., Chun, F., Mosely, K., Codrescu, M., Lanzerotti, L., Rich, F. J., Shar-ber, J., and Wilkinson, P.: An overview of the early NovemShar-ber, 1993 geomagnetic storm, J. Geophys. Res. – Space Phys., 103 (A11),26 197–26 220 , 1998.
Lee, L. C., Albano, R. K., and Kan, J. R.: Kelvin-Helmholz insta-bility in the magnetopause-boundary layer region, J. Geophys. Res., 86, 54, 1981.
Lessard, M., Hudson, M. K., and Luhr, H.: A statistical study of Pc3-Pc5 magnetic pulsations observed by the AMPTE/Ion Re-lease Module satellite, J. Geophys. Res., 104, 4523, 1999. Miura, A.: Kelvin-Helmholz Instability at the Magnetospheric
Boundary: Dependence on the Magnetosheath Sonic Mach Number, J. Geophys. Res., 97, 10 655, 1992.
O’Brien, T. P., McPherron, R. L., Sornette, D., Reeves, G. D., Friedel, R., and Singer, H. J.: Which magnetic storms produce relativistic electrons at geosynchronous orbit?, J. Geophys. Res., 106, 15 553, 2001.
Radoski, H. R.: A note on oscillating field lines, J. Geophys. Res., 72, 418, 1967.
Samson, J. C. and Rostoker, G.: Latitude-dependent characteristics of high-latitude Pc-4 and Pc-5 micropulsations, J. Geophys. Res., 77, 6133, 1972.
Schulz, M.: Eigenfrequencies of geomagnetic field lines and im-plications for plasma-density modeling, J. Geophys. Res., 101,
17 385, 1996.
Singer, H. J., Sullivan, W. P., Anderson, P., Mozer, F., Harvey, P., Wygant, J., and McNeil, W.: Fluxgate magnetometer instrument on the CRRES satellite, J. Spacecraft and Rockets, 29, 4599, 1992.
Sonnerup, B., Cahill, L. J., and Davis, L. R.: Resonant vibration of the magnetosphere observed from Explorer 26, J. Geophys. Res., 74, 2276–2288, 1969.
Southwood, D. J.: Some features of field line resonances in the magnetosphere, Planet. Space Sci., 22, 483, 1974.
Southwood, D. J.: A general approach to low-frequency instability in the ring current plasma, J. Geophys. Res., 81, 3340, 1976. Southwood, D. J ., Dungey, J. W., and Eherington, R. L.: Bounce
resonant interaction between pulsations and trapped particles, Planet Space Sci., 17, 349-361, 1969.
Stewart, B.: On the great magnetic disturbance which extended from August 2 to September 7, 1859 as recorded by photogra-phy at the Kew Observatory, Phil. Trans. Roy. Soc. Lond., 11, 407, 1861.
Takahashi, K., Higbie, P., and Baker, D. N.: Azimuthal propaga-tion and frequency characteristics of compressional Pc5 waves observed at geostationary orbit, J. Geophys. Res. – Space Phys., 90 (NA2), 1473–1485, 1985.
Takahashi, K., Denton, R. E., Gallagher, D.: Toroidal wave fre-quency at L=6–10: Active Magnetospheric Particles Tracer Explorers/CCE observations and comparison with theoretical model, J. Geophys. Res., 107, DOI10.1029/2001JA000197, 2002.
Vetoulis, G. and Chen, L.: Kinetic theory of geomagnetic pulsa-tions, 3, Global analysis of drift Alfv´en ballooning modes, J. Geophys. Res., 101, 15, 441, 1996.
Walker, A. D. M., Greenwald, R. A., Stuart, W. F., and Green, C. A.: STARE auroral radar observations of Pc-5 geomagnetic pul-sations, J. Geophys. Res., 84, 3373, 1979.
Yumoto, K., Saito, T., and Sakurai, T.: Local time asymmetry in the characteristics of Pc-5 magnetic pulsations, Planet. Space Sci., 31, 459, 1983.
Zhu, X. and Kivelson, M. G.: Compressional ULF waves in the outer magnetosphere: 1. Statistical study, J. Geophys. Res., 96, 19 451, 1991.