First International Conference on Bio-based Building Materials June 22nd - 24th 2015
Clermont-Ferrand, France
445
IN SITU DAMAGE MONITORING IN TIMBER MATERIALS: ACOUSTIC EMISSION
PATTERN RECOGNITION APPROACH BASED ON HILBERT–HUANG
TRANSFORM
S.E. Hamdi1, 2*, M. Diakhaté3, R. Moutou Pitti1, 2, F. Dubois4, A. Chateauneuf1, 2
1
Clermont Université, Université Blaise Pascal, Institut Pascal, BP 10448, Clermont-Ferrand, France
2 CNRS, UMR 6602, Institut Pascal, F-63171, Aubière, France 3
LBMS EA 4325, Université de Bretagne Occidentale, France
4
GEMH, Université de Limoges, 19300, Egletons, France *Corresponding author; e-mail: Seif_Eddine.HAMDI@univ-bpclermont.fr
Abstract
A key part of structural damage monitoring occurring in timber materials aims to identify the most relevant descriptors of critical damage mechanisms. The sudden release of stored energy during the damage process, known as the Acoustic Emission (AE), is a very suitable technique for in situ health monitoring applications. Various signal processing and pattern recognition techniques have been performed for damage feature extraction from AE signals. The purpose of this paper is to use the Hilbert–Huang transform (HHT), for relating a specific damage mechanism to its acoustic signature. The applicability of this local instantaneous frequency descriptor for damage characterization in timber materials is discussed. First, the HHT is used to identify the damage signature, by correlating the measured AE signals with known acoustic sources. Then, the performance of the Hilbert–Huang transform damage classification approach is evaluated. Keywords:
Timber materials; Hilbert–Huang transform; Acoustic Emission; In situ damage monitoring; pattern recognition
1 INTRODUCTION
Damage mechanism propagation from the damage source through timber materials brings up a transient wave, resulting from the sudden release of stored energy during the damage process. This phenomenon, known as the Acoustic Emission (AE) [Beattie 1983], is a suitable technique for in situ health monitoring applications [Alchakra 1997]. A key part of the analysis aims then to identify the most relevant descriptors of critical damage mechanisms occurring in these materials.
Various signal processing and pattern recognition techniques have been adapted for damage feature extraction from AE signals [Yan 2011, Albarbar 2010]. As an example, the Hilbert–Huang Transform (HHT) [Huang 2005, Lin 2009, Apostoloudia 2007] has recently been applied for analyzing such non-stationary signals features analysis. The HHT can provide relevant descriptors for both analysis and features extraction of vibration signal analysis [Zhang 2008]. Loutridis et al. [Loutridis 2005] used the instantaneous frequency, extracted by the HHT for damage detection from vibration signal analysis.
In this work, the HHT is used for the extraction of a damage mechanisms frequency signature from AE signals in wood based materials. The applicability of this empirical time-frequency technique for damage characterization is discussed. Unidirectional timber samples are studied. First, the acquisition of the AE signals is performed thanks to a wide-band acoustic transducer. Then, the HHT is used to identify the instantaneous frequency damage signature, by correlating the measured AE signals with a known acoustic sources.
2 EXPERIMENTAL AND VALIDATION PROCEDURE
2.1 Materials and samples preparation
The study was made from beech samples and linear friction welded or glued. Machining necessary to achieve timber samples adapted to Arcan assembly and testing were done in Laboratoire Brestois de Mécanique et des Systèmes (LBMS). Preliminary tests combined with finite element modeling of the beech samples allowed to retain the geometries of specimens as depicted in Figure 1 [Gineste 2012]. The welded joint is less efficient than wood
ICBBM 2015
446 substrates, then, it is not necessary to make a reduction in the thickness of the study area. Some tests were used to compare the results for test samples with or without thickness reduction, it was not detected significant influence.
Fig. 1: Timber test specimens: different geometries and configurations studied: monobloc timber, laminated timber and timber welded by alternating
linear friction. 2.2 Experimental protocol
The Arcan device has been the subject of several scientific studies [Cognard 2011], and allows 7 loading directions as shown in Figure 2. As the stress state is not homogeneous in the mean plane of the specimen, finite element simulations were performed to obtain the stress distribution in the useful part of the specimen [Gineste 2012]. Thus, knowing the force applied by the testing machine on the specimen, it is possible to determine, in particular, stress at break as a function of the nature of the solicitation.
Fig. 2: Timber sample and modified Arcan test device.
2.3 AE acquisition set-up
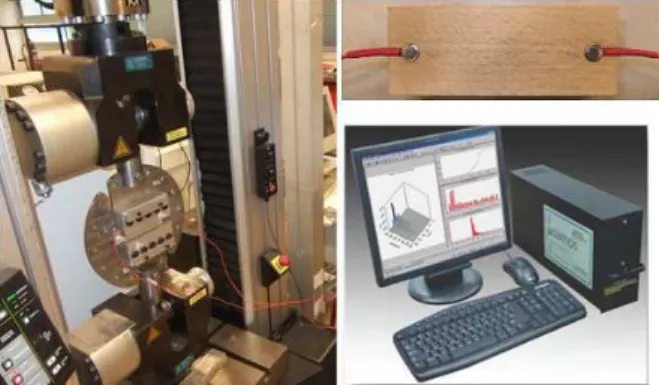
Acoustic emission is defined as a creative phenomenon of transient elastic waves caused by micro-cracks (localizable sources) in the studied material. This phenomenon also can analyze the energy dissipation resulting from this damage evolution (initiation and propagation). The detection and recording system of the acoustic activity consists of the following: (i) an acoustic emission acquisition board (PCI-2: 18-bit, 4-channel, sample rate 40 MS / sec); (ii) two sensors type NANO 30, whose bandwidth is between 125 and 750 kHz, characterized by a resonance peak at 300 kHz. An acoustic coupling is used to ensure a more uniform contact and a better transmission of the wave through the sensor surface; (iii) two preamplifiers with 40dB gain; (iv) acquisition and analysis software for 2-way acoustic emission in real time and playback signals. To overcome the difficulties related to the heterogeneity of the wood material and the specimen geometry, we limit ourselves to an acoustic analysis in linear mode (Figure. 3).
Fig. 3: Damage monitoring by acoustic emission. The tests are controlled in displacement (0.5 mm / min) and carried out at ambient temperature. Failure modes observed in the tests are presented in Figure 4. The photographs (A and B, Fig. 4) illustrate the record-breaking ways and paths commonly observed on the piece and glued specimens. However, on some samples, the failure mode is as shown in D (Fig. 4). The Figure 5C, shows the failure mode observed on the welded specimens. In some cases, the observation of fracture zones identifies significant defects such defective welding. For the majority of broken samples, there are no visible defects without magnification.
Fig. 4: Observed failures modes
3 AE PATTERN RECOGNITION BASED ON HHT
3.1 Principle of the HHT
The HHT [Huang 2005, Huang 1998] is a time– frequency method suited for splitting a multi-component non-stationary signal into a sum of elementary modes, or mono-component signals. The HHT uses two processing techniques, the Empirical Mode Decomposition (EMD) and the Hilbert spectral analysis (HSA). The EMD is based on the empirical estimation of the so-called Intrinsic Mode Functions (IMF), each IMF, noted ck(t) (for k in [1,N]), corresponding to a given mono-component of the actual signal. Due the HHT algorithm, the lowest IMF,c1(t), corresponds to the highest frequency
component of x(t), and increasing IMFs, ck(t),
correspond to decreasing frequency components. Before explaining how to obtain the IMFs from x(t), it is important to notice that each IMF exhibits the same number of extrema and of zero-crossings, and that only one extremum appears between two successive zero-crossings. According to [Huang 2005], each IMF fits the following properties:
ICBBM 2015
447 1. In the whole data set, the number of extrema and the number of zero-crossings must either equal or differ at most by one.
2. At any point, the mean value of the envelope defined by local maxima and the envelope defined by the local minima is zero.
The HHT algorithm runs as follows [Huang 2005]. First, it identifies all the local maxima (resp. minima) points of the signal. The interpolation of these extrema by cubic splines form the upper (resp. lower) envelope of the analyzed signal, as shown in Figure 5a. Next, the mean value of upper and lower envelope, designated as m1(t), is subtracted out from
the original signal to obtain h1(t), as shown in Figure
5b. Then, if h1(t) satisfy the IMF requirements, so the
first IMF component is found c1(t)=h1(t). Otherwise,
this procedure called sifting process, is repeated on the successive data hi(t), where “i“ is the number of
the sifting process iterations. At this point, the highest frequency component of x(t) is obtained. The next step consists in extracting this first IMF component, c1(t), from the original signal x(t).
Fig. 5: Sifting process: the original data x(t) with the upper, lower envelope (dotted lines) and resultant mean line m1(t) (bold line) (a), and the data after the
first sifting.
3.2 AE damage signature identification by HHT Damage descriptors extraction approach based on HHT is first performed on typical AE signals. As an example, figures 6a and 6c shows AE signals obtained from pattern from stress loading. First, the AE signal is acquired with a time length of 0.5 ms. The next step is to process the EMD for estimating the IMF of the AE signal. The first intrinsic mode function, IMF1, is then being used for the estimation of the descriptor proposed in this work. Once IMF1 estimated, the local mean frequency F1 is calculated.
The signal shown in figure 6b is characterized by much shorter rise time, shorter duration and higher energy than the second signal shown in figure 6a. The HHT based analysis is first validated for these two signals in this work.
The analysis of the time–frequency by the smoothed Hilbert spectrum (SHS), as depicted in figures 6b and 6d, shows high energy areas (high instantaneous amplitude levels) which corresponds to the frequency signature of both AE signals. The first AE signal (Fig. 6a), exhibits locally distributed energy at the beginning of the signal and located at higher frequencies (around 300 kHz), then the second AE signal (Fig. 6c), with a frequency peak around 200 kHz, when energy stretches on the entire signal. This shows a way for discriminating both damage signatures, based on their energy location. A frequency descriptor is then proposed for tracking the peak frequency from the Hilbert spectrum representation. At this stage, it is important to note that the first IMF (noted IMF1) represents the higher part of the signal, leading to the higher peak in the
HHT representation. This makes it an efficient descriptor for classifying AE signals. More precisely, we define in the following the mean frequency of IMF1, according to:
Where T is the considered time length. Then, F1 can
be considered as a key descriptor for AE signal classification.
Fig. 6: AE signals extracted from timber samples under stress loading and their smoothed Hilbert
spectrum.
4 CONCLUSIONS
The analysis of the HHT-based classification leads to establish some conclusions. The first conclusion concerns that the HHT based descriptor, estimation from the mean frequency of the first IMF of AE signals, may be an accurate estimator for the AE classification. It can also be noticed that the mean frequency variation of the same class vectors is negligible compared to the boundaries variations of the damage frequency signatures in timbers materials. This can be explained due to the fact that these signals have as origin an energy release and their propagation within the structure alters their amplitude, but does not impairs their oscillation frequency. This shows the robustness of the HHT for non-stationary features extraction.
The HHT provide encouraging results for non-stationary AE signals features extraction. Moreover, instantaneous frequencies may provide relevant descriptors for in situ health monitoring applications. This paper opens new perspectives. Work on the instantaneous frequencies signals content can provide new relevant damage descriptors. In fact, once the acoustic signatures of the different damage mechanisms are recognized, a signals library is than available to help performing a supervised AE data sets clustering. Therefore, real time damage detection and its severity estimation may be possible. In this case, it is also conceivable to identify the diffuse damage by an embedded system, and to solve the problems of coupling pad structure. However, real-time implementation of the proposed method still needs a little works in the future.
ICBBM 2015
448 5 ACKNOWLEDGMENTS
The authors wish to strongly acknowledge the National Agency of Research (ANR) for its financial support of this work through the project CLIMBOIS N° ANR-13-JS09-0003-01 and ViaMéca the labeling. 6 REFERENCES
[Beattie 1983] Beattie AG. Acoustic emission, principles and instrumentation. J Acoust Emission 1983; 2:95–128.
[Alchakra 1997] Alchakra W, Allaf K, Ville JM. Acoustical emission technique applied to the characterisation of brittle materials. Appl Acoust 1997; 52:53–69.
[Yan 2011] Yan S, Liang Q, Guo Q, Zhou Z, Yu G. Analysis on acoustic characteristics of opposed multi-burner gasifier. Appl Acoust 2011; 72:43–7. [Albarbar 2010] Albarbar A, Gu F, Ball AD, Starr A. Acoustic monitoring of engine fuel injection based on adaptive filtering techniques. Appl Acoust 2010; 71:1132–41.
[Huang 2005] Huang NE. Introduction to the Hilbert– Huang transform and its related mathematical problems. Hilbert–Huang transform and its applications; 2005.
[Lin 2009] Lin CC, Liu PL, Yeh PL. Application of empirical mode decomposition in the impact-echo test. NDT&E Int 2009; 42:589–98.
[Apostoloudia 2007] Apostoloudia A, Douka E, Hadjileontiadis LJ, Rekanos IT, Trochidis A. Time-frequency analysis of transient dispersive waves: a comparative study. Appl Acoust 2007; 3:296–309. [Zhang 2008] Zhang H, He Q, Yan Y. A new nondestructive technique for measuring pressure in vessels by surface waves. Appl Acoust 2008; 69:891–900.
[Loutridis 2005] Loutridis S, Douka E, Hadjileontiadis LJ. Forced vibration behaviour and crack detection of cracked beams using instantaneous frequency. NDT&E Int 2005; 38:411–9.
[Gineste 2012] Gineste A,Cognard J, Pizzi, Analysis of the mechanical behavior of wood and welded wood under tensile-shear loads under a modified Arcan device. Journal of Adhesion Science and Technology, 2012; 26, 1717-1731.
[Cognard 2011] Cognard J, Sohier L, Davies P. A modified Arcan test to analyse the behaviour of composites and their assemblies under out-of-plane loadings, Composites Part A, 2011; 42,111–121. [Huang 1998] Huang NE, Shen Z, Long SR, Wu MC, Shih H, Zheng Q, et al. The empirical mode decomposition and the Hilbert spectrum for nonlinear and non-stationary time series analysis. Proc Roy Soc Math Phys Eng Sci 1998:903–95.