First International Conference on Bio-based Building Materials
June 22nd - 24th 2015
Clermont-Ferrand, France
DEVELOPMENT OF A LABORATORY TEST METHOD TO ASSESS THE
RESISTANCE OF BIO-BASED INSULATION MATERIALS AGAINST MOULDS
I. Le Bayon1*, M. Draghi2, M. Gabille1, M. Prégnac1, J. Lamoulie1, M.Jequel1, M. Roger3, M. Kutnik1
1 Institut Technologique FCBA, BP 227, 33028 Bordeaux cedex, France 2
CSTB, Direction Santé Confort/ Division agents biologiques et aérocontaminants, 84 avenue Jean-Jaurès, Champs-sur-Marne, 77447 Marne-La-Vallée cedex 2, France
3
CSTB, Direction Isolation et Revêtements, 84 avenue Jean-Jaurès, Champs-sur-Marne, 77447 Marne-La-Vallée cedex 2, France
*Corresponding author; e-mail: isabelle.lebayon@fcba.fr
Abstract
Bio-based insulation materials have been increasing in the construction market in Europe. However, there is a lack of reliable standardised test method to determine their resistance against moulds. Moreover, existing test methods do not take into account real hygrothermal conditions in use. This research project aimed to develop a laboratory test method to assess the resistance of bio-based insulation materials against moulds. The test method was applied to different bio-based insulation materials: wood fibre, loose fill cellulose, straw and hemp-flax. The materials were artificially contaminated with moulds. Based on a hygrothermal study on use classes, two different climatic conditions were tested: 26°C 95 % of relative humidity and 26°C 85 % of relative humidity. After four weeks of mould exposure, both a visual examination and a counting of cultivable fungal units were performed. It was clearly demonstrated that the quantitative analysis of mould growth was necessary to assess the resistance of bio-based insulation materials against moulds. Results from two different laboratories gave evidence that this test method was reliable whatever the tested bio-based material. It was shown that among 8 tested materials, 2 were resistant to moulds at 95% of relative humidity. In addition, 2 untreated bio-based insulation materials which were not resistant to moulds at 95 % of relative humidity were resistant to moulds at 85% of relative humidity, thus enhancing the suitability of bio-based materials for insulation. A proposal of a mould test taking into account realistic hygrothermal conditions was discussed.
Keywords:
Bio-based; Insulation; Test method; Mould; Hygrothermal; Use class; EN15101-1, Fibre wood, Cellulose, Hemp, Flax, Straw
1 INTRODUCTION
Bio-based insulation materials are made of various natural compounds such as cellulose, wood fibres, hemp, flax, straw, wool, feathers. Despite their environmental asset and their performance characteristics, these materials have to prove their resistance to moulds.
In North Europe and North America, 20% to 40% of buildings are contaminated by mould fungi [Conseil Supérieur d’Hygiène Publique de France 2006]. In indoor environment, most construction and decoration materials can be contaminated by mould fungi, providing that the water activity is greater than 0.65/0.7 which means a minimum of 65% to 70% air relative humidity [Flanningan et al. 1996, Botton et al. 1990].
Moulds are aerobic fungi belonging to Eurotiomycete class. They need water, organic and mineral compounds to grow [Botton 1990]. They can easily grow on insulation materials when climatic conditions are favourable.
Different laboratory test methods aim to assess resistance against moulds. The scope of the NF EN ISO 846 test method is plastics. There is a nutritive additive which stimulates mould growth and the final assessment is mainly visual. According to the Construction Product Regulation, the European assessment test method, former Common Understanding of Assessment Procedure [CUAP 2003], deals with insulation materials. However, there is no artificial contamination and the relative humidity is not controlled. As a consequence, the level of mould growth depends on the test environment mainly. The mould growth assessment is based on visual
observation. The ASTM C1338 test method deals with mineral insulation materials and facings. The result is based on visual assessment of mould growth in comparison with birch or pine. The EN15101-1 Annex F test method focuses on loose fill cellulose. Mould growth is assessed by visual examination and compared to wood. Our background in testing insulation materials according to these methods gave evidence about the difficulty to rely on visual assessment only. First of all, the matrix of bio-based materials is a mixing of materials. Then the colours are various, the whole developed surface area is huge thus leading to results that are not reliable enough. Thus, there is a need to develop a quantitative assessment method in order to complete visual assessment. In addition, there is a real lack of a recognized test method in Europe to assess all bio-based materials against moulds.
Most of these test methods are carried out at 95% of relative humidity and do not take into account real hygrothermal conditions that insulation materials have to face during their life in service.
A French study [Lamoulie et al. 2015] dealt with usual hygrothermal conditions, usual roof and wall configurations in France. It led to two use classes to be considered for insulation materials:
- “a dry use class” which corresponds to situations where the material is constantly submitted to relative humidity conditions less than 85% (except for a maximum duration of 48 hours),
- “a wet use class” with a usual relative humidity that can be greater than 85% (for more than 48 hours). Taking into consideration the “worst case scenario” of each use class, the test conditions selected for our the mould test were 85% RH 26°C and 95% RH 26°C. In a first step a fungal cultivability based method allowing the quantification of mould growth was applied to loose fill cellulose specimens submitted to EN15101-1 Annex F.
In a second step, an innovative test method was developed to assess the mould resistance of all bio-based materials. The performance and the reliability of the method were discussed.
In a third step, the mould test was implemented by two laboratories. Eight different bio-based materials were tested according to this mould test method with an exposure to 26°C and 95% of relative humidity. Afterwards, five bio-based materials were tested with an exposure to 26°C and 85% of relative humidity. 2 MATERIAL AND METHODS
2.1 EN15101-1-Annex F
Material and methods were those described in the standard. Deviations from the standard were: sterilisation of test specimens according to gamma radiation (25kGy) and quantification of mould growth. The number of cultivable fungal units was counted at the beginning (T0) and at the end of the test after 4 weeks (T4). Three loose fill cellulose materials were tested: Cell1, Cell2, Cell3. The number of Colony Forming Unit (CFU)/Petri dish was used to calculate the number of CFU/test specimen thus allowing the calculation of the number of CFU/cm² of insulation material. Values were transformed in log10 CFU/cm² as
the logarithm (10) is the usual microbiological unit.
2.2 Method to assess the resistance of bio-based insulation materials to moulds
Test insulation materials
8 different insulation materials with or without fungicidal treatment [encoded : 1.1, 1.2 (untreated), 2.2 (untreated), 2.3, 3.2 (untreated), 5, 6.2 (untreated) and 7.1(untreated)] were tested: 2 wood fibre panels, 4 loose fill cellulose materials from two different manufacturers, 1 hemp-flax material and 1 straw material. Test specimens of 6.1cm x 6.1cm x 0.8 cm (for panels) and of 7 cm diameter x 0.8 cm (for loose fill material) were prepared and preconditioned at 26±2°C and 95%±5% Relative Humidity (RH) for one week. For each test condition, 3 replicates were used to assess the initial load of cultivable fungal units (T0), 9 replicates were submitted to the test and analysed by both a visual and quantitative assessment (final load of cultivable fungal units after 4 weeks, (T4), 3 replicates were used to assess the moisture content (%) of the test specimens at the end of the test. Test specimens were sterilized in plastic bags by gamma radiation at 25kGy.
Fungal strains
Aspergillus niger (MNHN-48-521; FCBA strain), Aspergillus niger (ATCC3275; CSTB strain),
Penicillium brevicompactum (IHEM 4891) and Cladosporium sphaerospermum (IHEM 3169) were
grown separately on malt (4%m/m) agar (2% m/m) medium at 22°C±2°C and 70%±5% of relative humidity (RH) for 3 to 4 weeks. Conidia of each of the 3 strains were prepared as follow. A fungal solution (conidia, demineralized water with 0.9% of NaCl and 0.05% of Tween 80) was shaken, filtered and was centrifuged 3 times at 2000 g for 20 minutes in sterile conditions. After counting on a Malassez cell under a microscope (Leica, DM750), the 3 fungal solutions were diluted then mixed with the same concentration of conidia in order to finally spray the insulation material with 1.6x10⁵ conidia per cm² of insulation material. An alternative method of contamination consisted in the contamination with controlled fungal aerosol generated successively from three fungal cultures.
Controls
The cultivability of the fungal conidia was checked by inoculating 0.1 mL of the fungal inoculation solution in 2 Petri dishes malt (4%) agar (2%) per dilution (8 dilutions). Petri dishes were stored at 22°C±2°C and 70%±5% RH. After 3 to 5 days counting of Colony Forming Unit (CFU) was carried out.
Additional controls were prepared to check mould development on a filter paper (Whatman n°1 70mm diameter) put on 2 Petri dishes with 4% malt 2% agar.
Inoculation of the test insulation material and controls with moulds and incubation
Each test specimen of the 8 test materials and controls (filter paper on malt agar Petri dish) were artificially contaminated by a spray of 1.6x10⁵ conidia per cm² under sterile conditions. They were put in sterile Petri dishes and maintained for 4 weeks at 26°C ±2°C and 95%±5% RH (Memmert, CTC 256). Additional tests were carried out in the same way with the test materials 2.2, 3.2, 5, 6.2 and 7.1, except that the incubation conditions were 26°C C±2°C and 85%±5% RH (Memmert, CTC 256).
Visual assessment of mould growth at the end of the test
Visual rating was carried out in sterile conditions on the 9 test specimens of each material, for each test condition, according to:
- rating 0: no mould growth on the test specimen surface (nor visible to the naked eye, neither visible to magnification x50)
- rating 1: visible mould growth on the test specimen surface (either visible to the naked eye, or visible to magnification x50)
Quantitative assessment of cultivable fungal units
Prior to the incubation and after the inoculation of test specimens, 3 test specimens were analysed to assess the initial cultivable fungal units that were sprayed on the test specimens. Each test specimen was homogenised for 1 min with sterile demineralised water (NaCl 0.9% and Tween 80 0.05%). A series of dilution of this solution was inoculated on malt (4%) agar (2%) Petri dishes thus allowing the counting of cultivable fungal units (Colony Forming Unit/ Petri dish) after 3 to 5 days at 22 ±2°C and 70%±5% RH. At the end of the test, each test specimen (9 specimens) was analysed in the same way to assess the number of cultivable fungal units once exposed to each climatic condition. The number of CFU/Petri dish was used to calculate the number of CFU/test specimen thus allowing the calculation of the number of CFU/cm² of insulation material. Values were transformed in log10 CFU/cm².
Moisture content measurement of test specimens
At the end of the test 3 test specimens were weighed: m1 (g) (balance with 0.001 g precision). The test specimens were dried at 70°C (Binder, ED 115) for 2 days and were weighed: m2 (g) (balance with 0.001 g precision). The mean moisture content (MC) was calculated: 2 2 1
100
(%)
m
m
m
MC
=
×
−
(1) Expression of resultsFor each test material and test condition:
- Initial load of cultivable fungal units (at T0). The mean value (n=3) is in log10 CFU/cm² of insulation material ±
estimation uncertainty which is based on the confidence interval of 95%.
- Final number of cultivable fungal units after 4 weeks (at T4). The mean value (n=9) is in log10 CFU/cm² of
insulation material ± estimation uncertainty which is based on the confidence interval of 95%.
- Final maximum visual rating. The maximum rating (n=9) is 0 or 1.
- Final moisture content of test specimen. The mean value (n=3) is in percentage
Results of initial load of cultivable fungal units (T0: beginning of the test) were compared with the number of cultivable fungal units at the end of the test after 4 weeks (T4), according to a Student test (α risk: 5%). 2.3 Statistical analysis
Minitab16 software was used for all statistical analysis. The power of test and the calculation of the replicates number were done. Normality tests, equality variance test and Student tests were carried out on results of quantitative analysis (cultivable fungal units) obtained prior the test (T0) and at the end of the test (T4).
2.4 Laboratories
Laboratory 1 is CSTB and Laboratory 2 is FCBA. 3 RESULTS
3.1 EN15101-1 –Annex F test and quantification of mould growth in loose fill cellulose
Three loose fill cellulose materials were submitted to EN15101-1 Annex F test to assess their resistance against moulds. At the end of the test, specimens were visually assessed according to annex F. An additional assessment based on cultivable fungal units counting was developed. A mould growth was considered in the test loose fill cellulose if there were more cultivable fungal units at the end of the test than at the beginning of the test. Results are compared in Tab. 1.
Tab.1 Assessment of the mould growth on 3 loose fill cellulose materials (mean values, n=6 for visual rating, n=3 for number of fungal units) according to
EN15101-1 Annex F and according to quantitative assessment- after exposure at 28°C ±2°C and 95%±5% RH
Loose fill cellulose
material Annex F result EN15101-1
Number of cultivable fungal units (log10 CFU/cm²) visual rating Class BA Initial load (T0) Final fungal units (T4) Cell1 2.3 2 4.5 5.4 Cell2 0.3 0 4.4 5.9 Cell3 0 0 4.1 2.0
CFU: Colony Forming Unit
Cell1 led to a BA class 2 (mould visible to the naked eye, and less than the comparison material) on the basis of visual assessment. The quantitative analysis confirmed the mould development as there was 5.4 log10 CFU/cm² that is to say there was 0.9 log10
CFU/cm² more than at the beginning of the test. Cell2 led to a BA class 0 (nor visible mould visible to the naked eye, nor visible under the microscope). However mould developed as there was about 1.5 log10 CFU/cm² more cultivable moulds at the end of the
test than at the beginning of the test.
Cell3 led to a BA class 0. The quantitative analysis confirmed these results as there was a loss of 2.1 log10
CFU/cm² at the end of the test thus indicating that a part of the inoculated moulds did not survive.
3.2 Development of a mould test method
This test method was developed on the basis of an artificial mould contamination and an exposure to realistic climatic conditions. Preliminary results were obtained on wood fibre [Lamoulie et al. 2015]. Then the test method was fully developed. The innovative steps were the quantitative assessment, the realistic climatic conditions, the statistical analysis and the applicability to different bio-based insulation materials. Fungal strains were selected. The number of test specimens was determined according to statistical analysis. The performance of the test method to extract and to quantify moulds from insulation material was assessed. The detection limit of the test method was calculated.
Selection of fungal strains
Aspergillus niger, Penicillium brevicompactum, Cladosporium sphaerospermum were selected as they
were among the most frequently identified mould species in houses in many studies [Gutarowska and Piotrowska 2005, Haleem Khan and Mohan Karuppayil 2012].
Statistical analysis
A comparison of mean values of cultivable fungal units at T0 and at T4 was carried out according to a Student t test. The selected statistical parameters were: type I error (α risk: 5%), type II error expected (β risk: 20%), targeted power of the test (1-20% =80%), standard deviation: 0.5 log10 CFU/cm² (based on preliminary
tests (data not shown), minimal difference (“D” value) targeted: 0.75 log10 CFU/cm² (1.5 x standard
deviation). Taking into account these selected parameters and considering that T0 results from our preliminary study (data not shown) had a lower standard deviation (0.2 log10 CFU/cm²) than T4 results,
the number of test specimens was 3 for T0 series and was 9 for T4 series.
Performance of the method to extract moulds from insulation materials
The number of cultivable fungal units of the inoculation suspension was compared to the load of cultivable fungal units extracted from each test material at the beginning of the test (T0).
Tab.2: Cultivable fungal units in the inoculation suspension and in 6 different insulation materials after
the fungal inoculation at T0 (mean values, n=3), Laboratory 2
Cultivable fungal units (log10CFU/cm²)
Inoculum
suspension Extraction from different insulation materials at T0 1.1 1.2 2.2 3.2 5 6.2 7.1 4.9 5.0 4.7 4.7 5.0 4.8 4.0 4.9 The number of fungal units extracted from the different insulation materials was between 4.7 and 5.0 log10CFU/cm² (except for the test material 6.2)
whereas 4.9 log10CFU/cm² were inoculated (Tab.2).
These values are rather close except for the 6.2 test material. From the 6.2 test material 4.0 log10 CFU/cm²
were extracted. This was probably due to a high variability of individual results as the confidence interval was abnormally high (Tab.3). A higher number of replicates could be more appropriate for this analysis.
Detection limit of the test method
The cultivable fungal units extracted from insulation specimens reached at least 4.0 log10 CFU/cm² (Tab. 2)
at T0. Considering the number of CFU that could be counted on Petri dishes after the extraction from the insulation specimens, the test method allows to assess a minimum of 1.1 to 1.4 log10 CFU/cm². This detection
limit is about one thousand times (3 logs10) less than
the initial load of moulds at T0. Based on these results the improved test method was applied to different bio-based insulation materials.
3.3 Assessment of the resistance of bio-based insulation materials to moulds according to the innovative test method
First of all, the test method was applied to 8 different insulation materials exposed to 26°C 95 % RH for four weeks. Fibre wood (treated and untreated), loose fill cellulose (treated and untreated), straw and hemp-flax were tested by two laboratories to assess the reliability of the test results. Both visual rating and quantitative analysis of mould growth were assessed (Tab.3). Test material 1.1
There was no mould growth recorded based on visual observation (Tab.3). The quantitative analysis showed that the initial load of fungal conidia was between 4.4 and 5.0 log10 CFU/cm² depending on the laboratory.
After 4 weeks at 26°C and 95% RH, there were less cultivable fungal units than at the beginning. Mould growth was lower than the detection limit. Despite a moisture content of 20.6 % to 37.3% which usually allows mould growth, the test material 1.1 is resistant to mould development in such conditions. The results were similar between the two laboratories (Tab.3). Test material 1.2
The visual assessment led to different results in the two laboratories. Laboratory 1 rated no visual mould growth whereas Laboratory 2 rated visible mould on one test specimen only (among 9). The quantitative assessment indicated more cultivable fungal unit at the end of the test than at the beginning. Results between T0 and T4 were significantly different according to the Student test (α risk: 5%). The test material 1.2 is not resistant to mould growth in such conditions (Tab.3). Test material 2.2
Visual ratings done by both laboratories were the same, thus indicating evidence of mould growth. No quantitative analysis was necessary. The test material 2.2 is not resistant to mould growth in such conditions (Tab.3).
Test material 2.3
Results from the two laboratories led to no visible mould growth and less cultivable fungal units than at the beginning of the test. The test material 2.3 is resistant to mould growth despite high values of moisture content. The 81.2 value was abnormally high due to technical problem during the test (Tab.3). Test material 3.2
Visual ratings done by both laboratories were the same, thus indicating evidence of mould growth. No quantitative analysis was necessary. The test material 3.2 is not resistant to mould growth in such conditions (Tab.3).
Test material 5
Visual ratings done by both laboratories were the same, thus indicating evidence of mould growth. No quantitative analysis was necessary. The test material 5 is not resistant to mould growth in such conditions despite high moisture content (Tab.3).
Test material 6.2
Visual ratings done by both laboratories were the same, thus indicating evidence of mould growth. No quantitative analysis was necessary. The test material 6.2 is not resistant to mould growth in such conditions despite high moisture content (Tab.3)The test material 7.1 was submitted to the same test. However, visible mould started to grow during the preconditioning step.
The test was stopped as this material proved to be not
resistant to mould at 26°C and 95% RH. Afterwards, four insulation materials that were not resistant to moulds exposed to 95% RH were submitted to moulds at 85% RH (Tab.4).
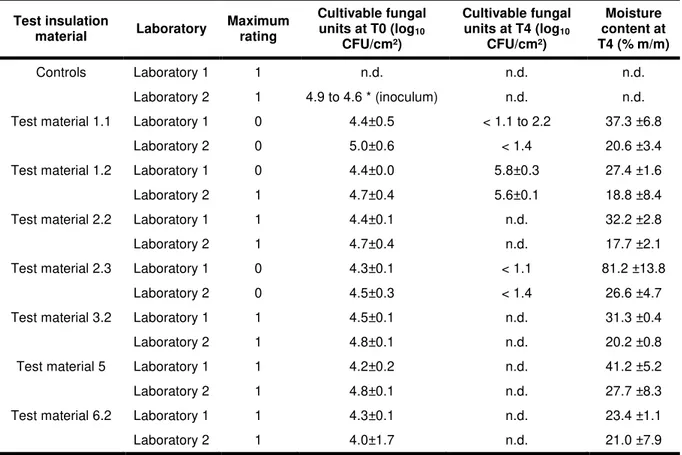
Tab.3: Mould growth assessment in 8 test materials before (T0) and after exposure to 26°C 95 % RH (T4). Mean values (log10 CFU/cm²) ± uncertainty (confidence interval of 95%) with α risk: 5%, and mean moisture content
(%m/m) ± uncertainty (% m/m) (confidence interval of 95%). Results at 26°C and 95% RH
Test insulation material Laboratory Maximum rating Cultivable fungal units at T0 (log10 CFU/cm²) Cultivable fungal units at T4 (log10 CFU/cm²) Moisture content at T4 (% m/m) Controls Laboratory 1 1 n.d. n.d. n.d. Laboratory 2 1 4.9 to 4.6 * (inoculum) n.d. n.d.
Test material 1.1 Laboratory 1 0 4.4±0.5 < 1.1 to 2.2 37.3 ±6.8
Laboratory 2 0 5.0±0.6 < 1.4 20.6 ±3.4
Test material 1.2 Laboratory 1 0 4.4±0.0 5.8±0.3 27.4 ±1.6
Laboratory 2 1 4.7±0.4 5.6±0.1 18.8 ±8.4
Test material 2.2 Laboratory 1 1 4.4±0.1 n.d. 32.2 ±2.8
Laboratory 2 1 4.7±0.4 n.d. 17.7 ±2.1
Test material 2.3 Laboratory 1 0 4.3±0.1 < 1.1 81.2 ±13.8
Laboratory 2 0 4.5±0.3 < 1.4 26.6 ±4.7
Test material 3.2 Laboratory 1 1 4.5±0.1 n.d. 31.3 ±0.4
Laboratory 2 1 4.8±0.1 n.d. 20.2 ±0.8
Test material 5 Laboratory 1 1 4.2±0.2 n.d. 41.2 ±5.2
Laboratory 2 1 4.8±0.1 n.d. 27.7 ±8.3
Test material 6.2 Laboratory 1 1 4.3±0.1 n.d. 23.4 ±1.1
Laboratory 2 1 4.0±1.7 n.d. 21.0 ±7.9
n.d.: no data; * control for test series with 2.2, 2.3, 3.2 test material (the first value is the control for 1.1, 1.2, 5, 6.2 test materials)
Tab. 4: Mould growth assessment in 4 test materials before (T0) and after exposure to 26°C 85 % RH (T4). Mean values (log10 CFU/cm²) ± uncertainty (confidence interval of 95%) with α risk: 5% and mean moisture content
(%m/m) ± uncertainty (% m/m) (confidence interval of 95%). Results at 26°C and 85% RH
Test insulation material Laboratory Maximum rating Cultivable fungal units at T0 (log10 CFU/cm²) Cultivable fungal units at T4 (log10 CFU/cm²) Moisture content at T4 (% m/m) Controls Laboratory 1 1 n.d. n.d. n.d. Laboratory 2 1 4.9 (inoculum) n.d. n.d.
Test material 2.2 Laboratory 1 0 4.5±0.2 3.9±0.1 10.3 ±0.3
Laboratory 2 0 4.7±0.1 4.2±0.1 13.3 ±0.6
Test material 3.2 Laboratory 1 0 4.3±0.1 3.7±0.1 12.6 ±0.1
Laboratory 2 0 5.0±0.1 4.2±0.1 15.6 ±0.8
Test material 5 Laboratory 2 0 4.9±0.3 <1.4 to 2.1 17.6 ±4.3
Test material 7.1 Laboratory 1 1 4.3±0.1 5.6±0.1 17.2 ±0.2
Laboratory 2 1 4.9±0.1 6.1±0.1 11.3 ±3.4
n.d. no data
Test material 2.2
There was no visible mould. This result was confirmed by the two laboratories with the quantitative assessment. A Student test proved that results between T0 and T4 were significantly different (α risk of 5%), thus showing that there was less cultivable
fungal units at T4 than at the beginning of the test. The test material 2.2 is resistant to moulds when exposed to 85% RH and 26°C. The moisture content was low and could limit the fungal growth (Tab.4).
Test material 3.2
There was no visible mould. This result was confirmed by the two laboratories with the quantitative assessment. A Student test proved that results between T0 and T4 were significantly different (α risk of 5%), thus showing that there was less cultivable fungal units at T4 than at the beginning of the test. The test material 3.2 is resistant to moulds when exposed to 85% RH and 26°C. The moisture content was low and could limit the fungal growth (Tab.4)
Test material 5
No visible mould growth was confirmed by the quantitative analysis. There was less (about 3 log10
less) cultivable fungal units at the end of the test than at the beginning. This test material is resistant to moulds when exposed to 85% RH and 26°C (Tab.4). Test material 7.1
Both laboratories recorded visible mould growth. In order to check that the quantitative assessment was in accordance with visual assessment when mould grows, the number of cultivable fungal units was assessed. There was a gain of 1.3 to1.1 log10 CFU/cm²
at the end of the test. The Student test proved that there is significantly more mould at the end of the test than at the beginning. The test material 7.1 is not resistant to moulds when exposed to 85% RH and 26°C (Tab.4).
An additional test was carried out on test material 6.2 exposed to 85% RH and 26°C. The mould was clearly visible. The visual rating was 1. This test material is not resistant to mould when exposed to 85% RH.
Synthesis of pass/fail results according to the test conditions
The results of Resistance / not Resistance of all tested bio-based materials are summarized in Tab. 5.
Tab.5: Summary of Resistant (R) and Not Resistant (NR) test materials according to the test conditions
Test material n° Test conditions 26°C 95% RH 26°C 85% RH 1.1 R n.d. 1.2 (untreated) NR n.d. 2.3 R n.d. 2.2 (untreated) NR R 3.2 (untreated) NR R 5 NR R 6.2 (untreated) NR NR 7.1(untreated) NR NR n.d. no data
When exposed to 95%HR and 26°C, 2 bio-based insulation materials were resistant to mould growth whereas 6 bio-based materials were not (Tab.5). Among 5 test materials (2.2, 3.2, 5, 6.2, and 7.1) that were not resistant to moulds when exposed to 95% RH, 3 test materials (2.2, 3.2, 5) were resistant to mould growth at 85% RH. 2 test materials (6.2 and 7.1) were not resistant to mould development at 85% RH (Tab.5).
4 DISCUSSION
4.1 EN15101-1 Annex F and quantification of mould growth
This research work showed the risk to rely on visual assessment only. In Tab.1 the BA class 0 was reached for Cell2 material despite the development of moulds easily detected by the quantitative assessment. The developed quantitative method could allow more reliable results. It could be used to amend the Annex F of EN15101-1.
Other steps of the annex could be improved such as the sterilisation of test specimens prior to the test to avoid initial contamination in the test specimens. A round robin test between European laboratories could be proposed to assess the repeatability and reproducibility of the method.
4.2 Innovative mould test
Considering the results (Tab.3 and Tab.4), it was shown that both visual and quantitative assessments were needed to assess the resistance of bio-based insulation materials to moulds. The test material 1.2 was visually rated 0 by one laboratory whereas it was rated 1 by another laboratory (Tab.3). However the quantitative assessment based on mould extraction and Colony Forming Units counting proved the development of moulds on the test material. This quantification of mould growth did not enhance the severity of the test. Indeed, insulation materials without any mould growth were rated 0 and showed similar or less cultivable fungal units at the end of the test (Materials 2.2, 3.2 and 5 in Tab.4). The quantitative analysis based on Colony Forming Units was a simple and easy to handle method.
Other quantitative methods exist such as ergosterol assessment [NFV18-112 1991]. Ergosterol is a cytoplasm cell wall compound of fungi. It is commonly used as a label of food contamination by moulds. However the ratio of ergosterol content over mycelium dry weight can vary according to the fungal species. A ratio was found to be 0.07µg/mg for E. chevalieri
whereas it was 11µg/mg for F. oxysporum [Hocking et
al. 2006]. Ergosterol takes into account the whole fungal biomass, even dead mycelium or non cultivable conidia. When applied to bio-based materials, we have observed that according to the test insulation material and the climatic conditions, the number of cultivable conidia could decrease during the test (Tab.3, test materials 1.1 and 2.3). As a consequence a method which quantifies this phenomenon is needed. On another hand, for test materials which are not resistant to moulds (showing more CFU at the end of the test than at the beginning of the test), ergosterol measurements could be an additional technique to assess how much biomass has developed.
Other methods based on molecular biology tools techniques such as Quantitative Polymerase Chain Reaction could also be relevant.
The yield of the mould extraction from the whole insulation matrix proved to be similar between different bio-based materials. There was a maximum loss of 0.3 log10 CFU/cm² between the inoculated moulds and the
extracted moulds at T0 (Tab.2). The common uncertainty of measurement is 0.5 log10 in
microbiological tests [Service d’accréditation Suisse 2006]. Thus, the difference of 0.3 log10 gives evidence
This work carried out by two laboratories led to similar conclusions about the resistance / no resistance of 8 bio-based insulation materials, thus proving the reliability of this test method.
Such a method can serve as a basis for a draft to develop a standardised test method for all bio-based insulation materials.
Future work could be done with mineral insulation products. The ASTMC1338 standard deals with mineral insulation and coating. It is based on visual assessment of mould growth only. It could be of interest to assess mineral insulation products according to this test method in order to enlarge the scope of this test method. Preliminary work (data not shown) led to promising results about the applicability of the test method to mineral insulation materials. 4.3 Resistance of bio-based materials to moulds
taking into account the real climatic conditions
Relative humidity of the mould test
Mould growth was impacted by relative humidity as shown in Tab.3 and Tab.4. Whereas 2.2 and 3.2 insulation products were not resistant to mould at 95% RH (with moisture contents between 17.7% and 32.2%), they were resistant to mould at 85% RH (with a moisture content of 10.3% to 15.6%). These results could be explained by too low moisture contents at 85% RH to allow mould growth. For instance in solid wood, moulds usually grow when the wood moisture content is above 18% [CTBA, 1996]. In addition, each fungal species has its own requirements for water activity and temperature. As an example the minimum water activity requirement is 0.77 (77% RH) for
Aspergillus niger and 0.81 for Penicillium brevicompactum [Yang and Johanning 1997; Clarke et
al. 1999].
Temperature of the mould test
The optimum temperature of mould growth is between 22°C and 35°C [Botton et al. 1990]. The mould test temperature was 26°C which was optimum and in accordance with the findings of Lamoulie et al. [2015] about hygrothermal conditions in buildings.
Insulation material composition
Some treated insulation products like 1.1 and 2.3 (Tab.3) were resistant to mould growth when exposed at 95% RH. All test specimens were rated 0. The quantification of cultivable fungal units at the end of the test was lower than the detection limit, despite high moisture contents which usually enhance mould development. There was a loss of 2.2 to 3.3 log10
CFU/cm² at the end of the test in comparison with the beginning of the test. A hypothesis could be that the composition of these test insulation materials, such as the additive and fungicidal actives could inhibit the growth and the cultivability of moulds. In a previous research work [Viitanen 1991], it was demonstrated that the fungicides of cellulose materials inhibited both the mould growth in the insulation material and the mould and decay growth in wood samples (in contact with insulation material).
Untreated insulation products like 2.2 and 3.2 (Tab.4) were resistant to mould when exposed to 85% RH. These materials reached from 10.3% to 15.6% of moisture content. Both this low moisture content and the characteristics of the bio-based insulation materials could explain the lower number of cultivable fungal units at the end of the test.
Hygrothermal conditions and insulation configurations
The developed mould test method proved to be easily applied at 26°C 95% RH and 26°C 85% RH for all tested bio-based materials.
This test could be proposed in the future for all bio-based materials. The test condition of 85% RH could be proposed for bio-based materials intended to the “dry use class”. The test condition of 95% RH could be selected for bio-based materials intended to the “wet use class” [Lamoulie et al. 2015].
5 CONCLUSIONS
This study led to an innovative test method to assess the resistance of bio-based insulation materials to moulds, taking into consideration climatic conditions, wall and roof configurations of insulation applications. Because of the complex matrix of bio-based insulation materials it was shown that a quantitative analysis was necessary to complete visual assessment. This analysis led to more reliable results without enhancing the severity of the test.
Two different laboratories obtained similar conclusions about the resistance / non resistance of 13 tests done on 8 different bio-based materials (Tab.5). The reliability of the test method was proved.
This test method could be used to complete and amend the EN15101-1 Annex F.
The moisture content, the inherent composition of the bio-based materials and its additives had an impact on the insulation material resistance to moulds.
Results showed that mould tests need to take into consideration the climatic conditions of insulation materials use in building. Otherwise, results are disconnected from practical and industrial uses. For instance, a mould test carried out at 95% RH can be too severe if the test insulation material is intended to dry conditions.
Among all tested bio-based materials, it was clearly demonstrated that some untreated materials which were not resistant to moulds at 95% RH were resistant to moulds at 85% RH, thus reinforcing the suitability of bio-based materials for insulation.
6 AKNOWLEDGEMENTS
We acknowledge the French Ministry of Ecology, Sustainable development, Transport and Housing for its financial support.
7 REFERENCES Paper in a journal:
Botton, B.; Breton, A.; Fevre, M; Gauthier, S. et al. Moisissures utiles et nuisibles. Importance industrielle. 1990, Masson 2ème édition. P312-313, 512p.
Clarke, J.A.; Johnstone, C.M.; Kelly, N.J.; McLean, et al. A technique for the prediction of the conditions leading to mould growth in buildings. Building and environment, 1999, 34, pp.515-21.
Gutarowska, B.; Piotrowska, M. Methods of mycological analysis in buildings. Building and Environment. 2005, 42 (4): 1843–1850
Haleem Khan, A.A.; Mohan Karuppayil, S. Fungal pollution of indoor environments and its management.
Hocking, A.D; Pitt, J.I.; Samson, R..I.; Thrane, U. Advances in food mycology. Advances in experimental medicine and biology, Springer, 2006, 571, 64-65, 361p.
Yang, C.S. and Johanning, E.. Airborne fungi and mycotoxins. in Manual of environmental microbiology,
1997, ASM Press, Chapitre 70 - p. 656 Paper in proceedings:
Flannigan, B.; Morey, P.; Broadbent, C.; Brown, S.K.; et al. ISIAQ Guideline, Taskforce I: Control of moisture problems affecting biological indoor air quality. International Society of Indoor Air Quality and Climate, 1996, Espoo, Finland.
Lamoulie, J.; Le Bayon, I.; Draghi, M. ; Roger, et al.. Use of bio-based insulation materials in buildings: Modelling of hygrothermal conditions in use- Resistance of a wood fibre material to moulds according to climatic conditions. International Conference on Bio-Based Materials, 22-24 June 2015, Clermont-Ferrand.
Viitanen, H. Preservative effect of cellulose insulation material against some mould fungi and brown rot fungus Coniophora puteana in pine sapwood. The
International Research Group on Wood Preservation. 20-24 May 1991, Japan, IRG/WP/1984, 8 p.
Technical reports or thesis:
Common Understanding of Assessment Procedure (CUAP). European Organisation for Technical
Assessment. Belgium, June 2003, rev. October 2009. Conseil Supérieur d’Hygiène Publique de France Contaminations fongiques en milieux intérieurs. Diagnostic, effets sur la santé respiratoire, conduites à tenir. France. Septembre 2006.
Guide pour la validation de méthodes d’essais microbiologiques et d’évaluation de leur incertitude de mesure dans les domaines de la microbiologie alimentaire et de l’environnement. Document N°328.fw, Suisse, Confédération Suisse. Département Fédéral de l’Economie. Service d’accréditation Suisse. février 2006.
Insectes et champignons du bois. France, CTBA. 1996.
Standards
ASTM C1338. 2008. Standard test method for determining fungi resistance of insulation materials and facings. AFNOR. 3p.
EN15101-1. 2014. Thermal insulation products for buildings. In-situ formed loose cellulose (LFCI) products. Part 1: Specifications for the products before installation. Annex F: Method for determining mould fungi resistance. 64p.
NF EN ISO846. 1997. Plastics. Evaluation of the action of microorganisms. 23p.
NF V18-112. 1991Animal foodstuffs. Determination of ergosterol content. AFNOR. 8p.