Economic Growth and Automobile Dependence:
Is There A Kuznets Curve for Motorization?
by
Debabrata Talukdar
M.S., Operations Research (1991)
Ph.D., Business Administration (1995)
William E. Simon Graduate School of Business Administration University of Rochester, New York
Submitted to the Department of Urban Studies and Planning in Partial Fulfillment of the Requirements for the
Degree of Master in City Planning at the
Massachusetts Institute of Technology June, 1997
@ 1997 Massachusetts Institute of Technology All rights reserved
Signature of A uthor ...
Department of Urban Studies and Planning May 22, 1997
Certified by ...
Accepted by ...
Rilph Gakenneimer
Prissor of Urban Planning and Civil/Environmental Engineering
j4 Thesis Supervisor
Mark Schuster Associate Professor of Urban Studies and Planning Chair, Master in City Planning Committee
JUN 2
5
1997
(O0in
Economic Growth and Automobile Dependence:
Is There A Kuznets Curve for Motorization?
by
Debabrata Talukdar
Submitted to the Department of Urban Studies and Planning on May 22, 1997 in Partial Fulfillment of the Requirements
for the Degree of Master in City Planning ABSTRACT
The motivation of this research is to fill a gap in the existing research in terms of understanding the long-term dynamics of motorization process. The goal is to investigate--both theoretically and empirically--the long-term relationship between economic development and motorization, and specifically to find if there is an inverse-U relationship (i.e., if there is a Kuznets curve for motorization). Such an understanding provides analysts with a way to improve forecasts of the level of motorization in the long-run as well as with a reliable estimate of associated externality costs--both at global and national levels. It is thus a critical ingredient to the development of sustainable motorization policies. The identification of the turning point per capita income level, if any, is also helpful in crafting motorization policies that are consistent and appropriate for different stages of economic development.
The research makes several distinctive contributions to the existing literature. First, it is the only study to explore--both theoretically and empirically--the possible existence of a Kuznets curve for motorization. Second, the theoretical analysis clearly demonstrates the plausibility of the existence of an inverse U-relationship between economic development and motorization. Further, the empirical analysis not only provides strong support for the existence of a Kuznets curve for motorization, but also shows that the Kuznets curve does indeed provide a statistically better description of the long-term relationship between economic development and motorization (in terms of per capita ownership) than either the sigmoidal or the log-linear form commonly used in the existing literature. Finally, the cross-country, time-series data base developed for the empirical analysis is much larger than any used in the existing studies on economic development and motorization.
It should be emphasized that there is no reason to believe that the detected inverse-U relationship between economic development and motorization is automatic or inevitable. The pattern detected is only a reflection of existing policies under the prevailing socio-economic, technological and political conditions. As with the environmental Kuznets curve, the strongest link between economic development and motorization is, in fact, through an induced policy response. Our relatively high estimate of the turning point per capita income at about $21,900 (1993 US$) stems from the fact that, even though most of developed countries already have the institutional capability, it is only recently that public attitude has changed enough to allow hitherto politically unacceptable, but effective, policy interventions to control motorization. As the externality costs of motorization become more apparent, developing countries have the opportunity to avoid following the current motorization-development path through preemptive policy interventions. The turning point is thus likely to decline over time.
Thesis Supervisor: Ralph Gakenheimer
Title: Professor of Urban Planning and Civil/Environmental Engineering Reader: Karen R. Polenske
3
Acknowledgments
The author expresses deep gratitude to his thesis committee members--Professor Ralph Gakenheimer and Professor Karen R. Polenske--for their invaluable advice and encouragement. He also acknowledges Professor Omar M. Razzaz of MIT for his valuable guidance as the academic adviser. Finally, he is immensely grateful to Zmarak M. Shalizi at the Policy Research Department, World Bank for introducing him to the research problem in the first place and for his insightful comments.
Contents
Chapter 1. The Research Issue and Objectives 05
1.1 The Context: Mass Motorization and Rising External Cost 05
1.2 Research Motivation and Relevance 08
1.3 Research Objectives and Contributions 12
Chapter 2. Economic Development and Motorization: A Theoretical Analysis 14
2.1 Why Might Motorization Exhibit an Inverse-U Relationship with
Economic Development? 14
2.2 Analytical Structure to the Conceptual Framework 20
2.3 Externality Costs of Motorization 22
2.4 Trends in Policy Interventions to Tackle Externality Costs of
Motorization 26
Chapter 3. Economic Development and Motorization: An Empirical Analysis 29
3.1 The Data 29
3.2 Empirical Models 34
3.3 Estimation Results 37
Chapter 4. Income Growth and Automobile Dependence: A Microeconomic Model 41
4.1 Model Formulation 41
4.2 Model Implications 42
Chapter 5. Summary 46
Appendix 50
CHAPTER 1: The Research Issue and Objectives
1.1 The Context: Mass Motorization and Rising External Cost
Since the first car rolled out of its primitive production line in 1896, it has gone on to establish
itself as the world's largest consumer product with current annual sales approaching a trillion dollars.
Passage of time has only deepened consumers' love affair with car. In 1950, 50 million cars shared the
earth with 2.6 billion people. By 1996, the totals had grown to 500 million cars (and that excludes
another 277 million in trucks and motorbikes) and 5.5 billion people. In other words, as the human
population doubled, the stock of cars increased tenfold. Country-specific rates vary substantially but,
with the exception of Africa, the pace is higher in developing and transition economies than in North
America and Western Europe (see Figure 1.1). Although economic factors (e.g., the rising income and
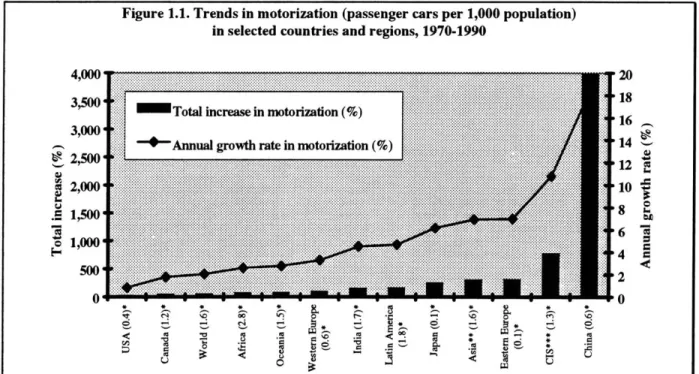
Figure 1.1. Trends in motorization (passenger cars per 1,000 population) in selected countries and regions, 1970-1990
4,000 ...
3,500...at... .
500
20
010
Note: "*" indicates average annual population growth rate between 1970-1990 for respective country or region. "**" indicates Asia excluding China, Japan and India.
"***" CIS stands for the Commonwealth of Independent States (former Soviet Union countries)
the declining price of cars) are arguably the primary driving forces behind such rapid growth in car
ownership, social and cultural factors (e.g., the declining household size and the increasing participation
of women in workforce) are responsible for further accelerating the pace. Assembly lines today roll out
50
million cars a year--that is adding in a year more than what consumers accumulated in the first fifty
years of its initial roll out! Based on current trends, the world's car population is expected to double
itself to 1 billion by 2025 or 2030 [Carson 1996].
Stimulated by increased economic liberalization and a growing urban population with rising per
capita income, developing and transition countries of Eastern Europe and Asia offer the fastest growing
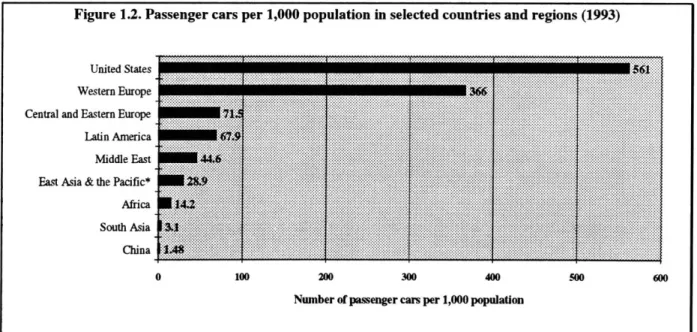
market to domestic and OECD car manufacturers. Judging by the levels of passenger cars per capita
reached in developed countries, the market potential looks enormously attractive (see Figure 1.2). Not
surprisingly, the world's big car companies are eagerly setting up joint-venture production facilities in
South East Asia, Eastern Europe and Latin America [Carson 1996]. Recent forecasts show that
motor-vehicle (which includes both passenger and commercial motor-vehicles) sales in Asia will surpass that in North
America and Europe by 2005, when they are projected to hit nearly 19 million a year [Cox 1996].
Figure 1.2. Passenger cars per 1,000 population in selected countries and regions (1993)
Latin America... ... .
Middle East i... .... .
East Asia & the Pacific*...
....
...
AfricaU14 South Asia S
China
1
_ _ _ _0 100 200 300 400 500 600
Nwmber of passenger cars per 1,000 population
Note: "*" indicates East Asia and the Pacific excluding China and Japan.
By conservative estimates, Asians will buy 7% to 8% more vehicles each year well into the next decade,
compared to 2% to 3% more a year for North Americans and Europeans. Many Asian countries like China, India, Indonesia, Malaysia and Thailand will see double-digit growth in their annual automobile sales. The emerging consensus is that the world is experiencing mass motorizationI [Altshuler and Roos 1984; Lowe 1990; OECD 1995; World Bank 1996; WRI 1996].
As the reality of mass motorization begins to sink in, the focus is shifting to its implications. The benefits are obvious--tell-tale signs of a prospering world in pursuit of greater freedom through increased mobility. Some developing and transition countries would like to emulate the wealth and inter-industry linkages created by the car inter-industry in developed countries. However, the externality costs of motorization are also becoming more and more apparent [MacKenzie et al. 1992; Roberts 1995]. Recent estimates put the total externality cost of motorization in developed countries at about 2% of gross domestic product2 (GDP), with congestion and accident costs contributing nearly 80% of it [BTCE/EPA 1994; OECD 1990a]. Estimates for developing countries are few but are generally considered to be higher. For example, road accidents alone costs Kenya about 1.3% of its GDP [World Bank 1996]. We discuss the externality costs of motorization in greater detail in Chapter 2.
Not surprisingly, the degree of dependence on motorized road transport--with its problems of traffic accidents, congestion, pollution and urban sprawl--is fast emerging as a critical public policy issue [Economist 1996a; Gerondeau 1996; Hart and Spivak 1993; Newman and Kenworthy 1996; Roberts 1995]. Even as the debate on the accuracy of the estimates of the externality costs of motorization continues, there is an emerging consensus that the current pace of motorization is too high to sustain without its costs soon outweighing its benefits [Lowe 1990; MacKenzie and Walsh 1990;
Motorization, usually defined to describe the dependence of a country or a region on motorized road transport, can be measured in many ways. For the purpose of this research, we adopt the most commonly used measure, viz., per capita motor vehicle ownership in a country [Stares and Liu 1995].
2 For rest of the paper, we will use the abbreviations GDP and GNP to denote gross domestic product and gross national product, respectively.
OECD 1988, 1994, 1995; World Bank 1996; WRI 1996]. Hence, the impetus is to come up with policies
that will put motorization on a "sustainable" time path [Banister and Button 1993; Dugonjic et al. 1993; Nijkamp 1994; Throsby 1993].
1.2 Research Motivation and Relevance
With likely investment of hundreds of billions of dollars in surface transport over the next two or three decades in developing and transition economies, the need for sustainable motorization policies is more relevant than ever [World Bank 1994a, 1996]. An essential ingredient to the development of such sustainable motorization policies is a reliable forecast of long-term trends in motorization and its associated externality costs--both at global and national levels. For example, automobile emissions account for 20% of world carbon dioxide output--a primary greenhouse gas responsible for global warming. So a reliable forecast of long-term trends in motorization is critical to the studies of future global warming trends and to the development of sustainable motorization policies [Carson 1996]. The ability to come up with such a reliable forecast, in turn, depends on how good is our understanding of the long-term dynamics between economic development and motorization.
Naturally, the long-term relationship between economic development and motorization has been an active area of research in transportation economics [Hau 1997; Stares and Liu 1995]. The popular notion has been that "there is an inevitable link between rising living standards and rising demands for private space and car use" [Newman et al. 1995]. Such a notion draws directly from casual empiricism that is replete with evidence that economic growth fuels motorization (see Figures 1.3 and 1.4). Accordingly, existing research posits either a continuous positive relationship between motorization and income (log-linear models) or a saturation level of motorization at high income (sigmoidal or quasi-logistic models) [Gakenheimer and Steffes 1995]. Although formal empirical studies3 have usually
3 See, for example, Button et al. [1993], Kain [1983], Kain and Liu [1994], Mogridge [1989], Silberston [1970] and Wheaton [1980].
confirmed a positive relationship between economic development and motorization, the issue is far from resolved [Gakenheimer and Steffes 1995; Hau 1997; Newman et al. 1995; Nijkamp 1994; Stares and Liu 1995].
The assumptions underlying the log-linear or sigmoidal relational forms, as well as data limitations, raise questions about the validity of the findings to date. A survey of the existing literature
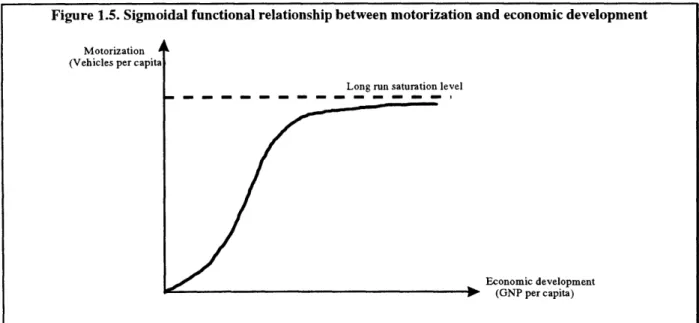
indicates that the empirical estimates of income elasticity of motorization exhibit a wide variation--from a low of 0.3 for developed countries to a high of 1.95 for developing countries. Such variation in estimates is inconsistent with the specification of log-linear relational form, which imposes an a priori restriction of constant income elasticity of motorization. The sigmoidal relational form (see Figure 1.5) does allow for variation in income elasticity of motorization but restricts it to only non-negative values. In other words, it a priori rules out the possibility that higher income in the long run can ever reduce the dependence on motor-vehicles.
Figure 1.5. Sigmoidal functional relationship between motorization and economic development
Motorization A (Vehicles per capita
Long run saturation level
Economic development P (GNP per capita)
The fact is that a long-term positive relationship between economic development and motorization is neither inevitable nor automatic. For example, recent empirical research in environmental economics suggests a long-term inverse-U relationship between economic development
and environment. Such relationships, known as environmental Kuznets curves, have been confirmed for a variety of environmental indicators like levels of deforestation, sulfur dioxide emission and suspended particulate pollution [Grossman and Krueger 1994, Selden and Song 1992; Shafik 1994]. The rationale behind the environmental Kuznets curve is that economic development gives rise to a structural transformation in how an economy consumes and produces to conserve its scarce resources like environment more efficiently [Antle and Heidebrink 1995; Shafik 1994; Syrquin 1989]. Over time, such structural transformation may, in fact, reverse the expected positive relationship between economic development and environmental degradation. It should be noted that the original notion of the Kuznets curve can be traced to the seminal work by Simon Kuznets4 [1955] who demonstrated a long-term
inverse-U relationship between economic development and income inequality. Now, any variable with a similar inverse-U relationship with economic development is said to exhibit a Kuznets curve.
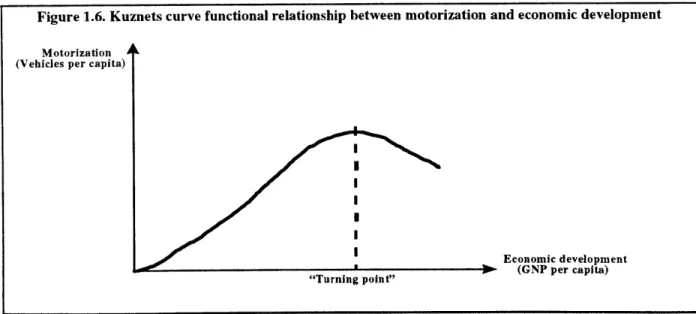
Given that motorization entails adverse environmental impacts, can we expect motorization to exhibit a Kuznets curve, i.e., an inverse-U relationship with economic development (see Figure 1.6)?
Figure 1.6. Kuznets curve functional relationship between motorization and economic development
Motorization (Vehicles per capita)
Economic development
3
(GNP per capita) "Turning point"Arguably, a Kuznets curve for motorization does not follow directly from the environmental Kuznets curves, which apply to environmental pollution itself rather than to pollution sources like motorization.
However, it is conceivable that the structural transformation that produces Kuznets curves for pollution can produce the same for pollution sources as well.
The critical question is whether there indeed exists a Kuznets curve for motorization. If it does not exist, economic development will necessarily mean an ever-increasing dependence on motor-vehicles. On the other hand, if it does exist, economic development will lead to a long-term structural transformation in the economy that will reduce dependence on motor-vehicles (either directly through change in consumer preferences, or indirectly through social pressure on government to engage actively in policy interventions). The motivation of the proposed research lies in determining which of these development paths best describes the current motorization trends. As noted earlier, this information is essential for reliable estimates of long-term trends in motorization and its associated externality costs--both at global and national levels. They are thus critical ingredients to the development of sustainable motorization policies. The identification of the turning point per capita income level, if any, is also helpful in crafting motorization policies that are consistent and appropriate for different stages of economic development.
1.3 Research Objectives and Contributions
My research objective is to analyze--both theoretically and empirically--the long-term
relationship between economic growth and automobile dependence. Specifically, the research seeks to:
9 Analyze theoretically as to why the long-term relationship between economic development and
motorization may exhibit Kuznets curve. Motorization is defined in terms of a country's dependence on motor-vehicle and is measured as per capita motor-vehicle ownership.
* Develop a large data base (annual data for 50 developing and developed countries over a period of
25 years, 1969-1993) for econometric analysis of the long-term relationship between economic
development and motorization at the aggregate level.
* Test empirically as to whether the Kuznets curve provides a statistically better description for the long-term relationship between economic development and motorization than the sigmoidal and log-linear relationships commonly used in the existing literature.
* Estimate the income elasticity of motorization at different levels of economic development.
* Develop a simple microeconomic model to investigate the relationship between automobile dependence and income growth at the individual level, and to explore its policy implications.
The research makes several distinctive contributions to the existing literature. First, it is the only study to explore--both theoretically and empirically--the possible existence of a Kuznets curve for motorization. The conceptual and theoretical analyses clearly demonstrate the plausibility of the existence of an inverse U-relationship between economic development and motorization. Second, the empirical analysis not only provides strong support for the existence of a Kuznets curve for motorization, but also shows that the Kuznets curve does indeed provide a statistically better description of the long-term relationship between economic development and motorization (in terms of per capita ownership) than either the sigmoidal or the log-linear form commonly used in the existing literature. Finally, the cross-country, time series data base developed for the empirical analysis is much larger than any used in the existing studies on economic development and motorization.
The research is organized as follows: Chapter 2 provides a theoretical analysis of the long-term relationship between economic development and motorization. Chapter 3 uses national level aggregate
data -- cross-sectional time-series pooled data across 50 countries over 25 years (1969-1993) -- for
empirical analysis of the long-term relationship between economic development and motorization. Chapter 4 develops a simple microeconomic model of the relationship between income growth and automobile dependence at the individual level and investigates its policy implications. Finally, Chapter 5 summarizes the research and the policy implications of its major findings.
CHAPTER 2: Economic Development and Motorization: A Theoretical Analysis
2.1 Why Might Motorization Exhibit an Inverse-U Relationship with Economic Development?
An intuitive question is why motorization should be affected by economic development in anything but a positive fashion. The intuition usually goes: as per capita income rises with economic development, so should per capita demand of motor-vehicles and, hence, so should motorization. This argument misses the potential interaction between economic development and structural adjustments to mitigate the adverse impacts of motorization as a country develops economically. As research in environmental economics indicates, economic development may lead to a structural transformation in the economy that reduces environmental degradation (either directly through change in consumer preference, or indirectly through policy interventions) beyond a "turning" level of economic development [Cropper and Griffiths 1994]. To understand theoretically as to how such a transformation might work in the case of motorization, we use the microeconomic framework. From standard microeconomic consideration, the demand for per capita motor-vehicle ownership (i.e., motorization) will depend on the per capita income and relative price of motor-vehicle ownership. It should be pointed out that economic factors like income and price are not the exclusive determinants of motorization. Many non-economic factors like social status of women, household size, etc. are also determinants of motorization, and their effects could be substantial in the short-run. However, here we focus primarily on economic factors since we are interested in the long-term trends in motorization.
2.1. 1. Relationship between demand for per capita motor-vehicle ownership and per capita income:
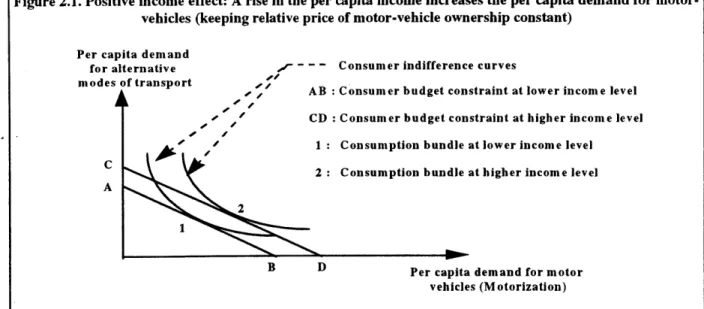
The income elasticity of motor-vehicle ownership will determine whether an increase in per capita income under constant relative price of motor-vehicle ownership leads to an increase in demand for per capita motor-vehicle ownership. Making the realistic assumption that motor-vehicle ownership is at least a "normal good" (i.e., income elasticity is positive but less than 1) at very low levels of income, we can conclude that a rise in per capita income will increase the demand for per capita vehicle
ownership (see Figure 2.1). In fact, it is more likely that motor-vehicle ownership is a "superior good" (i.e., income elasticity is greater than 1) at very low levels of income; so the positive income effect on the demand for per capita vehicle ownership will be substantial. Based on how the income elasticity of motor-vehicle ownership changes over different levels of income, it follows that the demand path (the
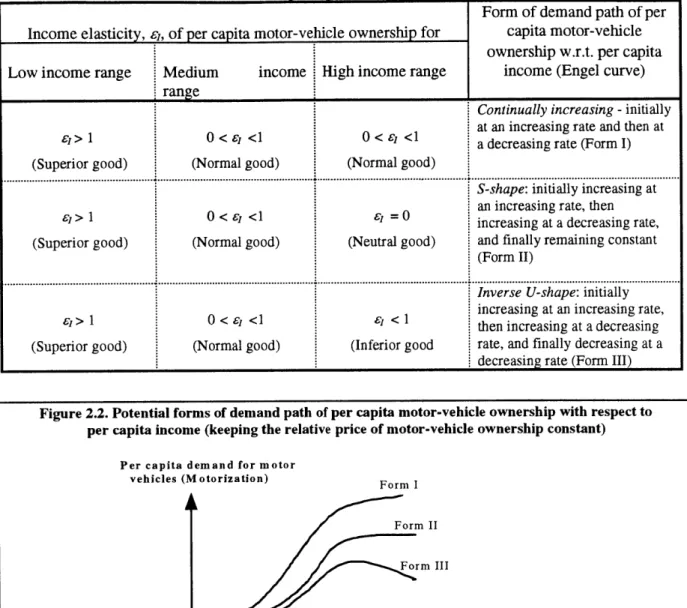
Engel curve) of per capita motor-vehicle ownership with respect to per capita income can take three
forms (see Table 2.1 and Figure 2.2): (1) continually increasing; (2) S-shape; and (3) inverse-U shape. From an intuitive behavioral perspective, the S-shaped form for the Engel curve is appealing based on the notion that per capita demand for motor-vehicles is likely to reach a "use saturation" limit, simply because of individual time constraint even if there is no income constraint. However, as Table 2.1 and Figure 2.2 show, what would be the actual form of the Engel curve is essentially an empirical issue that depends on the income elasticities of motorization. We cannot rule out the theoretical possibility that the income effect alone may produce an Engel curve that resembles the Kuznets curve in terms of inverse-U relationship between per capita income and per capita motor-vehicle ownership. In Chapter 4, we develop a simple microeconomic model to explore further this theoretical possibility.
Figure 2.1. Positive income effect: A rise in the per capita income increases the per capita demand for
motor-vehicles (keeping relative price of motor-vehicle ownership constant)
Per capita demand
for alternative / - -- Consumer indifference curves modes of transport4P m,
AB : Consumer budget constraint at lower income level CD : Consumer budget constraint at higher income level
1 : Consumption bundle at lower income level
C 2 : Consumption bundle at higher income level
A
Per capita demand for motor
vehicles (Motorization)
Table 2.1. Some potential forms of the demand path of per capita motor-vehicle ownership with respect to
per capita income
Form of demand path of per
Income elasticity, g, of per capita motor-vehicle ownership for capita motor-vehicle
ownership w.r.t. per capita
Low income range Medium income High income range income (Engel curve)
range
Continually increasing -initially at an increasing rate and then at a decreasing rate (Form I) (Superior good) (Normal good) (Normal good)
... ... .. . .
S-shape: initially increasing at
an increasing rate, then increasing at a decreasing rate, (Superior good) (Normal good) (Neutral good) and finally remaining constant
(Form II)
Inverse U-shape: initially
increasing at an increasing rate,
then increasing at a decreasing
(Superior good) (Normal good) (Inferior good rate, and finally decreasing at a
decreasing rate (Form III)
Figure 2.2. Potential forms of demand path of per capita motor-vehicle ownership with respect to per capita income (keeping the relative price of motor-vehicle ownership constant)
Per capita demand for motor
vehicles (Motorization) Form I
Form II
Form III
Per capita income
2.1.2. Relationship between demand for per capita motor-vehicle ownership and relative price :
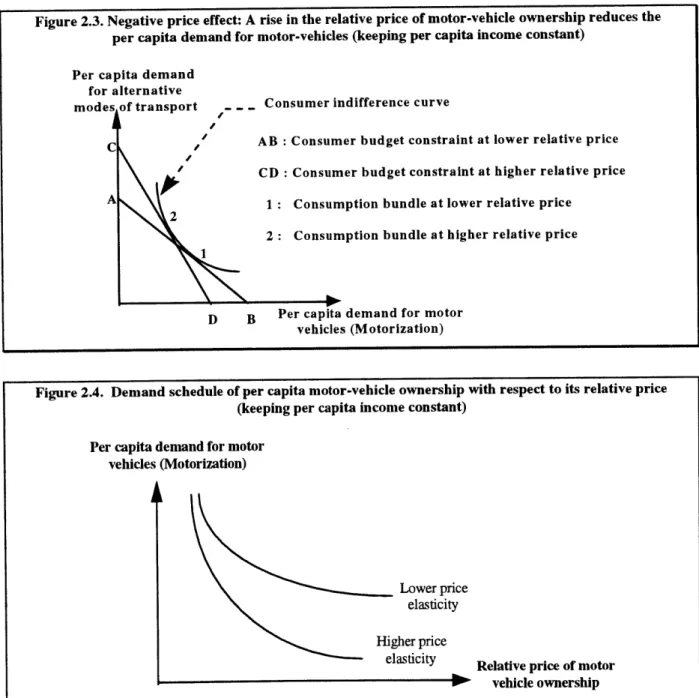
From the standard law of demand, the relative price elasticity of motor-vehicle ownership is always negative. Thus, any increase in the relative price of motor-vehicle ownership will reduce the per
5 The relative price of motor vehicle ownership represents the total cost to a motor vehicle user in terms of vehicle acquisition and usage relative to the total cost of alternative modes of transport.
capita demand for motor-vehicles (see Figure 2.3). In other words, the relationship between the per capita demand for motor-vehicle ownership and the relative price of motor-vehicle ownership will follow the standard downward sloping demand schedule, with income remaining constant (see Figure 2.4). The higher the price elasticities of motorization, the higher will be the drop in per capita demand for cars for a given increase in relative price.
Figure 2.3. Negative price effect: A rise in the relative price of motor-vehicle ownership reduces the per capita demand for motor-vehicles (keeping per capita income constant)
Per capita demand for alternative
modes of transport - - - Consumer indifference curve
C AB Consumer budget constraint at lower relative
price
CD : Consumer budget constraint at higher relative price
A 1 : Consumption bundle at lower relative price
2
2 : Consumption bundle at higher relative price 1
D B Per capita demand for motor vehicles (Motorization)
Figure 2.4. Demand schedule of per capita motor-vehicle ownership with respect to its relative price (keeping per capita income constant)
Per capita demand for motor vehicles (Motorization)
Relative price of motor vehicle ownership
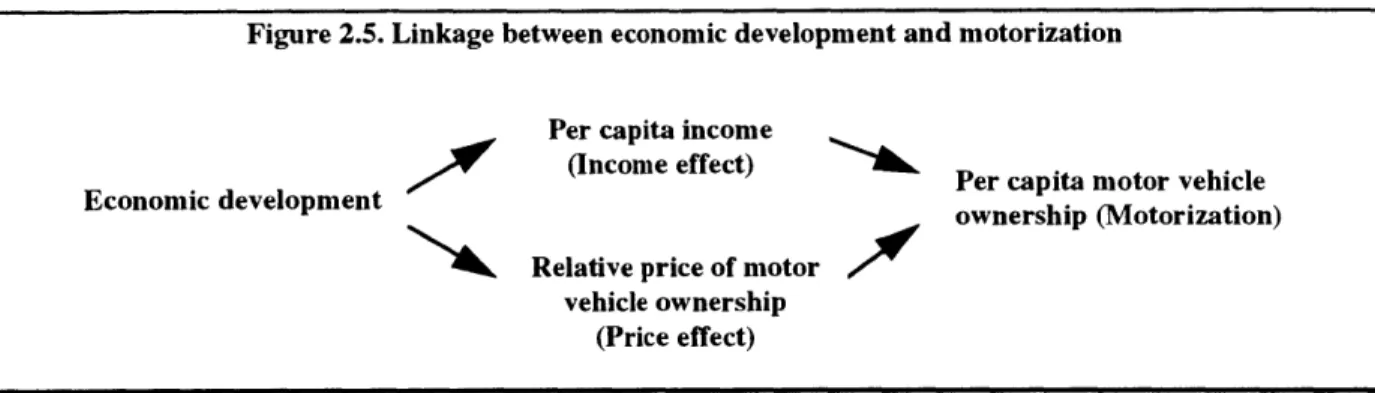
2.1.3. Relationship between economic development and motorization:
To understand the long-term relationship between economic development and motorization (per capita motor-vehicle ownership), one should first recognize that it involves the simultaneous effects of income and relative price changes on the demand for per capita, motor-vehicle ownership. As an economy develops, it affects motorization through its intermediate impacts on the per capita income and on the relative price of motor-vehicle ownership (see Figure 2.5).
Figure 2.5. Linkage between economic development and motorization
Per capita income
Economic development (Income effect) Per capita motor vehicle
Relative price of motor ownership (Motorization)
vehicle ownership (Price effect)
The impact of economic development of a country on its per capita income is obvious and is positive by definition. However, its impact on the relative price of motor-vehicle ownership is less than
obvious. One can argue either way. The relative price of motor-vehicle ownership might go down with economic development due to declining usage cost (induced by better quality infrastructure, that reduces vehicle operating cost) as well due to declining acquisition cost (induced by better production technology and competitive pressures on the supply side, that lower the price of vehicles). On the other hand, economic development may also lead to social pressure on government to engage actively in policy interventions to reduce the external costs of motorization. Such policy interventions can translate to an increased relative price for motor-vehicles to internalize the external costs of motorization. Depending on the case, the long-term relationship between economic development and motorization can take various forms (see Figure 2.6). What would be the actual form of the long-term relationship
between economic development and motorization is an empirical question and will depend critically on how the relative price of motor-vehicle ownership changes with economic development.
As Figure 2.6 (Case I) shows, if the relative price of motor-vehicle ownership is declining with economic development, a positive income effect is reinforced by a positive price effect to result in a continually increasing per capita demand for motor-vehicles. On the other hand, if the externality costs
Figure 2.6. Potential forms of long-term relationship between economic development and motorization
Case I. Declining relative price of motor-vehicle ownership with S-shaped income effect
Per capita demand for motor
vehices (Motorization)
t A - Net effect
Relative pice of motor vehicle ownership Per capita income _ Economic development Income effect Price effect Economic development
Case II. Increasing relative price of motor-vehicle ownership with S-shaped income effect
Per capita demand for motor v hicles (Motorization)
T
Income effectRelative price of motor vehicle ownership Per capita income _ Economic development Price effect int" Economic development
of motorization are high enough, government policy interventions to internalize such cost may lead to an increasing relative price of motor-vehicle ownership. In that case, the policy-induced negative price effect may more than offset the positive income effect on per capita demand for motor-vehicles. The
result would be a decline in per capita demand for motor-vehicles after a certain "turning point" level of economic development, i.e., a long-term inverse U-relationship between economic development and motorization (Case II in Figure 2.6). In other words, even if motorization follows a sigmoidal or
S-shaped relationship with income alone based on "use saturation" argument, it can still end up having an inverse-U relationship with economic development because of the price effect. Putting it all together, the above conceptual microeconomic framework clearly demonstrates that, contrary to popular notion, a long-term positive relationship between economic development and motorization is neither inevitable nor automatic.
2.2 Analytical Structure to the Conceptual Framework
We now give analytical structure to the earlier conceptual microeconomic framework for investigation of the long-term relationship between economic development and motorization. A motor-vehicle user's decision problem can be structured as:
Maximize M (m, a)
m, a (2.1)
subject to the income constraint: P. m + Pa a = I
where: M (.) = Mobility function based on motor-vehicles and alternative modes of transport m = Demand for per capita motor-vehicle ownership (motorization)
a = Demand for per capita alternative modes of transport PM = User price of motor-vehicle ownership
Pa = User price of alternative modes of transport I = Per capita income spent on transport
The above decision problem is exactly analogous to the standard microeconomic utility maximization problem subject to income constraint. If we know the specification of the mobility function, we can solve for the user's demand for motor-vehicle ownership and alternative modes of transport. In general,
it follows from the structure of the above decision problem that the demand for per capita motor-vehicle ownership (motorization) will be a function of the user price of motor-vehicle ownership, the user price of alternative modes of transport and the income spent on transport:
m = f (P. , Pa , I) (2.2)
To understand how motorization, m, will change with economic development, E, we can use the comparative static analysis of the functional expression (2.2):
dm/dE = (Sm /SP.). (d P. dE) + (&n SPa ). (d Pm /dE) + (&S/5S). (d dE) (2.3)
Equation (2.3) can be written in terms of corresponding elasticities as:
N'E = ilPm N P E + TiPaN 'E + 1 N'E
(2.4)
where the various elasticities with their expected signs (shown within parenthesis) are:
r/"PM = Own-price elasticity of motorization (-ve)
N P"E = Elasticity of price of motorization with respect to economic development (+ve or -ve)
inPa = Cross-price elasticity of motorization with respect to alternative modes of transport (+ve)
NPaE = Elasticity of price of alternative modes of transport with respect to economic development (+ve or -ve)
rf" = Income elasticity of motorization (+ve; may be zero or -ve at high income) NIE = Elasticity of income with respect to economic development (+ve)
From equation (2.4) and the expected signs of various elasticities, it follows that the expected sign of total or derived elasticity, N'E, Of motorization with respect to economic development can be
both positive or negative. In other words, the long-term relationship between motorization and economic development can be either positive or negative. Two crucial factors that will determine whether motorization increases or decreases with economic development are the price elasticity, N P E, Of
motorization and the price elasticity, NPaE, Of alternative modes of transport with respect to economic development. For example, if the externality costs of motorization are high enough, government policy
interventions to internalize such cost may lead to an increasing relative price of motor-vehicle ownership. In that case, NP' E and N'"E will be positive and negative, respectively. The result, as evident from expression (2.4), could be a reversal of sign of the total elasticity, N'"E, of motorization from positive to negative, thereby producing a long-term inverse U-relationship between economic development and motorization (Case II in Figure 2.6). The point is whether that would indeed be the case is an empirical question, but can not be ruled out theoretically. That is the premise and focus of this research. Before we get into the empirical analysis of the long-term relationship between motorization and economic development, it is therefore worthwhile to get some idea of the externality costs of motorization and the trends in policy interventions to reduce or internalize those costs.
2.3 Externality Costs of Motorization
The four primary externality costs of motorization are due to:
1. Automotive environmental pollution,
2. Road traffic accidents,
3. Road traffic congestion, and
4. Urban sprawl
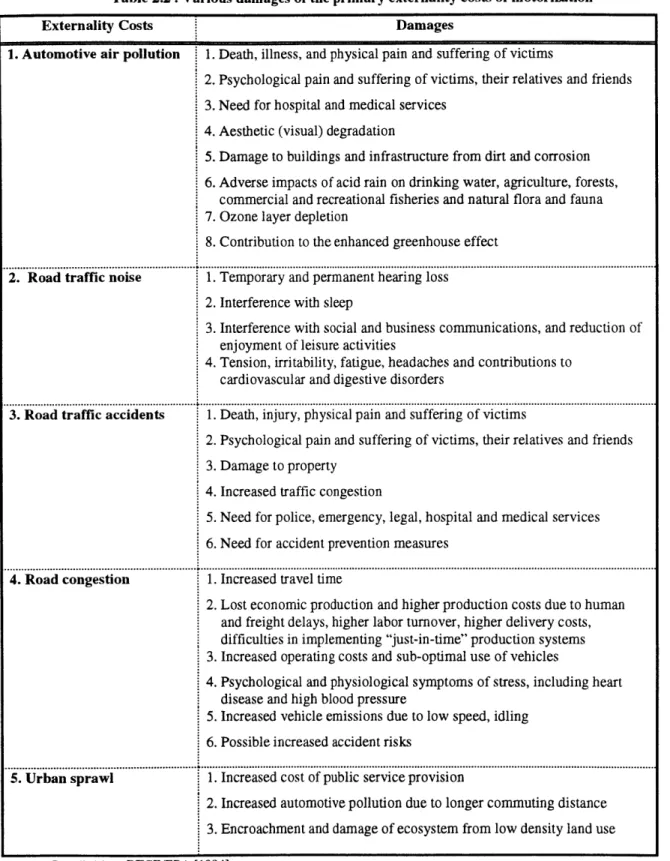
Although air and noise pollution are considered to be most important, the scope of automotive environmental pollution also includes land and water pollution. The vehicle emissions responsible for air pollution include carbon dioxide, carbon monoxide, oxides of nitrogen, sulfur dioxide, volatile organic compounds, lead particulate and smoke. Factors responsible for land pollution include waste oils, tires, batteries, spoil tips, and rubble from road works as well as acid rain caused by automotive emissions. Water pollution is caused by road surface run-offs, waste oils, etc. Table 2.2 shows the various damages of the primary externality costs of motorization.
Even as the debate on the accuracy of the existing estimates continues, all indications are that the externality costs of motorization may be substantial. For example, a study by the World Resources
Table 2.2. Various damages of the primary externality costs of motorization
Externality Costs Damages
1. Automotive air pollution 1. Death, illness, and physical pain and suffering of victims
2. Psychological pain and suffering of victims, their relatives and friends
3. Need for hospital and medical services
4. Aesthetic (visual) degradation
5. Damage to buildings and infrastructure from dirt and corrosion 6. Adverse impacts of acid rain on drinking water, agriculture, forests,
commercial and recreational fisheries and natural flora and fauna
7. Ozone layer depletion
8. Contribution to the enhanced greenhouse effect
2. Road traffic noise 1. Temporary and permanent hearing loss
2. Interference with sleep
3. Interference with social and business communications, and reduction of
enjoyment of leisure activities
4. Tension, irritability, fatigue, headaches and contributions to cardiovascular and digestive disorders
3. Road traffic accidents 1. Death, injury, physical pain and suffering of victims
2. Psychological pain and suffering of victims, their relatives and friends
3. Damage to property
4. Increased traffic congestion
5. Need for police, emergency, legal, hospital and medical services
6. Need for accident prevention measures
4. Road congestion 1. Increased travel time
2. Lost economic production and higher production costs due to human and freight delays, higher labor turnover, higher delivery costs, difficulties in implementing "just-in-time" production systems
3. Increased operating costs and sub-optimal use of vehicles
4. Psychological and physiological symptoms of stress, including heart disease and high blood pressure
5. Increased vehicle emissions due to low speed, idling
6. Possible increased accident risks
5. Urban sprawl 1. Increased cost of public service provision
2. Increased automotive pollution due to longer commuting distance
3. Encroachment and damage of ecosystem from low density land use
directly by the motorists--at about $300 billion a year for the United States economy, or 5.3% of its
GDP. That roughly translates to an indirect annual subsidy of $2000 to each car owner to pay for road
construction and maintenance, loss of economic activity from congestion, the cost of illness caused by air pollution, and medical care for the victims of nearly two million accidents a year in the United States. Another study by the Organization of Economic Cooperation and Development (OECD) [1990a] estimates that the typical externality costs of land transport in most developed countries are at least 2.5% of GDP, with motor-vehicles responsible for 90% of it. This lower figure excludes the costs of congestion and the wider aspects of environmental pollution such as noise and acid rain.
Unfortunately, most of the existing research on externality costs of motorization has focused on developed countries (see Table 2.3)--primarily because of the relative ease in data availability. The results for developing countries are far fewer and less rigorous, but seem to be worse than developed countries. For example, the cost of road traffic congestion in the United States is about 1.3% of its GNP in contrast to nearly 10% of Thailand's GNP for Bangkok city alone [OECD 1994; Sayeg 1992]. In Kenya, economic losses from road accidents alone amount to 1.3% of its GDP [World Bank 1996].
Table 2.3. Indicative externality costs of motorization for selected developed countries (per cent of gross domestic product)
Type of social costs
Country Noise Pollution Air Pollution Accidents Congestion Total
France 0.24 0.15 0.78 0.90 -3.00 2.07 -4.17 Germany 0.20 0.20 -0.34 0.75 2.00 3.15 -3.29 Netherlands 0.23 0.14 -0.23 0.51 2.00 2.88 -2.97 UK 0.50 0.05 -0.12 0.51 3.20 4.26 -4.33 USA 0.06 -0.21 0.10 -0.21 0.60 -0.72 1.00 - 1.55 1.76 -2.69 Australia 0.11 0.21 0.60 1.06 1.98 Overall 0.15 -0.24 0.12 -0.21 0.63 -0.70 1.38 - 1.94 2.28 -3.09 average*
* Average of countries in this table, weighted by GDP.
Source: BTCE/EPA [1994]
The trend in road fatality rates across countries at different stages of economic development is also quite revealing (see Figure 2.7). The developing world accounted for a majority of the estimated 885,000
deaths from traffic accidents in 1993. In India, for example, roadway death rates (road deaths per 1,000
vehicles) are 18 times higher than those in Japan, accounting for 60,000 fatalities per year [WRI 1996].
China--with only 6.5 million motor-vehicles--experience approximately 50,000 deaths a year in road
accidents. This level of mortality from road accidents is higher than that (approximately 40,000 deaths a
year) in the United States with nearly 200 million motor-vehicles [IRF 1994, Roberts 1995]! Empirical
evidence also clearly shows that the amount of air pollution emitted per motor-vehicle in developing
countries is much higher than that in developed countries [Faiz et al. 1990]. The reasons are not hard to
understand--developing countries do not have the technological or financial capacity to combat auto
pollution at the same level as developed countries.
Figure 2.7. Road fatality rates, by country income group*, 1993
Hgh-incom
0 10 20 30 40 50 60 70 80 90
1Ftalites per 10,000 ildes
Source: World Bank [1996]
*Refer to the Appendix for definitions of income groups.
As only a few urban cities usually account for the lion's share of the national motor-vehicle fleet
in a developing country, they bear most of the burnt of the negative externalities of motorization. The
externality costs of motorization in cities like Bangkok, Mexico City, and Cairo are widely recognized
as causing significant dents in respective national GDPs [Sathaye et al. 1994]. For example, the cost of
traffic congestion in Bangkok alone is estimated at nearly 10% of Thailand's GNP [Sayeg 1992]. The air quality in Bangkok has deteriorated so severely that at least one million of the city's residents were treated in 1990 for smog-related health problems such as emphysema and asthma. In Mexico City, the total cost of air pollution--most of which is caused by automobiles--is estimated at about 0.4% of Mexico's GDP [Margulis 1992]. Lead concentrations in some areas of Cairo are five to six times higher than the global norms set by the World Health Organization, and as a result the lead content in the blood of children in Cairo is about five times as high as that of children in rural Egypt [Stickland 1993]. Also, a recent study concluded that there was a high probability that the mental capacity of the children in Cairo was diminished due to exposure to high ambient lead concentrations [Sathaye et al. 1994].
2.4 Trends in Policy Interventions to Tackle Externality Costs of Motorization
As the externality costs of motorization has become more and more apparent, recent years have seen a marked shift in public attitude towards motorization [Hart and Spivak 1993; Newman and Kenworthy 1996; Roberts 1995; WRI 1996]. Motor-vehicles are increasingly seen as the worst polluters of urban air and the biggest producers of carbon dioxide, the chief suspect in global warming. As one would expect, public pressure for policy interventions to internalize the externality costs of motorization has become particularly strong in developed countries. Britain and other Western European countries have experienced a recent surge in public resistance to road-building. In Japan, two recent court cases, in Osaka and Kobe, have gone in favor of protesters who wanted urban motorway plans changed to cut noise and pollution. A new ring road planned for Tokyo is bogged down in opposition from residents, a new phenomenon in Japan [Carson 1996].
In developed countries with high population density, there is a growing recognition that simply building more roads will not reduce traffic congestion or accidents, but will only worsen automotive air pollution. Instead, attention has increasingly turned to policy interventions that manage and limit demand [Stares and Liu 1995; Strickland and Wayne 1995]. The main policy strategy has been to
increase the cost of private motor-vehicle ownership relative to the cost of using public transport, thereby producing a policy induced negative price effect on private motor-vehicle ownership [Nijkamp 1994; World Bank 1996]. Such strategies include policy interventions like higher fuel tax and parking fee, increased time and space restrictions, road pricing as well as better management and expansion of public transport system to make it a more attractive alternative to private transport.
The British government has already committed to increasing fuel prices by at least 5% in real terms, and has been doing so for the last four years [Economist 1996c]. The movement of cars, especially private cars, has come under increasing restriction. Singapore is already well known for its effective "area licensing scheme" that puts severe time and space restrictions on movements of private cars. In France, the government has just introduced a clean-air law giving local prefects power to close city centers to cars when air pollution rises above levels that pose a threat to health. In Italy, the center of Milan is closed to petrol-powered cars. Most Dutch cities have adopted "traffic calming" measures that include banning all vehicles in central downtown areas to convert them into pedestrian malls [Carson 1996; Munn and Patterson 1995]. In fact, worried that governments might ban conventional cars from city centers because of pollution and congestion, European car manufacturers are already taking preemptive action by working on developing more fuel efficient and smaller cars [Economist 1996b]. There has also been evidence of an emerging European "congestion consciousness" that shows a more positive public attitude towards adoption of road pricing [Grieco and Jones 1994]. In many Western European countries like Denmark, France, Germany, Netherlands, and Switzerland, integration of fares and services across transit modes (e.g., bus to rail) has made public transportation use easy and competitive with the automobile in terms of travel time and comfort [OECD 1995].
As policy interventions to reduce automobile dependence have increased, their effectiveness have also come under scrutiny [Button 1994]. Of particular interest, especially in the context of this research, is to what extent such policy interventions have been successful in reducing motorization in the face of rising income. In other words, to what extent have the policy-induced negative price effects
been able to offset the positive income effect from economic development? Some preliminary empirical evidence at the city level between the United States (which has used relatively few policy interventions) and Western Europe suggest that such policy interventions may have been able to break or at least weaken the expected positive relationship between motorization and income. As shown in Table 2.4, per capita car use grew three times more in Los Angeles (LA) than in Zurich, while public transit declined in LA and grew substantially in Zurich. Similar patterns are evident in other United States and
Table 2.4 .A comparison of income, car use and public transit use in Zurich and Los Angeles
GNP per capita ($US, Growth in annual car use Growth in public transit use
City 1991) per capita, 1980-1990 (Krm) per capita, 1980-1990
Los Angeles, USA 21, 560 2,584 -4 trips
Zurich, Switzerland 33,510 879 + 137 trips
Source: Newman et al. [1995]
European cities, including large cities such as Amsterdam, Paris, Frankfurt, London and Stockholm [Munn and Patterson 1995, Newman et al. 1995]. Naturally, a question arises as to whether such casual empirical evidence of policy-induced weakening of the positive link between automobile dependence and income in a few wealthy countries can hold up to the test of systematic econometric analysis of large-scale data. In other words, are these empirical observations indicative of a generalizable systematic trend? That is the question that we try to answer in our next chapter.
CHAPTER 3: Economic Developmdnt and Motorization: An Empirical Analysis
3.1 The Data
The data base developed consists of annual data for 50 selected countries for 25 years
(1969-1993) and is much larger than any data base used in the existing studies on motorization. The countries
(see Appendix ) selected represent a wide range of developing and developed economies from all over the world. The data base contains national level data on five variables: (1) total number of registered motor-vehicles (excludes motorcycles); (2) GNP per capita in current US dollar; (3) population; (4) population density; and (5) urbanization. In addition, it contains Consumer Price Index (CPI) data for the United States from 1969 to 1993. The data base is created from various secondary data sources like
the World Tables [World Bank 1981, 1995], United Nations Statistical Yearbook [UN 1976, 1982, 1984,
1995], World Motor-vehicles Data [AAMA 1992] and World Road Statistics [IRF 1994].
Urbanization is measured in terms of the proportion of total population living in urban areas [World Bank 1981, 1995]. We use per capita motor-vehicle ownership (specifically, motor-vehicles per
1,000 population) as the measure of motorization or automobile dependence for an economy. Per capita
vehicle usage (specifically, average miles traveled per year per vehicle per capita) would arguably be a better measure of automobile dependence. However, such data are very hard to get, especially for developing countries. Since our empirical analysis requires a large number of developing countries for investigating the relationship of motorization at lower levels of economic development, we selected per capita vehicle ownership as the measure of motorization. The selection also has the advantage of comparability of our results directly with those in the existing literature, which have mostly used per capita motor-vehicle ownership to estimate the income elasticity of motorization [Gakenheimer and Steffes 1995; Stares and Liu 1995]. Table 3.1 below presents the summary statistics of the major variables in the data base.
Table 3.1 Sample average* of the major variables in the data base
Country income level in terms Motorization GNP per capita Urbanization Population
of GNP per capita (vehicles per 1,000 (1993 US$) (% of urban density per
(1993 US$)** population) population) square kilometer
Low (Less than $725) 11 318 25 82
Lower middle ($725 -$2,895) 36 1,124 46 55
Upper middle ($2,896 -$8,955) 89 2,318 65 52
High (More than $8,995) 337 9,746 74 121
* Sample average are calculated across all the 50 countries over the entire 25 year (1969-1993) period.
** Country income levels are defined as per the World Bank classification [1994]. Also see the Appendix for the specific
countries in each income level.
Figures 3.1 -3.3 use the 1993 observations for all the fifty countries in the data base to draw the
scatter plots of motorization versus economic development, urbanization and population density, respectively. It should be noted that a scatter plot between motorization and any variable is helpful only in providing a general sense of the relationship of motorization with that variable, since it does not control for the effect of other variables that might influence motorization. For example, the scatter plot between motorization and population density in Figure 3.3 looks ambiguous on first sight. However, if one takes into account that the cluster of data points on the bottom left corner are essentially countries with very low income, then it seems likely that motorization and population density has a negative relationship when controlled for the level of economic development. One way to determine whether that is indeed the case is to use multivariate regression analysis technique to estimate empirically the relationship between motorization and population density by simultaneously controlling for the effect of other pertinent variables that might influence motorization. In fact, that is the approach used in this research to study the long-term relationship between motorization and economic development. The specific empirical models are presented in the next section, and the results of multivariate regression estimates of the models are presented in Section 3.2.