HAL Id: insu-02449485
https://hal-insu.archives-ouvertes.fr/insu-02449485
Submitted on 11 Nov 2020
A New Version of the SOLAR-ISS Spectrum Covering
the 165 – 3000 nm Spectral Region
Mustapha Meftah, Luc Damé, David Bolsée, N. Pereira, M. Snow, M. Weber,
Klaus Bramstedt, T. Hilbig, Gaël Cessateur, M.-Y. Boudjella, et al.
To cite this version:
Mustapha Meftah, Luc Damé, David Bolsée, N. Pereira, M. Snow, et al.. A New Version of the
SOLAR-ISS Spectrum Covering the 165 – 3000 nm Spectral Region. Solar Physics, Springer Verlag,
2020, 295 (2), pp.art.14. �10.1007/s11207-019-1571-y�. �insu-02449485�
DOI: 10.1007/•••••-•••-•••-••••-•
A New Version of the SOLAR-ISS Spectrum
Covering the 165 – 3000 nm Spectral Region
M. Meftah1 · L. Dam´e1 · D. Bols´ee2 ·
N. Pereira2 · M. Snow3 · M. Weber4 ·
K. Bramstedt4 · T. Hilbig4 · G. Cessateur2 ·
M.-Y. Boudjella1,5 · M. Marchand1 ·
F. Lef`evre1 · R. Thi´eblemont1 ·
A. Sarkissian1 · A. Hauchecorne1 ·
P. Keckhut1 · S. Bekki1 ·
c
Springer ••••
Abstract — The accurate measurement of the solar spectrum at the top of the atmosphere and its variability are fundamental inputs for solar physics (Sun modeling), terrestrial atmospheric photochemistry and Earth’s climate (climate’s modeling). These inputs were the prime objective set in 1996 for the SOLAR mission. The SOLAR package represents a set of three solar instruments measuring the total and spectral absolute irradiance from 16 nm to 3088 nm. SOLAR was launched with the European Columbus space laboratory in February 2008 aboard the NASA Space Shuttle Atlantis. SOLAR on the International Space Station (ISS) tracked the Sun until it was decommissioned in February 2017. The SOLar SPECtrum (SOLSPEC) instrument of the SOLAR payload allowed the measurement of solar spectra in the 165 – 3000 nm wavelength range for almost a decade. Until the end of its mission, SOLAR/SOLSPEC was pushed to its limits to test how it was affected by space environmental effects (external thermal factors) and to better calibrate the space-based spectrometer. To that end, a new solar reference spectrum (SOLAR-ISS – V1.1) representative of the 2008 solar minimum was obtained from the measurements made by the SO-LAR/SOLSPEC instrument and its calibrations. The main purpose of this article is to improve the SOLAR-ISS reference spectrum (between 165 and 180 nm in the far ultraviolet, between 216.9 and 226.8 nm in the middle ultraviolet, and
1 LATMOS, UVSQ, Universit´e Paris Saclay, Sorbonne
Universit´e, CNRS, INSU, IPSL, 11 Boulevard d’Alembert,
78280 Guyancourt, France
Email:Mustapha.Meftah@latmos.ipsl.fr
2 Belgian Institute for Space Aeronomy (BIRA-IASB),
Ringlaan 3, B-1180 Brussels, Belgium
3 Laboratory for Atmospheric and Space Physics, University
of Colorado, 3665 Discovery Drive, Boulder, Colorado, USA
4 Institute of Environmental Physics, University of Bremen,
28359 Bremen, Germany
between 2400 and 3000 nm in the near-infrared). SOLAR-ISS has a resolution better than 0.1 nm between 165 and 1000 nm, and 1 nm in the 1000 – 3000 nm wavelength range. Finally, a first comparison is made between the new SOLAR-ISS spectrum (V2.0) and the Total and Spectral solar Irradiance Sensor (TSIS-1) spectrum obtained from its first observations from the ISS. Indeed, the launch of TSIS in December 2017 provides a new light on the absolute determination of the solar spectrum and especially in the infrared region of the spectrum. Keywords: Solar Irradiance; Solar Cycle; SOLAR-ISS (V2.0); TSIS.
1. Introduction
For around 9 years since April 5, 2008 and until February 15, 2017, the SOLar SPECtrum (SOLSPEC) instrument of the SOLAR facility on the International Space Station (ISS) performed accurate measurements of Solar Spectral Irra-diance (SSI) from the far ultraviolet to the mid-infrared (165 – 3000 nm). The
SOLAR/SOLSPEC spectro-radiometer (Thuillier et al., 2009;Bols´ee, 2012) was
designed to work for only 18 months, but was switched off after almost a decade. This performance over time is linked to the fact that the SOLAR/SOLSPEC instrument was improved with the experience and heritage gained from previous space-based missions (Spacelab-1 in 1983, ATLAS-1 in 1992, EURECA between 1992 and 1993, ATLAS-2 in 1993, and ATLAS-3 in November 1994). Thus, the primary objective of the SOLAR mission was the measurement of the solar spec-tral irradiance with the highest possible accuracy, and its variability over time.
Space-based SSI measurements are crucial for solar energy (Gueymard, 2018),
space weather, and our understanding of the Sun-Earth connection as explained
bySnow et al.(2018). Accurate measurements are necessary to better understand
the impact of solar variability on climate (via Earth’s atmospheric photochem-istry), noticeably through the “top-down” mechanism amplifying ultraviolet solar forcing effects on the climate (UV affects stratospheric dynamics and temperatures, altering interplanetary waves and weather patterns both poleward and downward to the lower stratosphere and troposphere regions).
Our objective is to produce a spectral irradiance dataset based on recent LAR/SOLSPEC measurements obtained during the 2008–2017 period. The SO-LAR/SOLSPEC measurements, unique by their large spectral coverage and long time range, are of primary importance. During this period of observation, the only alternative solar spectral irradiance measurements are those from the So-lar Radiation and Climate Experiment (SORCE) satellite in the 0.1 – 2412 nm
wavelength range (Rottman, 2005) and from the Aura Ozone Monitoring
In-strument (OMI) in the 265 – 500 nm wavelength range (Marchenko, DeLand,
and Lean, 2016). Thus, it is highly recommended to have several SSI datasets
from different space-based instruments to verify the accuracy and the con-fidence of the calibrated solar measurements. The main goal of our current studies is to deliver the evolution of the SOLAR/SOLSPEC spectral irradiance during Cycle 24 thanks to revised engineering corrections, improved calibra-tions, and advanced procedures to account for thermal and aging corrections
of SOLAR/SOLSPEC data. A preliminary version of the partial dataset has
already been described in the literature (Meftah et al., 2018), presenting a new
reference solar spectrum for the 2008 solar minimum (SOLAR-ISS – Version 1.1). Above 1500 nm, SOLAR-ISS shows significant differences with other ref-erence spectra such as the ATLAS 3 (0.5 – 2397.51 nm) refref-erence solar spectrum
(Thuillier et al., 2003) and the Solar Irradiance Reference Spectra (Woods et al.,
2009) for the 2008 Whole Heliosphere Interval (WHI 2008; 0.1 – 2400 nm).
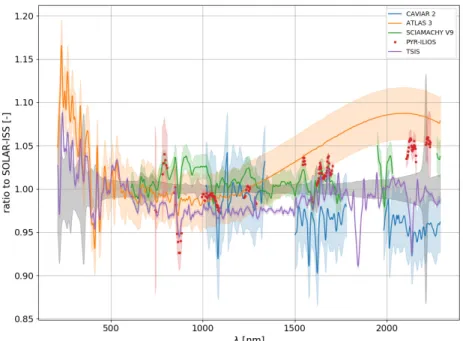
Re-cent studies (Figure 1) are consistent with the SOLAR-ISS spectrum values
above 1500 nm. Indeed, the SOLAR-ISS reference spectrum agrees well with the SCanning Imaging Absorption spectroMeter for Atmospheric
CHartogra-phY (SCIAMACHY; 240 – 2400 nm) solar spectrum (Hilbig et al., 2018) and
recent ground-based measurements obtained during the PYR-ILIOS SSI near infrared (NIR) ground-based campaign made in Mauna Loa Observatory in July
2016 (Pereira et al., 2018). Moreover, the measurement campaign of the
Con-tinuum Absorption in the Visible and Infrared and its Atmospheric Relevance
(CAVIAR 2; 1400 – 2500 nm) project (Elsey et al., 2017) shows a good agreement
with the SOLAR-ISS spectrum, but significant differences from the ATLAS 3
so-lar spectrum (∼7%).Menang(2018) specifies that the rigorous analysis methods
and updated calibrations employed to derive CAVIAR 2 and SOLAR-ISS SSI are strong indicators that these two spectra may be more reliable.
Figure 1. Ratio to SOLAR-ISS (V1.1) for CAVIAR 2, ATLAS 3, SCIAMACHY (V9), PYR-ILIOS, and TSIS. Above 1500 nm, all recent results agree well with the SOLAR-ISS reference spectrum.
With the launch of the Total and Spectral solar Irradiance Sensor (TSIS-1) mission in December 2017, new solar spectral irradiance observations (200 –
af-ter two months of instrument commissioning (Richard et al., 2016; Richard
et al., 2018). These measurements are essential to confirm or not the SOLAR-ISS
spectrum, and particularly above 1500 nm.
The first objective of this article is to provide an improvement of the SOLAR-ISS reference spectrum (from V1.1 to V2.0). There are modifications in the UV part of the solar spectrum in the 165 – 180 nm spectral region (fit of the SOLAR-ISS spectrum with SOlar Stellar Irradiance Comparison Experiment (SOLSTICE) observations in April 2008) and in the 216.9 – 226.8 nm spectral region (modification of the instrument’s spectral irradiance response). There are also modifications in the NIR between 2400 and 3000 nm (suppression of a few solar lines using another solar model for the high resolution that match better with solar pseudo-transmissions based on observations). The second objective is to make a comparison between SOLAR-ISS (V2.0) and recent SSI observations obtained with TSIS-1. Then, in a part of the UV spectrum (165 – 320 nm), a comparison will be done between SOLAR-ISS and the observations obtained in April 2008 with SOLSTICE (120 – 320 nm) onboard the SORCE satellite.
2. Data & Methods used to obtain the SOLAR-ISS Spectrum 2.1. SOLAR/SOLSPEC Data and General Method
SOLAR/SOLSPEC measured the solar spectrum in the 165 – 3000 nm spectral region. The spectro-radiometer consists of 3 separated double-monochromators that use concave holographic gratings to cover “UV” (165 – 371 nm), “VIS” (285 – 908 nm), and “IR” (646 – 3088 nm) spectral ranges. For each SOLAR/SOLSPEC
double-monochromator (Bols´ee, 2012), we use an instrumental equation (Meftah
et al., 2018) linked with engineering corrections and improved calibrations.
The-ses three instrumental corrections allow to derive the solar spectral irradiance from SOLAR/SOLSPEC raw data. In addition, we have an excellent knowledge of the bandpass (spectral resolution commonly called the slit function) for each SOLAR/SOLSPEC double-monochromator. Therefore, we can obtain a higher
resolution spectrum (SOLAR-ISS) by using the Equation1as explained in more
details inMeftah et al.(2018).
SOLAR-ISS(λ) = SSIHR(λ) × SSISOLSPEC(λ)
SSIHR(λ) ⊗ SFSOLSPEC(λ) (1)
where SSIHR(λ) is the high-resolution solar spectrum (Kurucz and Bell,1995),
SSISOLSPEC(λ) is the SOLAR/SOLSPEC spectrum obtained from its three double-monochromators, SFSOLSPEC(λ) represents the slit functions of the SOLAR/SOLSPEC instrument, and ⊗ denotes the convolution symbol. 2.2. SOLAR/SOLSPEC calibrations and Uncertainty Budget
Before launch of the SOLAR package in February 2008, several characteristics
accurately measured for each spectrometer such as absolute response, linearity,
slit functions (Meftah et al., 2018) & bandpass (full width at half maximum
of the spectral response), dispersion law, spectral scanning stability, instrument scattered light, field of view, etc.
The SOLAR/SOLSPEC absolute response calibration is very important for the absolute determination of the ‘true’ solar spectrum. Between 165 and below 200 nm, this calibration was performed by the BIRA-IASB/LATMOS team in 2007, using a thermal vacuum chamber and deuterium lamps (Cathodeon Nos. V0132 and BR066) calibrated under vacuum in radiant intensity at
Physikalisch-Technische Bundesanstalt (PTB, BESSY II facility, Berlin, Germany) (Bols´ee
et al., 2017). For wavelengths between 200 and 3000 nm, the absolute response
calibration of the SOLAR/SOLSPEC instrument was carried out at PTB using the BB3200pg blackbody source, which is a primary standard for the realization and dissemination of spectral irradiance. The BB3200pg blackbody provides a very stable reference source of known spectral radiance using the Planck’s law. The uncertainty on the SOLAR/SOLSPEC absolute response acts as a source of systematic errors in space and represents the dominant and irreducible contri-bution in the uncertainty budget of the SOLAR/SOLSPEC SSI measurement in
space (Bols´ee et al., 2017). We also developed a range of processing and
correc-tion methods (thermal behavior effects of the instrument), which are described in
detail byBols´ee et al.(2017) andMeftah et al.(2017). These corrections have also
introduced contributions in the uncertainty budget of the SOLAR/SOLSPEC SSI measurement.
The SOLAR-ISS spectrum has a mean absolute uncertainty of ∼1.26% (∼16.9
W m−2) at 1 σ in the 165 – 3000 nm spectral region (Meftah et al., 2018). The
integral of SOLAR-ISS in the 165 – 3000 nm range is between 1344 – 1345 W m−2.
This value assumes the SOLAR-ISS total solar irradiance (TSI) of ∼ 1372.5
W m−2 and estimates the irradiance in the 3 – 100 µm wavelength range at a
value of ∼ 28 W m−2using a model (spectrum of a blackbody at 5772 K,Shapiro
et al. (2010) code for solar irradiance modeling (COSI), Tagirov, Shapiro, and
Schmutz (2017) non-local thermodynamic equilibrium spectral synthesis code
(NESSY), Fontenla and Landi (2018) physical modeling of solar spectral
irra-diance, etc.). It has been established that the TSI value is close to 1361 Wm−2
(Kopp and Lean, 2011; Schmutz et al., 2013; Meftah et al., 2014) and
repre-sents a TSI community-consensus value (Kopp et al., 2018). Thus, the difference
between a TSI of 1361 Wm−2representative of a solar minimum and the
SOLAR-ISS TSI is of the order of 11.5 W m−2. This difference is consistent with the
mean absolute uncertainty of the SOLAR-ISS spectrum. A uniform reduction of ∼0.84% applied to the SOLAR-ISS spectrum in the 165 – 3000 nm range would
match with a TSI of 1361 Wm−2 (outcome of the International Astronomical
Union (IAU) 2015 Resolution B3). However, the SOLAR/SOLSPEC measure-ments uncertainties and the possible errors on the absolute determination of SSI are not the same in the 165 – 3000 nm range. Therefore, we do not recommend
3. SOLAR-ISS (LR) improvements
The SOLAR-ISS spectrum is obtained from the SOLAR/SOLSPEC observa-tions, from which the SSISOLSPEC(λ) spectrum at low resolution (SOLAR-ISS
(LR)) is derived, as explained in Section 2.1. An improvement of the
SOLAR-ISS spectrum requires an improvement of SOLAR-SOLAR-ISS (LR) associated with a very accurate knowledge of the slit functions (SFSOLSPEC(λ)) of the
SO-LAR/SOLSPEC instrument considered to be fully acquired (Meftah et al., 2018).
Solar cycle 24 provides a possibility of inter-comparison of solar spectral irradi-ance for SOLAR/SOLSPEC and SORCE/SOLSTICE instruments, which allows us to consider solar spectrum improvements.
180 200 220 240 260 280 300 [nm] 0.5 0.6 0.7 0.8 0.9 1 1.1 1.2 1.3 1.4 1.5 Ratio
Ratio SOLAR-ISS (LR V1.1)/SOLSTICE (conv.) SOLAR/SOLSPEC uncertainty - calibration with PTB BB SOLAR/SOLSPEC uncertainty - calibration with deuterium lamps
Figure 2. SOLAR-ISS (LR)/SOLSTICE ratio during the same period of observation in April 2008. The magenta curve highlights the absolute uncertainty (1 σ) of the SOLAR-ISS spectrum in the 165 – 200 nm range (calibration with the deuterium lamps calibrated by PTB in vacuum). The red curve represents the absolute uncertainty (1 σ) of the SOLAR-ISS spectrum in the 200 – 310 nm range (calibration with the PTB blackbody (BB)). The SOLAR/SOLSPEC slit functions are used for convolving the SORCE/SOLSTICE spectrum at the SOLAR/SOLSPEC spectral resolution.
Figure 2 shows the ratio between SOLAR-ISS (LR V1.1) and the last version
available of the SORCE/SOLSTICE solar spectrum representative of April 2008 observations. The comparison between SOLAR/ISS and SORCE/SOLSTICE spectra highlights a spectral region (165 – 180 nm) with a significant difference. This comparison shows relative uncertainties against the SORCE/SOLSTICE spectrum of nearly 45% differences in the shortest wavelength region (165 nm). It should be noted that SORCE/SOLSTICE measurements transition from the MUV detector (170 – 320 nm) for wavelengths longward of 180 nm to the FUV detector (115 – 180 nm) for wavelengths shortward of 180 nm. However, other publications using these data do not show evidence of any errors that affect only FUV measurements.
Otherwise, the SOLAR-ISS (LR)/SOLSTICE ratio also highlights a strong irreg-ularities in the Herzberg continuum (216.9 – 226.8 nm), which is also problematic.
Therefore, the SOLAR-ISS (LR V1.1) spectrum (Figure 3) is questionable in these two spectral regions.
Figure 3. Left: Solar spectral irradiance of the two versions of the SOLAR-ISS spectrum in the 165 – 200 nm spectral region. Right: Comparison between the two versions of the SOLAR-ISS spectrum in the 200 – 250 nm spectral region.
3.1. Improvements in the 165 – 180 nm spectral region
Between 165 and 180 nm, the SOLAR-ISS (LR V1.1)/SOLSTICE ratio presents significant differences with values close to 1.45 at 165 nm. Between 165 and 180 nm, the SOLAR/SOLSPEC instrument was not calibrated with the PTB
blackbody (see Section 2.2), whose is tied to radiance standards. Indeed, the
SOLAR/SOLSPEC calibration was done in Laboratory because the PTB black-body is not usable below 200 nm. A deuterium lamp calibrated in PTB and SOLAR/SOLSPEC were set in a vacuum chamber for doing this calibration. The problem of this calibration is related to the fact that the distance Instru-ment/Lamp was very short given the dimensions of the vacuum chamber. The terms of use of the deuterium lamp (V0132, Cathodeon Ltd, United Kingdom) near SOLAR/SOLSPEC may have been inappropriate (scattered light effect). A
contribution could come from a reflection of the emerging beam of this lamp (45o
of divergence) on the walls of the instrument solar internal deflector (length of 90 mm), which is located between the main shutter and the UV pre-slit. Due to this effect, measurements were made between 166 and 245 nm to ensure recovery with the response curve obtained during the PTB blackbody calibration. There-fore, the vacuum response curve established with the deuterium lamp was cor-rected by a multiplicative factor equal to 1/0.852 given by the 200 – 245 nm over-lapping region of the two calibrations (PTB blackbody and laboratory calibra-tion in vacuum). This correccalibra-tion for the 165 – 200 nm absolute response is ques-tionable and particularly for wavelengths which are far away from 200 nm. Con-sequently, it is realistic to envisage that a difference related to a spectral depen-dence was not taken into account during the SOLAR/SOLSPEC calibration in vacuum chamber for wavelengths below 200 nm. Moreover, additional sources of
errors may also have been omitted in the methodology used for obtaining the
SO-LAR/SOLSPEC spectrum in the “UV” range (Meftah et al., 2016). Therefore, it
seems reasonable to fit the SOLAR-ISS spectrum with SORCE/SOLSTICE for wavelengths below 180 nm because this is the only source of measurement avail-able at the same date of observation. This adjustment is justified if we consider that the measurement uncertainty of SORCE/SOLSTICE is reliable, and that no other additional errors could be accounted for SORCE/SOLSTICE wavelengths between 165 and 180 nm. This is the case because the SORCE/SOLSTICE instrument was designed to have an absolute accuracy of 5% (in the entire wavelength range) with a relative accuracy of 0.5% per year to determine SSI
dur-ing a 5-year nominal mission (McClintock, Rottman, and Woods, 2005).Snow,
McClintock, and Woods(2010) show comparisons between SORCE/SOLSTICE
and Upper Atmosphere Research Satellite (UARS) SOLSTICE data that help establish the accuracy of the SORCE/SOLSTICE measurements (the degrada-tion correcdegrada-tion for both SOLSTICE instruments is on the order of 0.5% per
year). For the SORCE/SOLSTICE far UV channel (data access: http://lasp.
colorado.edu/home/sorce/data/), the uncertainties are a combination of
instru-mental and statistical factors, as well as solar variability. In April 2008, the SSI SORCE/SOLSTICE absolute uncertainties are close to 3.3% at 1 σ in the
165 – 180 nm spectral region. As shown in Figure 2, measurements made by
the SOLAR/SOLSPEC instrument are outside the uncertainty margins of the SORCE/SOLSTICE instrument in the 165 – 180 nm.
Then, an improvement in UV seems necessary to consolidate
SOLAR-ISS for wavelengths between 165 and 180 nm. Figure 3 (Left) shows
the difference between the two versions of the SOLAR-ISS spectrum in the 165 – 180 nm spectral region. For the new version of the SOLAR-ISS spectrum (V2.0), no uncertainty is associated in the 165 – 180 nm spectral region since we fit our data with SORCE/SOLSTICE. A future work (SOLAR/SOLSPEC UV spectrum, calibration, etc.) is required to understand the differences observed between SOLAR-ISS
and SORCE/SOLSTICE in this spectral region (Figure 2).
3.2. Improvements in the 216.9 – 226.8 nm spectral region
Beyond 200 nm and up to 320 nm, the SOLAR-ISS/SOLSTICE ratio remains in the margins of uncertainty both of SOLAR-ISS and the SORCE/SOLSTICE
spectrum (Figure2). However, irregularities between the SOLAR-ISS spectrum
and the SORCE/SOLSTICE spectrum are observed in Figure2, particularly in
the 216.9 – 226.8 nm range.
The SOLAR-ISS/SOLSTICE ratio irregularity starting at 216.9 nm is related to the SOLAR/SOLSPEC calibration method. From 200 nm, the absolute response calibration of the SOLAR/SOLSPEC instrument was carried out with the PTB blackbody and reinforced by the use of the D2 EF159 deuterium lamp (cali-brated itself with the PTB blackbody). For the PTB calibration between 200 and 216.6 nm, no attenuation optical filter was used between the exit slit and the SOLAR/SOLSPEC “UV” photomultiplier detector. From this calibration,
calibration, a SOLAR/SOLSPEC actuator allowed us to add an attenuation optical filter between the exit slit and the “UV” photomultiplier detector. The purpose of this attenuation optical filter was to limit the number of counts per second on the SOLAR/SOLSPEC photomultiplier; it was requested to not
exceed 105 counts per second during a solar measurement to limit the effects
of the photomultiplier non-linearity (LATMOS heritage). From the calibration with the attenuation optical filter, the R2 response curve was obtained
(Fig-ure 4). The two SOLAR/SOLSPEC response curves (R1 & R2) highlight the
transition region between 216.6 and 216.9 nm. Close to 216.9 nm, the signal-to-noise ratio is weak due to the SOLAR/SOLSPEC attenuation optical filter, which results in increasing the measurement uncertainty in the 216.9 – 226.8 nm
spectral region (Figure2). The irregularity in the 216.9 – 226.8 nm range is linked
with the use of the SOLAR/SOLSPEC attenuation optical filter when switch-ing to 216.9 nm. Therefore, a SOLAR-ISS improvement in the 216.9 – 226.8 nm range is required by fitting SOLAR-ISS with SORCE/SOLSTICE data during the same period of observation in April 2008. This approach seems reasonable given the good agreement between datasets (differences less than 4%, no spectral
dependence) seen in Figure 2for the rest of the 180 – 250 nm region. The TSIS
observations bring a new light to confirm that the signature of the SOLAR-ISS/TSIS ratio in the 216.9 – 226.8 nm range is similar to that obtained with the SOLAR-ISS/SOLSTICE ratio. 180 200 220 240 260 280 300 320 [nm] 10-4 10-3 10-2 10-1 Response [mW.m -2 .nm -1.counts -1.s] R1 R2 216.9 nm R2 R1
Figure 4. The blue curve corresponds to the SOLAR/SOLSPEC absolute response (R1) in the 165 – 216.6 nm range. The red curve corresponds to the SOLAR/SOLSPEC absolute response (R2) in the 216.9 – 320 nm range.
The SOLAR-ISS improvement in the 216.9 – 226.8 nm is important because it corresponds to a spectral region that is included in the Herzberg continuum (200 – 242 nm). In this region, atmospheric absorption is relatively low and hence solar UV radiation penetrates deeply in the atmosphere, down to the lower
stratosphere, where it photolysis molecular oxygen (O2) to produce ozone (O3).
Absolute solar spectral irradiance and variability in the Herzberg continuum are necessary to better understand the stratospheric ozone response to solar
to the study of fundamental physical and chemical processes governing the terrestrial and planetary atmospheres require an absolute accurate knowledge of the solar spectral irradiance (SSI(λ)). This is the case in the study of the Mars atmosphere with the Spectroscopy for Investigation of Characteristics
of the Atmosphere of Mars (SPICAM) instrument (Montmessin et al., 2017).
This instrument made resolved measurements of the planet radiance factor (Rad(λ) = B(λ)/SSI(λ)) to derive key parameters (albedo, ozone, dust, etc.). In these studies, a decrease in the absolute level of the UV solar irradiance causes a decrease of ozone and dusts while the observed albedo of Mars increases. In addition, the irregularities in the UV spectrum like those observed in the SOLAR/SOLSTICE ratio (in the 216.9 – 226.8 nm spectral region), can have an impact on the radiance results.
To conclude, an improvement was made in the SOLAR-ISS spectrum (V2.0) to constrain the irregularity in the 216.9 – 226.8 nm range
(Fig-ure2). Figure3(Right) shows the difference between the two versions
of the SOLAR-ISS spectrum between 216.9 nm and 226.8 nm.
4. SOLAR-ISS improvements in the NIR
As given in Equation1, the SOLAR-ISS reference spectrum (V1.1) is obtained
by combining the SOLAR/SOLSPEC measured spectrum (SOLAR-ISS (LR))
with reference solar spectra at high spectral resolution (Kurucz and Bellsolar
spectrum (1995) from 165 to 2400 nm, and Solar Radiation Physical Modeling
(SRPM) theoretical model (Fontenla, Stancil, and Landi, 2015) from 2400 to
3000 nm).
To improve SOLAR-ISS (V1.1), it is necessary to compare it with high-resolution observations such as solar pseudo-transmissions. For comparisons with observed solar pseudo-transmissions, we remove the SOLAR-ISS (V1.1) data trend in the 2400 – 3000 nm spectral region using a low-order polynomial fit to obtain an
equivalent SOLAR-ISS (V1.1) pseudo-transmission as shown in Figure5(Top).
Figure 5 shows the solar pseudo-transmissions obtained with the Atmospheric
Chemistry Experiment Fourier Transform Spectrometer (ACE-FTS) onboard a Canadian satellite designed to make observations of the Earth’s atmosphere (SCISAT). The ACE-FTS instrument has a very high spectral resolution of
0.02 cm−1and operates from 2.27 to 13.33 µm (750-4400 cm−1) using a Michelson
interferometer (Chateauneuf et al., 2002;Soucy et al., 2002). Figure5also shows
the Solar Pseudo-Transmittance Spectrum (SPTS) obtained by Toon (2017).
The derived SPTS (with a solar disk-integrated spectrum) was computed using
various recent versions of the solar line-list. SPTS (Toon, 2017) covers the 0.38 –
16.67 µm (600 to 26316 cm−1) spectral region.
Between 2400 and 3000 nm, the comparisons between SOLAR-ISS (V1.1) and solar pseudo-transmissions (ACE-FTS and SPTS) show few abnormal solar lines
in the SOLAR-ISS spectrum (V1.1) as shown in Figure 5 (Top). These solar
features (2431.3, 2448.9, 2469.9, 2495.3, 2526.1, 2564.3, 2612.7, 2675.1, 2758.3, 2872.9 nm) are too deep to be resolved with the SOLAR-ISS spectral resolution. Consequently, the SOLAR-ISS spectrum requires an improvement
in the NIR using the high-resolutionKurucz and Bell(1995) data in the 2400 – 3000 nm spectral region. 2400 2500 2600 2700 2800 2900 3000 [nm] 0.85 0.9 0.95 1 1.05 1.1
Solar pseudo-transmittance spectrum
SOLAR-ISS (V1.1) - Detrended
ACE-FTS (convolution with a Gaussian slit function - FWHM = 1 nm) SPTS (convolution with a Gaussian slit function - FWHM = 1 nm)
2400 2500 2600 2700 2800 2900 3000 [nm] 0.85 0.9 0.95 1 1.05 1.1
Solar pseudo-transmittance spectrum
SOLAR-ISS (V2.0) - Detrended
ACE-FTS (convolution with a Gaussian slit function - FWHM = 1 nm) SPTS (convolution with a Gaussian slit function - FWHM = 1 nm)
Figure 5. Top: Detrended SOLAR-ISS spectrum (V1.1) with a low-order polynomial fit and solar pseudo transmittances (ACE-FTS and SPTS) in the 2400 – 3000 nm spectral region. Bottom: Detrended SOLAR-ISS spectrum (V2.0) with a low-order polynomial fit and solar pseudo transmittances (ACE-FTS and SPTS) in the 2400 – 3000 nm spectral region.
5. Results & Discussion
SOLAR/SOLSPEC observations cover almost the full solar cycle 24. We pro-vided a traceable reference solar spectrum representative of the 2008 solar mini-mum (SOLAR-ISS – V1.1) using the SOLAR/SOLSPEC data thanks to revised engineering corrections, improved calibrations, and advanced procedures to ac-count for thermal and aging corrections of the instrument. The new version of the SOLAR-ISS reference spectrum (V2.0) is presented in this section with all its improvements. A comparison between SOLAR-ISS (V2.0) and the new TSIS
solar data is also made (Figure 6, Left), which represents a significant step in
our quest for the determination of the ‘true’ solar spectrum. For this analysis, there is no adjustment between SOLAR-ISS (V2.0) and TSIS solar data, despite the fact that the comparison between these two datasets does not use coincident measurements.
For a given spectral region, other comparisons are made with other spectra from measurements (ATLAS 3, SORCE/SOLSTICE) and some models (Spectral And Total Irradiance REconstruction for the Satellite Era (SATIRE-S), Naval
200 500 1000 2000 3000 [nm] 0.8 0.85 0.9 0.95 1 1.05 1.1 1.15 1.2 Ratio
Ratio SOLAR-ISS (LR V2.0)/TSIS Smoothed data using the 'loess' method
200 500 1000 2000 3000 [nm] 0.8 0.85 0.9 0.95 1 1.05 1.1 1.15 1.2 Ratio
Ratio SOLAR-ISS (LR V2.0)/SATIRE-S Ratio SOLAR-ISS (LR V2.0)/NRLSSI
Figure 6. Left: Ratio to SOLAR-ISS (V2.0) for TSIS. Right: Ratio to SOLAR-ISS (V2.0) for SATIRE-S and NRL-SSI. We also observe that the correlations between the models (SATIRE-S and NRL-SSI) and TSIS are excellent.
Research Laboratory Solar Spectral Irradiance (NRL-SSI)). Coddington et al.
(2018) paper provides, among other things, a comparison between more models
(last version of the NRL-SSI2 modeled irradiance (Version 2), Solar Irradiance Data Exploitation (SOLID), SATIRE-S, a three-dimensional extension of the SATIRE-S model (SATIRE-3D), and Empirical Irradiance Reconstruction (EM-PIRE)). In our case, we limit our comparisons with SATIRE-S and NRL-SSI
(Figure6, Right), which are well established models. We also did not focus on the
revised solar spectral irradiance as measured by the Spectral Irradiance Monitor
(SIM) instrument on board SORCE (Mauceri et al., 2018) because these results
remain close to those proposed by models (SATIRE-S and NRL-SSI (V2)). SIM SSI (revised version) shows a good agreement with the SATIRE-S and NRL-SSI (V2) solar models within measurements uncertainties.
180 200 220 240 260 280 300 [nm] 0.8 0.85 0.9 0.95 1 1.05 1.1 1.15 1.2 Ratio
Ratio SOLAR-ISS (LR V2.0)/SOLSTICE (conv.) Ratio SOLAR-ISS (LR V2.0)/TSIS (conv.)
Figure 7. Ratio to SOLAR-ISS (V2.0) for SORCE/SOLSTICE (blue curve) and TSIS (red
curve). These ratios are based on comparison between existing extraterrestrial solar spectra based on observations (SOLAR-ISS (April 2008), SORCE/SOLSTICE (April 2008), TSIS (March 2018 to March 2019)). The black dashed lines show the uncertainties at ±3%.
Figure 7 shows a comparison between the SOLAR-ISS (V2.0) spectrum, the SORCE/SOLSTICE spectrum and the TSIS spectrum in the 165 – 300 nm
spec-tral region. Differences appear between the three spectra. Figure 7 shows the
good agreement between SOLAR-ISS data and SORCE/SOLSTICE data with a difference that, generally, does not exceed ±3%. However, there is broad spectral structure with width ∼20 nm between 220 – 300 nm in both the SOLAR-ISS/SOLSTICE ratio (blue) and the SOLAR-ISS/TSIS ratio (red). This simi-larity could indicate wavelength-dependent issues at the ∼5% peak-to-peak level in the SOLAR-ISS calibration.
Between SOLAR-ISS and TSIS, differences are much larger. The solar spectral irradiance values measured by TSIS are generally higher than those proposed in SOLAR-ISS. We can not really conclude since these two spectra are obtained at different periods. These evolutions will nevertheless be the subject of a future discussion since these two spectra are associated with a solar minima. If the difference is real, this could imply that the solar minima are not at the same level involving a decrease or increase from one cycle to another one.
Although the SORCE/SOLSTICE and TSIS data both represent solar minimum conditions, it should be noted that the SORCE/SOLSTICE measurements occur ∼5 years after the launch of SORCE, so the accuracy of the SORCE/SOLSTICE time-dependent calibration is a relevant factor. The quoted SORCE/SOLSTICE uncertainty of 0.5%/year would represent a 2.5% cumulative uncertainty at the
time of these measurements. A recent paper by DeLand et al. (2019) shows
that SORCE/SOLSTICE irradiances at 230 – 235 nm may be a few percent low by mid-2007 (their Figure 6). Increasing SOLSTICE irradiance values in this
spectral region would lower the blue curve in Figure7, and thus could bring the
SOLAR-ISS/SOLSTICE and SOLAR-ISS/TSIS comparisons closer together. In the visible spectrum (380 – 780 nm) and in a part of the near infrared (780 – 2400 nm), the solar spectral irradiance are identical in Versions 1.1 and 2.0 of the
SOLAR-ISS reference spectrum. Between 380 nm and ∼2400 nm, Figure6(Left)
shows the excellent agreement between SOLAR-ISS and TSIS with a difference
that does not exceed ±3%. Figure6(Right) shows a similar conclusion between
SOLAR-ISS and the solar models (SATIRE-S and NRL-SSI).
The SOLAR-ISS spectrum is very consistent with TSIS and solar models in the 380 – 2400 nm spectral region. TSIS mostly confirms the SOLAR-ISS spectrum
values above 1500 nm. Figure 8 shows the brightness temperature of the Sun
obtained for ATLAS 3, SOLAR-ISS (V2.0), and TSIS. Data of these three solar spectra are used to derive the brightness temperature of the Sun as a function of wavelength. This allows to better visualize the differences between the three solar spectra in the 380 – 2400 nm spectral region. Despite different periods of observation of these three solar spectra, it is possible to directly compare them because the solar variability in the 380 – 2400 nm spectral region is small during a solar cycle and much smaller than the uncertainties of the instruments. The main spectral region of disagreement between SOLAR-ISS (V2.0) and ATLAS 3 is clearly visible around 1640 nm, where the solar atmosphere radiative opacity reaches its absolute minimum (in the photosphere at T ∼ 6400 K, the principal
source of opacity is the H− ion where the free-bound process has its edge).
the SOLAR/SOLSPEC spectro-radiometer with very slight differences. TSIS
observations are also consistent with all recent results (Elsey et al., 2017;Hilbig
et al., 2018; Pereira et al., 2018).
500 1000 1500 2000 2500 3000 [nm] 4600 4800 5000 5200 5400 5600 5800 6000 6200 6400 6600 Temperature [K] ATLAS 3 SOLAR-ISS (V2.0)
TSIS (mean values from March 2018 to March 2019)
Figure 8. Brightness temperature of the Sun obtained from the ATLAS 3 (period: November 1994) solar spectrum data plot (red curve), SOLAR-ISS (period: April 2008) spectrum data (blue curve) and TSIS (period: March 2018 to March 2019) spectrum data (black curve).
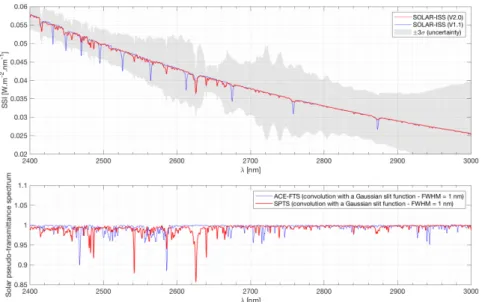
Figure 9. Top: Solar irradiance in the 2400 – 3000 nm spectral region of SOLAR-ISS (V2.0) shown in the red curve and SOLAR-ISS (V1.1) shown in the blue curve. The uncertainties are shown with the gray shaded curves. Bottom: Solar pseudo transmittance in the 2400 – 3000 nm spectral region of ACE-FTS and SPTS. The two sets of data are convolved with a Gaussian slit function, which has a full width at half maximum (FWHM) of 1 nm.
Figure9(Top) highlights the differences between the two versions of the
SOLAR-ISS spectrum (Section 4). In SOLAR-ISS (V1.1), above 2400 nm, we used the
SRPM theoretical model (with a resolution of 1 nm) fromFontenla, Stancil, and
Landi(2015). In SOLAR-ISS (V2.0), we fall back on theKurucz and Bell(1995)
studies. Then, the improvement in SOLAR-ISS (V2.0) between 2400 – 3000 nm
is due to the use of the high-resolutionKurucz and Bell(1995) data.
The upgrade of the SOLAR-ISS spectrum above 2400 nm is related to the fact that we had deep abnormal solar lines in the version 1.1. Comparing with ACE-FTS and SPTS solar pseudo transmittances in the 2400 – 3000 nm spectral region
shown in Figure9(Bottom), we see that these solar lines (2431.3, 2448.9, 2469.9,
2495.3, 2526.1, 2564.3, 2612.7, 2675.1, 2758.3, 2872.9 nm) do not exist or are less deep. Between 2400 and 3000 nm, SOLAR-ISS spectra have a resolution of 1 nm. To be able to directly compare all data (SOLAR-ISS, ACE-FTS and SPTS), ACE-FTS and SPTS solar pseudo transmittances have been convolved with Gaussian slit functions, which allow to have the same resolution as the SOLAR-ISS spectrum.
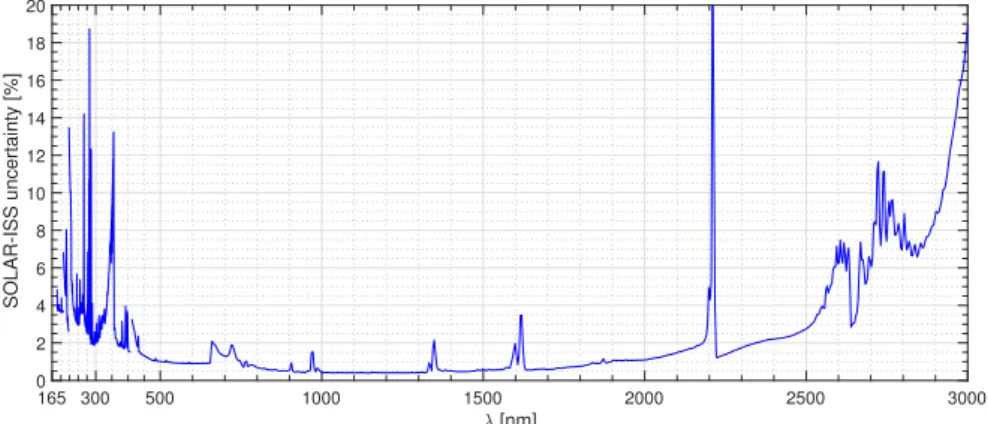
Figure10presents the spectral dependence of the uncertainty for the SOLAR-ISS
reference spectrum. These uncertainties are mainly derived from
ground-based calibrations performed with the PTB blackbody (Meftah et al.,
2018). They are also obtained from on-board diagnostics (flight
cali-brations) based on data temperature corrections (Meftah et al., 2017).
Causes of the limitations are related to the fact that the radiomet-ric responsivity of each SOLAR/SOLSPEC double-monochromator is considered as identical between pre-flight calibrations and first light in orbit. 165 300 500 1000 1500 2000 2500 3000 [nm] 0 2 4 6 8 10 12 14 16 18 20 SOLAR-ISS uncertainty [%]
Figure 10. SOLAR-ISS uncertainties at 1 σ for all spectral regions.
6. Conclusions
SOLAR-ISS is the first solar spectrum obtained outside the atmosphere over a wavelength range of 165 to 3000 nm with a low level of uncertainty. The SOLAR-ISS spectrum that is representative of the 2008 solar minimum challenged older
solar reference spectra (ATLAS 3, WHI 2008), particularly in the near infrared above 1500 nm. In this article, we propose a new version of the SOLAR-ISS spectrum (V2.0), where all the new corrections are described. SOLAR-ISS (V2.0) is compared with a new solar spectral irradiance dataset obtained thanks to the NASA TSIS-1 mission, which was deployed on the International Space Station in December 2017. First analysis between SOLAR-ISS and TSIS shows an excellent agreement between SOLAR-ISS and TSIS spectra with a difference that is not exceeding ±3% in the 380 – 2400 nm spectral region. The TSIS measurements show an excellent agreement with the SOLAR-ISS spectrum for mostly all wave-lengths above 1500 nm. TSIS is consistent with the SOLAR-ISS spectrum such as all recent results of the SSI in the near infrared (CAVIAR 2, SCIAMACHY (V9), PYR-ILIOS).
The SOLAR-ISS (V2.0) spectrum is available at the Centre de Donn´ees
as-tronomiques de Strasbourg (CDS).
Acknowledgements The SOLAR/SOLSPEC team acknowledges the support from
Eu-ropean Space Agency (ESA), Centre National d’ ´Etudes Spatiales (CNES, France), Centre
National de la Recherche Scientifique (CNRS, France), the Programme National Soleil-Terre (PNST) from the Institut National des Sciences de l’Univers (INSU, France), the PROgramme de D´eveloppement d’Exp´eriences scientifiques Office (PRODEX, Belgium), the Belgian Federal Science Policy Office (BELSPO) through the ESA–PRODEX program and LASP (USA).
The LATMOS team gratefully acknowledges Kader Amsif (CNES), Fran¸cois Buisson (CNES),
Denis Jouglet (CNES) and Fran¸cois Leblanc (CNRS) for their support in the implementation
of a new solar reference spectrum. T. Hilbig, K. Bramstedt, and M. Weber acknowledge the
support from Bundesministerium f¨ur Forschung und Technologie (Germany) via the SCIASOL
project as part of the priority program ROMIC (Role of the Middle Atmosphere in Climate). The authors wish to thank the anonymous referees for the very useful comments, which improve the quality of the manuscript.
References
Bols´ee, D.: 2012, M´etrologie de la spectrophotom´etrie solaire absolue: principes, mise en oeuvre et r´esultats ; instrument solspec `a bord de la station spatiale internationale (unpublished doctoral dissertation). PhD thesis, Universit´e libre, ´Ecole polytechnique de Bruxelles.
Bols´ee, D., Pereira, N., Gillotay, D., Pandey, P., Cessateur, G., Foujols, T., Bekki, S.,
Hauchecorne, A., Meftah, M., Dam´e, L., Hers´e, M., Michel, A., Jacobs, C., Sela, A.: 2017, SOLAR/SOLSPEC mission on ISS: In-flight performance for SSI measurements in the UV.
Astron. Astrophys. 600, A21. doi:10.1051/0004-6361/201628234.
Brasseur, G.P., Solomon, S.: 2005, Aeronomy of the Middle Atmosphere: Chemistry and Physics of the Stratosphere and Mesosphere, 3rd.
Chateauneuf, F., Soucy, M.-A.A., Deutsch, C., Blanchard, N., Giroux, J.G.: 2002, Recent developments on the ACE-FTS instrument. In: Strojnik, M., Andresen, B.F. (eds.) Infrared
Spaceborne Remote Sensing IX, Proc. SPIE 4486, 393 – 402. doi:10.1117/12.455122.
Coddington, O., Lean, J., Pilewskie, P., Snow, M.A., Kopp, G., Richard, E.C., Woods, T.N., DeLand, M.T., Marchenko, S.V.: 2018, A Comparative Assessment of Solar Irradiance Observations and Models at the Dawn of TSIS. AGU Fall Meeting Abstracts.
DeLand, M.T., Floyd, L.E., Marchenko, S., Tiruchirapalli, R.: 2019, Creation of the GSFCSSI2 Composite Solar Spectral Irradiance Data Set. Earth and Space Science 6(7), 1284 – 1298. doi:10.1029/2019EA000616.
Elsey, J., Coleman, M.D., Gardiner, T., Shine, K.P.: 2017, Can Measurements of the Near-Infrared Solar Spectral Irradiance be Reconciled? A New Ground-Based Assessment
Between 4,000 and 10,000 cm−1. Geophys. Res. Lett. 44, 10. doi:10.1002/2017GL073902.
Fontenla, J.M., Landi, E.: 2018, Bright Network, UVA, and the Physical Modeling of
So-lar Spectral and Total Irradiance in Recent SoSo-lar Cycles. Astrophys. J. 861, 120.
doi:10.3847/1538-4357/aac388.
Fontenla, J.M., Stancil, P.C., Landi, E.: 2015, Solar Spectral Irradiance, Solar Activity, and
the Near-Ultra-Violet. Astrophys. J. 809, 157. doi:10.1088/0004-637X/809/2/157.
Gueymard, C.A.: 2018, Revised composite extraterrestrial spectrum based on recent solar irradiance observations. Solar Energy 169, 434 – 440. doi:10.1016/j.solener.2018.04.067.
Hilbig, T., Weber, M., Bramstedt, K., No¨el, S., Burrows, J.P., Krijger, J.M., Snel, R.,
Meftah, M., Dam´e, L., Bekki, S., Bols´ee, D., Pereira, N., Sluse, D.: 2018, The New
SCIAMACHY Reference Solar Spectral Irradiance and Its Validation. Solar Phys. 293, 121. doi:10.1007/s11207-018-1339-9.
Kopp, G., Lean, J.L.: 2011, A new, lower value of total solar irradiance: Evidence and climate significance. Geophys. Res. Lett. 38, 1706. doi:10.1029/2010GL045777.
Kopp, G., Dudok de Wit, T., Ball, W.T., Finsterle, W., Frohlich, C., Kokkonen, K., Meftah, M., Schmutz, W.K.: 2018, The New “Community-Consensus TSI Composite” for Solar and Climate Researchers. AGU Fall Meeting Abstracts.
Kurucz, R.L., Bell, B.: 1995, Atomic line list.
Marchenko, S.V., DeLand, M.T., Lean, J.L.: 2016, Solar spectral irradiance variabil-ity in cycle 24: observations and models. J. Space Weather Space Clim. 6, A40. doi:10.1051/swsc/2016036. https://doi.org/10.1051/swsc/2016036.
Mauceri, S., Pilewskie, P., Richard, E., Coddington, O., Harder, J., Woods, T.: 2018, Revision of the Sun’s Spectral Irradiance as Measured by SORCE SIM. Solar Phys. 293, 161. doi:10.1007/s11207-018-1379-1.
McClintock, W.E., Rottman, G.J., Woods, T.N.: 2005, Solar-Stellar Irradiance Comparison Experiment II (Solstice II): Instrument Concept and Design. Solar Phys. 230, 225 – 258. doi:10.1007/s11207-005-7432-x.
Meftah, M., Dewitte, S., Irbah, A., Chevalier, A., Conscience, C., Crommelynck, D., Janssen, E., Mekaoui, S.: 2014, SOVAP/ Picard, a Spaceborne Radiometer to Measure the Total Solar Irradiance. Solar Phys. 289, 1885 – 1899. doi:10.1007/s11207-013-0443-0.
Meftah, M., Bols´ee, D., Dam´e, L., Hauchecorne, A., Pereira, N., Irbah, A., Bekki, S., Cessateur, G., Foujols, T., Thi´eblemont, R.: 2016, Solar Irradiance from 165 to 400 nm in 2008 and UV Variations in Three Spectral Bands During Solar Cycle 24. Solar Phys. 291, 3527 – 3547. doi:10.1007/s11207-016-0997-8.
Meftah, M., Dam´e, L., Bols´ee, D., Pereira, N., Sluse, D., Cessateur, G., Irbah, A., Sarkissian, A., Djafer, D., Hauchecorne, A., Bekki, S.: 2017, A New Solar Spectrum from 656 to 3088
nm. Solar Phys. 292(8), 101. doi:10.1007/s11207-017-1115-2.
Meftah, M., Dam´e, L., Bols´ee, D., Hauchecorne, A., Pereira, N., Sluse, D., Cessateur, G.,
Irbah, A., Bureau, J., Weber, M., Bramstedt, K., Hilbig, T., Thi´eblemont, R., Marchand,
M., Lef`evre, F., Sarkissian, A., Bekki, S.: 2018, SOLAR-ISS: A new reference spectrum
based on SOLAR/SOLSPEC observations. Astron. Astrophys. 611, A1. doi:
10.1051/0004-6361/201731316.
Menang, K.P.: 2018, Assessment of the Impact of Solar Spectral Irradiance on Near-Infrared Clear-Sky Atmospheric Absorption and Heating Rates. Journal of Geophysical Research
(Atmospheres) 123, 6460 – 6468. doi:10.1029/2018JD028342.
Montmessin, F., Korablev, O., Lef`evre, F., Bertaux, J.-L., Fedorova, A., Trokhimovskiy, A., Chaufray, J.Y., Lacombe, G., Reberac, A., Maltagliati, L., Willame, Y., Guslyakova, S., G´erard, J.-C., Stiepen, A., Fussen, D., Mateshvili, N., M¨a¨att¨anen, A., Forget, F., Witasse, O., Leblanc, F., Vandaele, A.C., Marcq, E., Sandel, B., Gondet, B., Schneider, N., Chaffin, M., Chapron, N.: 2017, SPICAM on Mars Express: A 10 year in-depth survey of the Martian atmosphere. Icarus Journal 297, 195 – 216. doi:10.1016/j.icarus.2017.06.022. Pereira, N., Bols´ee, D., Sperfeld, P., Pape, S., Sluse, D., Cessateur, G.: 2018, Metrology of solar
spectral irradiance at the top of the atmosphere in the near infrared measured at Mauna Loa Observatory: the PYR-ILIOS campaign. Atmospheric Measurement Techniques 11, 6605 – 6615. doi:10.5194/amt-11-6605-2018.
Richard, E.C., Pilewskie, P., Kopp, G., Coddington, O., Woods, T.N., Wu, D.L.: 2016, Continuing the Solar Irradiance Data Record with TSIS. AGU Fall Meeting Abstracts. Richard, E.C., Harber, D., Coddington, O., Beland, S., Chambliss, M., Mauceri, S., Pilewskie,
Space Station: The TSIS-1 First Light and Early Mission Results. AGU Fall Meeting Abstracts.
Rottman, G.: 2005, The SORCE Mission. Solar Phys. 230, 7 – 25. doi:
10.1007/s11207-005-8112-6.
Schmutz, W., Fehlmann, A., Finsterle, W., Kopp, G., Thuillier, G.: 2013, Total solar ir-radiance measurements with PREMOS/PICARD. In: American Institute of Physics Conference Series, American Institute of Physics Conference Series 1531, 624 – 627. doi:10.1063/1.4804847.
Shapiro, A.I., Schmutz, W., Schoell, M., Haberreiter, M., Rozanov, E.: 2010, NLTE solar
irradiance modeling with the COSI code. Astron. Astrophys. 517, A48. doi:
10.1051/0004-6361/200913987.
Snow, M., McClintock, W.E., Woods, T.N.: 2010, Solar spectral irradiance
vari-ability in the ultraviolet from sorce and uars solstice. Advances in Space
Research 46(3), 296 – 302. doi:https://doi.org/10.1016/j.asr.2010.03.027.
http://www.sciencedirect.com/science/article/pii/S0273117710002322.
Snow, M., Eparvier, F.G., Harder, J., Jones, A.R., McClintock, W.E., Richard, E., Woods, T.N.: 2018, Ultraviolet Solar Spectral Irradiance Variation on Solar Cycle Timescales. In: Banerjee, D., Jiang, J., Kusano, K., Solanki, S. (eds.) IAU Symposium, IAU Symposium
340, 203 – 208. doi:10.1017/S1743921318001278.
Soucy, M.-A.A., Chateauneuf, F., Deutsch, C., Etienne, N.: 2002, ACE-FTS instrument
de-tailed design. In: Barnes, W.L. (ed.) Earth Observing Systems VII, Proc. SPIE 4814,
70 – 81. doi:10.1117/12.451701.
Tagirov, R.V., Shapiro, A.I., Schmutz, W.: 2017, NESSY: NLTE spectral synthesis code
for solar and stellar atmospheres. Astron. Astrophys. 603, A27. doi:
10.1051/0004-6361/201628574.
Thuillier, G., Hers´e, M., Labs, D., Foujols, T., Peetermans, W., Gillotay, D., Simon, P.C.,
Mandel, H.: 2003, The Solar Spectral Irradiance from 200 to 2400 nm as Measured by the SOLSPEC Spectrometer from the Atlas and Eureca Missions. Solar Phys. 214, 1. doi:10.1023/A:1024048429145.
Thuillier, G., Foujols, T., Bols´ee, D., Gillotay, D., Hers´e, M., Peetermans, W., Decuyper, W., Mandel, H., Sperfeld, P., Pape, S., Taubert, D.R., Hartmann, J.: 2009, SOLAR/SOLSPEC: Scientific Objectives, Instrument Performance and Its Absolute Calibration Using a
Blackbody as Primary Standard Source. Solar Phys. 257, 185 – 213. doi:
10.1007/s11207-009-9361-6.
Toon, G.C.: 2017, Solar line list for the tccon 2014 data release, CaltechDATA.
doi:10.14291/tccon.ggg2014.solar.r0/1221658.https://data.caltech.edu/records/251. Woods, T.N., Chamberlin, P.C., Harder, J.W., Hock, R.A., Snow, M., Eparvier, F.G.,
Fontenla, J., McClintock, W.E., Richard, E.C.: 2009, Solar Irradiance Reference Spectra (SIRS) for the 2008 Whole Heliosphere Interval (WHI). Geophys. Res. Lett. 36, L01101. doi:10.1029/2008GL036373.