HAL Id: hal-03154115
https://hal.sorbonne-universite.fr/hal-03154115
Submitted on 27 Feb 2021HAL is a multi-disciplinary open access
archive for the deposit and dissemination of sci-entific research documents, whether they are pub-lished or not. The documents may come from teaching and research institutions in France or abroad, or from public or private research centers.
L’archive ouverte pluridisciplinaire HAL, est destinée au dépôt et à la diffusion de documents scientifiques de niveau recherche, publiés ou non, émanant des établissements d’enseignement et de recherche français ou étrangers, des laboratoires publics ou privés.
Gravity and Aeromagnetic Anomalies and Their
Geodynamic Implications
Carlos Aizprua, C. Witt, M. Brönner, S. Johansen, D. Barba, M. Hernandez
To cite this version:
Carlos Aizprua, C. Witt, M. Brönner, S. Johansen, D. Barba, et al.. Forearc Crustal Structure of Ecuador Revealed by Gravity and Aeromagnetic Anomalies and Their Geodynamic Implications. Lithosphere, Geological Society of America, 2020, 2020 (1), pp.2810692. �10.2113/2020/2810692�. �hal-03154115�
Research Article
Forearc Crustal Structure of Ecuador Revealed by Gravity and
Aeromagnetic Anomalies and Their Geodynamic Implications
Carlos Aizprua
,
1,2,3C. Witt,
2M. Brönner,
1,4S. E. Johansen,
1D. Barba,
5and M. J. Hernandez
6,71Department of Geoscience and Petroleum, Norwegian University of Science and Technology (NTNU), S.P. Andersens Veg 15a,
7491 Trondheim, Norway
2Univ. Lille, CNRS, Univ. Littoral Côte d’Opale, UMR 8187, LOG (Laboratoire d’Océanologie et de Géosciences), F 59000 Lille, France 3Facultad de Ingeniería en Ciencias de la Tierra, Escuela Superior Politécnica del Litoral, Campus Gustavo Galindo, Km 30.5
Vía Perimetral, Guayaquil, Ecuador
4Geological Survey of Norway (NGU), Leiv Eirikssons Vei 39, 7040 Trondheim, Norway
5Petroamazonas EP, Av. 6 de Diciembre N34-290 y Gaspar Cañero, Edificio Villafuerte, Quito, Ecuador
6Université Côte d’Azur, IRD (Institut de Recherche Pour Le Développement), Sorbonne Université, Centre National de la Recherche
Scientifique (CNRS), Observatoire de la Côte d’Azur, GEOAZUR (Laboratoire de Géoazur), 06560 Valbonne, France
7Departamento de Geología, Escuela Politécnica Nacional, Quito, Ecuador
Correspondence should be addressed to Carlos Aizprua; calun@equinor.com Received 28 January 2020; Accepted 5 October 2020; Published 16 November 2020 Academic Editor: Andrea Billi
Copyright © 2020 Carlos Aizprua et al. This is an open access article distributed under the Creative Commons Attribution License, which permits unrestricted use, distribution, and reproduction in any medium, provided the original work is properly cited. Along the Western Cordillera of Ecuador, fault-bounded ophiolites derived from the Late Cretaceous Caribbean Large Igneous Province (CLIP) have provided key petrotectonic indicators that outline the nature and the mechanism of continental growth in this region. However, most of the forearc basement across Western Ecuador is buried under sediments impairing its crustal structure understanding. Here, we propose afirst crustal model throughout the spectral analysis of gravity and aeromagnetic data, constrained by observations made both at the surface and at the subsurface. Three main geophysical domains, within the North Andean Sliver in Western Ecuador, have been defined based on spectral analysis and augmented by 2D forward models. An outer domain, characterized by magnetic anomalies associated with mafic rocks, coincides with evidence of a split intraoceanic arc system. An inner domain is governed by long-wavelength mid to deep crust-sourced gravity and magnetic anomalies possibly evidencing the root of a paleoisland arc and the residuum of a partial melting event with subsequent associated serpentinization, the latest possibly associated with an obduction process during the middle Eocene-Oligocene. In addition, our model supports the presence of a lithospheric vertical tear fault, herein the southern suture domain, inherited from an oblique arc-continent interaction. Our interpretation also brings new insights and constraints on the early geodynamic evolution of the Ecuadorian forearc and provides evidence on the structural style and preservation potential of the forearc basement, most likely the roots of a mature island arc built within an oceanic plateau.
1. Introduction
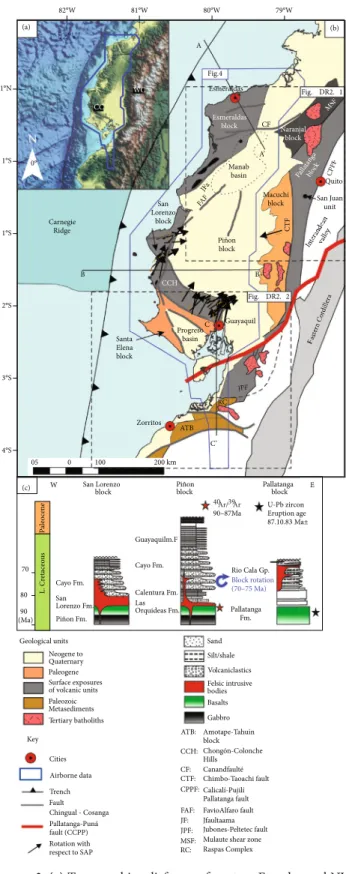
Major continental growth took place along the NW corner of South America during the Late Cretaceous, following the col-lision and accretion of a sliver from the Caribbean Large Igneous Province (CLIP) [1–3]. Records of the interaction between the CLIP and the South America continental margin are preserved along its suture zone in the Western Cordillera
and in SW coastal Ecuador (e.g., [4–8]) (Figure 1). Several lines of evidence suggest that prior to the collision with South America, the CLIP was affected by the emplacement of the tholeiitic San Lorenzo/Naranjal and Rio Cala island arcs, while the western limit of the South American Plate (SAP) was most likely a passive margin [6, 8]. Different authors agree on an oblique arc-passive margin collision con figura-tion starting at ~75 Ma [1, 6, 9] with subsequent clockwise Volume 2020, Article ID 2810692, 23 pages
block rotations between~70 and 75 Ma [2, 10, 11]. However, discrepancies exist about the subduction polarity beneath the CLIP. This aspect and the arc-continent collision geometry, including the tectonic regime of the subduction, may have had a great impact on the preferential preservation or loss of evidence of the Late Cretaceous subduction system [12].
Stern et al. [13] suggest that ophiolites emplaced along the suture zone provide the best record for understanding subduction initiation processes and forearc composition and magmatic stratigraphy. Such exposures along the West-ern Cordillera of Ecuador and Colombia have provided key petrotectonic indicators for the geodynamic reconstruction of the NW South American margin (Figure 1). Nevertheless, the low preservation potential of such ancient terranes after an arc-continent collision, together with limited exposure, could limit geodynamic reconstructions, leading to contro-versial interpretations [12, 14]. Despite the records of arc
activity in the Western Cordillera, there are few publications discussing the different precollision elements of the subduc-tion system including the locasubduc-tion of the trench, forearc, and back-arc systems.
In Western Ecuador, between the Coastal Cordillera and the Western Cordillera (Figure 2(a)), the units associated with the accreted sliver are buried beneath the Cenozoic fore-arc sediments impairing the reconstruction of the underlying forearc basement. We use an unpublished aeromagnetic/-gravity survey of this region (Figure 2(b)) and present a mul-tiscale data integration approach to uncover the underlying crustal structure of the forearc region in Ecuador and add further constraints on the geodynamic evolution of the region. This work was motivated by the lack of a crustal model for the Ecuadorian forearc region. Indeed, since the presentation of a simple 2D Bouguer’s anomaly forward model across the continental margin by Feininger and Seguin
Nazca Plate Farallon Oceanic Crust Caribbean Plate NAS Fig. 2 7 cm/a 5 cm/a ~1 cm/a G km
Late Cretaceous ophiolites Tertiary oceanic plateau
Carnegie Ridge
Trench
7 cm/a
Plate motion direction/velocity 80°W
90°W
0°
0 250 500
Cocos Plate
Strike-slip fault, right lateral offset
Figure 1: Plate configuration of the NW South America and Central America regions, highlighting the surface exposure of ophiolites attributed to the Late Cretaceous Caribbean Large Igneous Province (CLIP). Plate kinematics are derived from relative plate motions according to GPS data (unfilled color arrow) and the NUVEL-1 global kinematic model (filled color arrow). Modified after [3, 52, 107].
[15], and a more recent and similar plate-scale study using satellite potentialfield data by Tamay et al. [16], the underly-ing basement structure of the Ecuadorian forearc remains poorly understood.
In this work, we have defined three main geophysical domains based on the analysis of aerogravity/magnetic anomalies, constraints derived from published geodynamic scenarios [6–8, 10, 17, 18], and by means of 2D forward models. Our interpretation shows a heterogeneous and struc-turally complex basement, which may have resulted from the fragmentation of the sliver following the initial Late Creta-ceous accretionary phase. Furthermore, our model sheds light on the nature of the southern suture between the accreted sliver of the CLIP and the continental block.
2. Regional Geology
The Coastal and Western Cordillera regions in Ecuador are characterized by exposures associated with crustal fragments derived from the plume-derived Caribbean Large Igneous Province (CLIP) erupted in Early-Late Cretaceous times (e.g., [3, 18, 19]) (Figure 2). The arrival and collision of the CLIP along the NW corner of the South American margin have been dated as a Late Cretaceous event (75-65 Ma) on the basis of stratigraphic, paleomagnetic, and radiometric age control [7, 8, 20]. Paleomagnetic studies in Western Ecuador by Roperch et al. [11] and Luzieux et al. [10] con-cluded that the arc-derived basement in Ecuador was gener-ated at low latitudes. The collision of the CLIP may have been followed by crustal fragmentation and clockwise rotations (ca. 40-50°) during the Campanian to Early Maastrichtian [10, 11]. Alternative models propose the presence of at least two different oceanic plateaus emplaced during two accre-tionary periods between the Late Cretaceous and the Late Eocene [5, 7, 21, 22].
2.1. Western Cordillera Crustal Blocks
2.1.1. Pallatanga Block. The block is located along the West-ern Cordillera, composed of a series of fault-bounded slices with SSW-NNE direction (Figure 2(b)). It is limited to the west by the Chimbo-Toachistrike slip fault and to the east by the Calacalí-Pujilí-Pallatanga fault, which represents part of the Late Cretaceous ocean-continent suture [8] (Figure 2(b)). It comprises Early to Late Cretaceous mafic to ultramafic rocks, mainly composed of basalts, gabbros, and massive dolerites, overlain by volcanic lastic sediments (Figure 2(c)) [7, 18]. Basalts and gabbros from the Pallatanga block have an enriched MORB geochemical signature, possi-bly related to a mantle plume [5, 7, 18, 23, 24]. Its eastern-most part comprises serpentinized peridotites, dolerites, and hornblende-bearing gabbros from the San Juan unit [6, 7]. An amphibole-bearing gabbro of this unit yielded an Sm/Nd isochron of123 ± 1:3 Ma [23] and a poor Ar/Ar inte-grated age of 105 Ma [25]. However, zircons from a layered gabbro mapped as the San Juan unit yielded a U/Pb age of 87:1 ± 1:66 Ma [8], suggesting that the San Juan unit is part of the same oceanic plateau as the Pallatanga unit.
Block rotation (70–75 Ma) (b) U-Pb zircon Eruption age 87.10.83 Ma± P ale o cene Esmeraldas Guayaquil Zorritos Quito 82°W 81°W 80°W 79°W 1°N 0° 1°S 1°S 2°S 3°S 4°S 05 0 100 200 km B B ’ A A’ Fig.4 Fig. DR2. 2 C C’ Fig. DR2. 1 (c) Naranjal block Esmeraldas block Cayo Fm. Guayaquilm.F L. Cr et ace o us Rio Cala Gp. W E Cayo Fm. Piñon Fm. San Lorenzo Fm. Las Orquideas Fm. Calentura Fm. ATB CCH CF Piñon block Pallatanga block San Lorenzo block 90 (Ma) 80 70 RC Gabbro Basalts Volcaniclastics Fault Trench Cities Airborne data Key Tertiary batholiths Chingual - Cosanga Pallatanga-Puná fault (CCPP) Geological units Paleogene Neogene to Quaternary CF: FAF: JPF: MSF: CCH: Surface exposures of volcanic units ATB: Amotape-Tahuin block Canandfaulté Chimbo-Taoachi fault FavioAlfaro fault Jfaultaama Jubones-Peltetec fault Mulaute shear zone Raspas Complex Calicalí-Pujilí Pallatanga fault Chongón-Colonche Hills Felsic intrusive bodies Silt/shale Sand Paleozoic Metasediments Rotation with respect to SAP CTF: CPPF: JF: RC: (a) CC WC Manab basin San Lorenzo block Carnegie Ridge Piñon block Macuchi
block San Juanunit
CTF Progreso basin Santa Elena block 40Ar/39Ar 90–87Ma Pallatanga Fm.
Figure 2: (a) Topographic relief map of western Ecuador and NW Peru showing the location and coverage of the aeromagnetic survey. (b) Simplified tectonic terrane map showing the different crustal blocks interpreted along western Ecuador maps (modified after Luzieux et al. [10] and Vallejo et al. [8]). The blue outline defines the limits of the gravity and magnetic aeromagnetic survey used in this study. (c) Representative stratigraphic columns for the three main tectonic blocks discussed in this study.
2.1.2. Macuchi Block. The Macuchi block is in faulted contact with the Pallatanga block along the Chimbo-Toachi fault (Figure 2(b)) [7, 8]. Different authors have interpreted the Macuchi block as a volcanic arc accreted during the Eocene (e.g., [7, 17]). However, Vallejo et al. [8] suggest that this is a difficult model to reconcile given the current position of the Macuchi block, in between the Pallatanga and Piñón blocks that possess a similar radiometric age (ca. 88 Ma).
The Macuchi block is mostly characterized by volcani-clastic material with a small percentage of basaltic pillow lavas, lithic tuffs of basaltic and andesitic composition, basal-tic breccias, turbidites of volcanic origin, and cherts [5, 26]. The sedimentary units that compose the Macuchi block are interpreted as a product of submarine volcanism trans-ported by gravity flow processes [5]. Whole-rock K/Ar radiometric data yield an age of41:6 ± 2:1 Ma for a basaltic andesite sample [27]. Vallejo et al. [8] obtained a similar age of42:63 ± 1:3 Ma from a plagioclase of an andesitic lava flow. Nevertheless, the age of the base of the Macuchiunit, as well as the age of the volcaniclastic deposits, remains largely unconstrained.
2.1.3. Naranjal Block. The block is located in the northern part of the study area in faulted contact with the Pallatanga block, along the Mulaute shear zone (Figure 2(b)). The Naranjal block is characterized by rocks with a volcanic arc affinity, which appears to correlate with the interpreted Ricaurte arc in southern Colombia [28]. It is composed of basaltic pillow lavas and andesites with intercalated sedimen-tary rocks [26]. Two distinct lithotectonic units have been interpreted within the block: (1) island arc lavas, towards the north, which may correlate with basalts from the Río Cala group at the Pallatanga block, and (2) to the south by rocks with plateau affinities [7]. The southern extent of the Naran-jal block is assumed to be buried under the forearc sediments of the Manabí basin (Figure 2(b)).
2.2. Volcanic and Oceanic Plateau Remnants in the Forearc Region
2.2.1. Piñón and Santa Elena Blocks. The exposures in the Chongón Colonche Hills in SW Ecuador (Figure 2(a)) are mainly composed of tholeiitic basalts, pillow lavas, and gabbros. The geochemical signature of these mafic rocks supports an oceanic plateau interpretation [7, 18, 21, 22].
The age of the Piñón Formation was initially constrained by foraminifera and nannofossils from the overlying black shales of the Calentura Formation, which yielded a Cenomanian-Early Coniacian age and led Reynaud et al. [22] to propose an Early Cretaceous age for the Piñón For-mation. Van Melle et al. [19] then based on an expanded stratigraphic dataset propose a Coniacian age for the Piñón Formation. Furthermore, it was suggested that the Pallatanga and Piñón blocks were fragmented after the Late Cretaceous collision with the South American margin. This is supported by40Ar/39Ar dating yielding an age between 90 and 87 Ma for both crustal blocks [10].
South of the Chongón-Colonche Hills, in the Santa Elena block (Figure 2), the stratigraphy is dominated by deformed
Late Cretaceous rocks from the Santa Elena Formation, unconformably overlain by folded rocks from the Paleocene Azúcar Formation. These deformed sequences are inter-preted as an accretionary wedge, which led to the develop-ment of an outer forearc high during the Oligocene, and the development of the restricted Neogene Progreso basin (Figure 2(b)) [4, 29]. It is assumed that volcaniclastic sequences from the Cayo Formation and possibly mafic rocks from the Piñón Formation form the underlying basement of the Santa Elena block.
2.2.2. San Lorenzo Block. Located to the west of the Piñón block and delimited by the Jipijapa, Jama, and Canandé faults (Figure 2(b)), this block forms the medium topography (max. 400 m) Coastal Cordillera [30]. The mafic rocks exposed in the Coastal Cordillera are attributed to the Piñón Formation, commonly overlain by coarse-grained sandstones, ash beds, basalticflows, dikes, and pillow lavas (Figure 2(c)) [10, 22]. Goossens and Rose [31] report that tholeiites erupted along east-trending fractures from the Late Cretaceous until Early Eocene. These rocks are attributed to a Campanian to Maas-trichtian volcanic island arc constituting the San Lorenzo Formation [8, 19, 21, 22]. Based on plagioclase from pillow basalts Ar/Ar dated as 72:7 ± 1:4 Ma, Lebrat et al. [17] pro-posed that the island arc-related sequences preserved in the Coastal and the Western Cordillera are coeval and possibly part of the same system. However, several authors report larger age ranges between 87 and 54 Ma [10, 21, 31]. The San Lorenzo block is also characterized by a clear hiatus between the Late Cretaceous and Middle Eocene carbona-ceous formations [10, 22, 32], which has been attributed to the accretion of the San Lorenzo block to the already accreted Piñon block, during Paleocene-Eocene times [7, 21]. 2.2.3. Esmeraldas Block. Limited to the east by the Canandé fault and mostly covered by Neogene sediments (Figure 2(b)), this is the least well-constrained block in terms of its nature and age. It is composed of pillow basalts, dolerites, isotropic gabbross, and hyaloclastites containing glass fragments and picritic compositions [18]. The same authors suggest that the units forming the block appear petrologically and geochemi-cally like the lavas of the CLIP (92-86 Ma).
2.3. Tahuin Massif along NW Peru. The Amotape-Tahuin Massif is an E-W oriented morphological feature composed of Precambrian to Paleozoic rocks along the NW coast of Peru, which shifts into a N-S direction towards the south [33]. Towards the ENE, the Jubones fault separates rocks with a continental affinity from those composed of exhumed high pressure, low-temperature oceanic origin [34–36].
Most of the massif between 4°S to 6°S is composed of metasediments. Zircon ages along the metamorphic belt show a very similar pattern of Neoproterozoic age clusters and a younger group around 320 Ma and suggest a common metasedimentary origin of the entire massif [37]. Further-more, these age clusters are similar with those in the western parts of the Eastern Cordillera and the northern section of the Occidental Cordillera of Peru suggesting a wide,
polyphase Andean metamorphic belt [37] thus excluding previous theories about the allochthonous origin for the Amotape-Tahuin Massif [33, 38, 39]. Moreover, its autoch-thonous origin was previously evidenced by the pervasive presence of Triassic (230-220 Ma) granitoids along the Amo-tape Massif and the Cordillera Real of Ecuador [35, 40, 41].
Paleomagnetic studies at the Amotape-Tahuin Massif report clockwise rotations in the order of 35°during the Late Cretaceous-Early Paleocene, related to the collision and accretion of the CLIP [33]. Fault mapping and displacement data show deformation that might be associated with a post-Paleocene reactivation, with block rotations in the order of 25°[42], of the inherited structures formed during the initial accretionary phase [4].
3. Previous Gravimetric and
Magnetometric Studies
The earliest study using aeromagnetic data was carried out during the mid-1960’s for the Mineral Project of the United Nations Development Program [31] and identified a series of E-W magnetic anomalies, along the San Lorenzo block, bounded to the west by a major north to NE-trending fault (Jipijapa fault in this study). Goossens and Rose [31] suggest that these anomalies are caused by tholeiitic basalticflows (their “Basic Igneous Complex”). Later, these rocks were compared to similar exposures in Colombia and interpreted to form an elongated igneous belt along the NW of South America, from Ecuador to Panamá [43]. Subsequent poten-tialfield studies along the margins of Ecuador and Peru ana-lyzed free-air gravity gradients, both near the trench and along the continental slope [44]. Primary observations along the NW Peru and SW Ecuador margin by Shepherd and Moberly [44] include (1)flattened gradients east of the cur-rent trench position associated with a wedge of tectonized sediments accumulated by subduction processes; (2) abrupt free-air gravity inflections on the upper slope (NW Peru), related to granitic basement (correlative to the Amotape-Tahuin block); and (3) a gravity minimum in the Gulf of Guayaquil, which denotes more than 6000 m of Quaternary sediments infilling an inferred pull-apart basin.
Feininger and Seguin [15] characterized the crust in Ecuador using a 2D forward model (located at~2°S) based on simple Bouguer gravity data. They concluded that the coastal region in Ecuador must be underlain by an ancient oceanic plate. Based on the correlation between positive (Bouguer) anomalies over the inferred oceanic terrane and negative values over the interpreted continental crust, they proposed a possible location for the suture between these two crustal blocks. Nevertheless, the conclusions drawn for the coastal region lacked a more thorough analysis regarding its internal structure.
Tamay et al. [16] studied the extension of the subducted Carnegie Ridge using potentialfield data analysis and suggest that the Carnegie Ridge underlies the continental margin reaching the Andes Cordillera based on an elongated E-W negative magnetic anomaly concordant with the position of the aseismic ridge and that it subsequently controlled margin segmentation, seismicity, and volcanism. Free-air gravity
anomalies along the offshore zone have more recently been used to constrain the tectonic development of the offshore forearc basins between 1°N and 2°S [45]. This study shows a clear relationship between depth-to-basement and related faulting and the distribution of gravimetric anomalies.
Despite the different studies using potential field data, none of them present a detailed view of the crustal structure of the entire forearc region in Ecuador. Utilizing recently acquired high-resolution aeromagnetic and gravity data along the coastal region, we present a model of the underly-ing crustal architecture of the forearc region in Western Ecuador.
4. Geophysical Data and Methods
An aeromagnetic/gravity survey, acquired by Sander Geo-physics for EP Petroecuador in 2010, is available between 2°N and 4°S for the forearc region in Ecuador (Figure 2). A total area of ca. 78000 km2 was covered with N-S oriented acquisition lines and E-W tie lines with a spacing of ca. 1500 m and ca. 8950 m, respectively, and a nominal flight altitude of 250 m above the terrain. In addition, we had access to unpublished onshore seismic lines acquired and processed by Sinopec for EP Petroecuador in 2009, which aid to define the forearc basin geometry (especially depth to basement) within the study area. Offshore seismic reflection and refrac-tion profiles across the margin [45–49] were integrated into the 2D models to constrain the extent of the forearc basement up to the trench.
4.1. Analysis of Gravity and Magnetic Anomalies. Our approach is based on two steps: (1) a spectral analysis of the frequency content to map out buried geological features and (2) 2D forward modeling of the anomalies to test plausi-ble geological scenarios. Throughout this approach, we aim to delineate the main geophysical domains and to character-ize the interpreted crustal blocks in terms of density and magnetic susceptibility.
Conventionalfiltering techniques including regional and residual anomalies, analytical signal, and tilt derivative were applied to the data (Item DR1), in order to aid geological interpretations of the sources of the gravity and magnetic anomalies. Due to the poor coverage and low-frequency con-tent of global satellite-derived magnetic data in this region, only the aeromagnetic survey was used. A brief description of the different types of filters including the results of their application to the data is further described in the supplemen-tary material (Item DR1).
For 2D forward modeling purposes, we utilized the GM-SYS module in Oasis Montaj, software developed by Geosoft Inc. Three key profiles were selected to cover all the major crustal blocks (Figure 2): (1) a northern profile to study the Esmeraldas and Naranjal blocks, (2) a central profile across the Santa Lorenzo and Piñón blocks to study the highest Bouguer gravity anomaly observed in the region (Figure 3), and (3) a southern profile, coincident with a narrow strip of the high-resolution magnetic data, to study the suture of the accreted sliver across the Gulf of Guayaquil area.
4.2. Data Constraints for 2D Forward Models. The geometry of the 2D crustal models across the forearc region in Ecuador was mainly constrained by means of existing velocity models and deep and conventional seismic profiles. The properties of the different blocks to initiate the forward models were derived from velocity analyses, paleomagnetism studies, and borehole data (Table 1).
The densities for basement rocks are derived from the velocity analysis of wide-angle seismic data [47, 49, 56], using empirical velocity-density relationships for igneous rocks [60]. For the sedimentary cover, densities were estimated from industrial borehole logs, located in the Gulf of Guaya-quil and the Progreso basins. The different densities used in this study are listed in Table 2.
We define the acoustic basement as the Cretaceous oce-anic crust underlying the coastal forearc region. Overlying sedimentary packages were roughly averaged with a seismic velocity of 2.3 km/s, to depth convert the top of the acoustic basement. The results of the seismic interpretation of deep and conventional seismic profiles ([46, 49, 56, 61, 62]; and this work) were used to constrain the forearc basement struc-tural configuration as input geometry for the 2D forward models.
Magnetic susceptibility and remanent magnetization values from outcrops along the Chongón-Colonche Hills [20] were used as input parameters for the Cretaceous blocks in our forward magnetic models. For the characterization of the subducting Nazca Plate, natural remanent magnetization
79°0′W 80°0′W 81°0′W 82°0′W ¯ Grijal va FZ Carnegie Ridge A A′ B B′ C C′ Fig. 1 0 Fig. 8 Fig.9 CC H ! . ! . ! . 79°0′W 80°0′W 81°0′W 82°0′W 1°0′N 0°0′ 1°0′S 2°0′S 3°0′S 4°0′S ¯ CCPP Grijal va FZ Carnegi e Ridge Ecuador
Peru EcuadorPeru
190 50 –50 –150 –300 120 25 –70 –200 10 0 PB 0 50 100 km mGal mGal
Fast forearc anomaly (Vs) Slow forearc velocity anomaly (Vs) at 10 km
Hydrated mantle See Fig. 4 A A′ B B′ C C’ Fig. 1 0 Fig. 8 Fig.9 CC H ! . ! . ! . Manab basin í Borbón basin Esperanza subbasin Tumb es basin Manglares Basin SE H JPF JaF JF Ca F Co F CF LC F Canand F aulét FAF PF (a) (b)
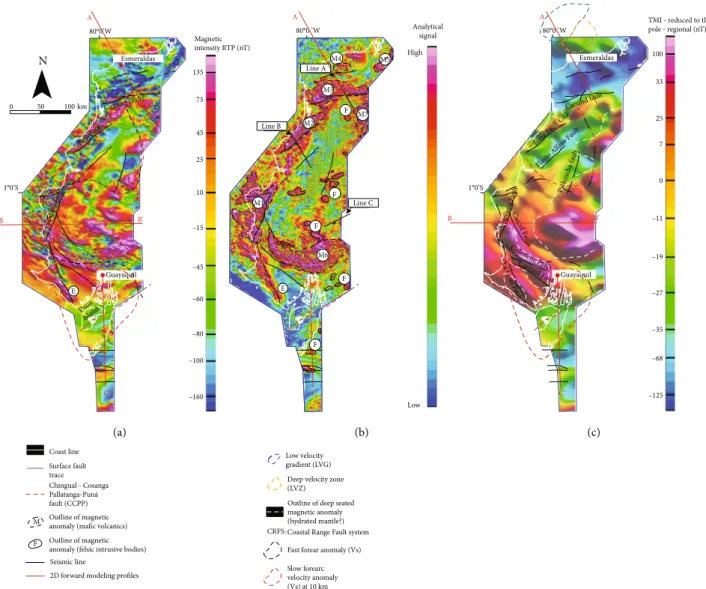
Figure 3: (a) A combined Bouguer gravity anomaly map, including satellite gravity data [108] outside the outline of the aeromagnetic survey, marked in blue. At ca. 2°S, a very high positive anomaly is coincident with the Chongón-Colonche hills (CCH). Negative Bouguer’s values to the east are associated with a deep Andean crustal root. To the west of the trench, another high positive anomaly is associated with the oceanic Carnegie Ridge. (b) Upward continuation of 10km to highlight the deeper sources of anomalies. Continuous lines in black consist of the compilation of surface faults [30], and the red line represents the CCPP fault system, which is associated with a sharp boundary between the NAS and the Subandean domain overthrusting the SAP [67]. Abbreviations are as follows: CF: Carrizal fault; CaF: Cascol fault; CoF: Colonche fault; FAF: Flavio Alfaro fault; JF: Jipijapa fault; JaF: Jama fault; JPF: Jubones-Peltetec fault; LCF: La Cruz fault; MA: Mulaute anomaly; PB: Progreso basin; PF: Pichincha fault; SEH: Santa Elena High. Dashed black lines represent fast forearc velocities at depth of 20 km, and the red dashed lines slow forearc velocities at depth of 10 km [56].
(NRM) values were used from Ocean Drilling Program (ODP) sites 1238 and 1239 [63]. Other blocks were initialized with theoretical values [60], andfinal parameters were deter-mined based on a best-to-fit approach.
5. Analysis of Regional Geophysical Data
5.1. Seismic, Gravity, and Magnetic Anomalies. The gravity and magnetic data show contrasting anomalies (Figures 3 and 4), which have been grouped into three main geophysical domains based on their different wavelength and textural characteristics.
5.1.1. Outer Domain. A series of short-wavelength Bouguer anomalies and elongated in a NNW-SSE direction character-ize the SW coast (yellow arrows, Figure 3(a)). This region is coincident with the Santa Elena block and bounds the Pro-greso basin to the east. The short-wavelength characteristic of the anomalies extends north, but in an irregular pattern (Figure 3(a)). The eastern boundary of this domain is defined
by a high positive and elongated anomaly, which appears seg-mented and apparently rotated clockwise to the north. This last lineament is also highlighted by a series of elongated magnetic anomalies (Figure 4(a)). An analyticalfilter applied to the total intensity magnetic map highlights a series of pos-itive anomalies (M1, M2, and M3 sections in Figure 4(b)) of similar textural characteristics. The analytical signal high-lights the outline of the possible sources of these anomalies with their eastern edges coincident with the major Jipijapa, Jama, and Canandé faults (Figure 4(b)), a set called here the Coastal Range Fault System (Figure 4). The same textural characteristic appears to extend southwards into the SEH but shifting to a NW-SE direction. This lineament is coinci-dent with the La Cruz fault, delimiting the outer domain from the Progreso basin. From south to north, this linea-ment, which appears related to a deep source as shown by Figure 3(b), has a concave shape and delimits the outer domain from the inner domain to the east. As mentioned above, this lineament is coincident with major faults and bounds Cenozoic forearc depocenters located landwards
Table 1: Model constraints.
Element to be constrained Parameter of constraint Reference
Tectonic settings Fieldwork and geophysical studies
This work. Aizprua et al. [4]; Bethoux et al. [50]; Calahorrano et al. [46]; Feininger and Seguin [15], Font et al. [51]; Gutscher et al. [52]; Graindorge et al. [49]; Gailler et al. [53]; Hernández et al. [45]; Jaillard et al. [54]; Koch et al. [55]; Luzieux et al. [10]; Lynner et al. [56]; Michaud et al. [57]; Vallejo et al. [8]; Witt and Bourgois [58]
Ecuadorian trench Bathymetry SRTM30 plus v7
Subduction slab geometry Wide-azimuth seismic, OBS Gailler et al. [53]; Graindorge et al. [49]
Density Density from seismic velocity profiles Calahorrano et al. [46]; Gailler et al. [53]; Sanclemente [59]
Magnetic properties Paleomagnetic studies Roperch et al. [11]; Luzieux et al. [10]
Table 2: List of parameters used for forward modeling purposes.
(a) Initial parameter
Earth’s magnetic field (December 2011)
Magnitude (A m-1) 29407 nT
Inclination (deg) 20.58°
Declination (deg) -0.78°
(b)
Block’s name Density (kg m-3) Susceptibility (SI) Remanence magnetization
Intensity (A m-1) Inclination (deg) Declination (deg)
Water 1030 — — — — Piñón 2850 0.01 1.2 -15 50 Hydrated mantle 2900 0.07 — — — Mantle 3300 — — — — Volcanic arc 2900 0.02 1.4 -15 70 Sedimentary basin 2400 — — — — Volcano-sedimentary 2700 — — — —
within the inner domain. The unusual feature (E in Figure 4), here termed the Estancia magnetic high, strongly correlates with the La Cruz fault. The Estancia magnetic high (70 nT) suggests that it may be underlain by mafic rocks, presumably from the Piñón formation. Farther south into the Santa Elena High and towards the Puná island, the magnetic intensity has a different anomaly pattern (Figure 4), possi-bly suggesting the transition into the Santa Elena accre-tionary complex [4].
The M1 and M2 anomalies highlighted by the analytical signal are characterized by a discontinuity that correlates to the jump between the Jipijapa and Jama faults (Figure 4(b)). Northward into the M3 anomaly, similar textural patterns are observed with its eastern limit appar-ently rotated in relation to the same structural trends, the Jipijapa and Jama faults, observed to the south. The near E-W orientation of the eastern limit of the M3 anomaly coincides with the Canandé fault, a major bounding fault
to the Cenozoic Manabí basin and boundary between inner and outer domains (Figure 4).
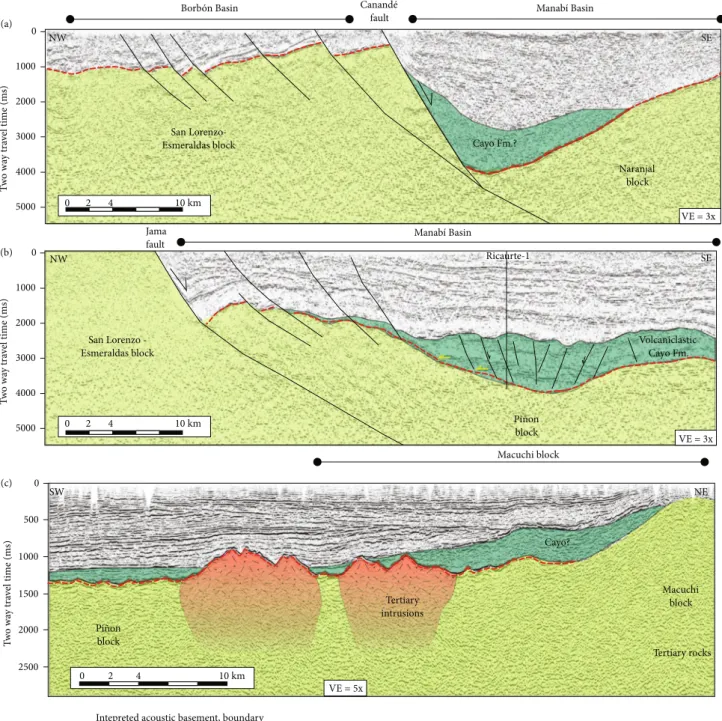
The apparent relationship between the eastern limit of the M1 to M3 anomalies to the major bounding faults sug-gests that the mafic-associated anomalies may partly control the location of major fault activity, possibly as a rheological factor. A close-up look into the transitional region between M2 and M3 anomalies shows the structural complexity of the area and how this may correlate with exposures of the Esmeraldas block and possibly with the southern extent of the Naranjal block (Item DR2). An industrial seismic profile across this area (Figure 5(a)) shows the Canandé fault sepa-rating a major structural high to the north from a sedimen-tary basin to the south. The closely spaced normal faults affecting the top of the basement can be correlated with the geophysical lineaments derived from the analytical signal (Item DR2). A seismic profile farther south (Figure 5(b)) shows similar characteristics to the profile described above
1°0’S 80°0 ’W 80°0 ’W ! . Magnetic intensity RTP (nT) High Low Jipij apa F ault Ca sc ol F aul t Colonche F ault Carrizal F aul La Cr uz F au lt
Flavio Alfa ro F ault B B’ A’ A 1°0’S 80°0’W 0 50 100 N km Line B Line A Line C
2D forward modeling profiles
A’ A C C’ B B’ A’ A C’ M F C C’ F F F JamaFau lt Canand fa ulté F F M6 M1 M7 M2 M3 M5 M4 E E Seismic line
Outline of deep seated magnetic anomaly (hydrated mantle?) Low velocity gradient (LVG)
(a) (b) (c)
Deep velocity zone (LVZ)
Coastal Range Fault system Fast forear anomaly (Vs) Slow forearc velocity anomaly (Vs) at 10 km CRFS: Coast line Outline of magnetic anomaly (mafic volcanics) Outline of magnetic anomaly (felsic intrusive bodies) Surface fault trace Chingual - Cosanga Pallatanga-Puná fault (CCPP) Analytical signal 135 75 45 25 –15 –45 –60 –80 –100 –160 10
TMI - reduced to the pole - regional (nT) 100 33 25 7 –11 –19 –27 –35 –68 –125 0 Guayaquil Puna Islan d Jipi jap a fa ult Esmeraldas Canand fa ult Pic hinc ha fa ult Esmeraldas Jama F ault CRF Guayaquil
Figure 4: (a) Total magnetic intensity (TMI) map-reduced to the pole (RTP) of the forearc region in Ecuador. (b) Analytical signal of the TMI in (a). (c) Upward continuation (10 km) of the TMI in (a). M-type anomalies are associated with mafic-derived bodies, whereas F-type anomaly relates to felsic intrusive bodies. The E anomaly refers to the Estancia Magnetic high, possibly a M-type anomaly and prominent feature in southern Ecuador coincident with the La Cruz fault.
suggesting that the Canandé and Jama faults delimit the outer domain landwards and may be of a similar origin.
The M4 anomaly, located farther north, appears to have similar textural characteristics in the analytical sig-nal as those observed for M3, however with a less
con-siderable size (Item DR2). The location of the M4 anomaly is coincident with exposures across the struc-tural high called “Businga dome,” where rocks of the Late Cretaceous Piñón Formation have been described in the past [30, 64]. 0 T w o wa y tra vel tim e (m s) 1000 2000 2500 1500 500
Late Cretaceous oceanic crustal sliver Intepreted acoustic basement, boundary between Late Cretaceous and tertiary rocks 1000 2000 3000 4000 5000 0 1000 2000 3000 4000 5000 0 0 2 4 10 km 0 2 4 10 km 0 2 4 10 km (a) (b) (c) Interpreted faults T w o wa y tra vel time (m s) T w o wa y tra vel time (m s) Jama fault
Figure 5: Onshore seismic profiles across the San Lorenzo-Esmeraldas and Piñón blocks. (a) A NW-SE profile which shows a series or normal faults dipping landwards west of the major Canande fault, which bounds the Cenozoic Manabí basin. (b) A NW-SE profile showing to the west an uplifted area related to the Cretaceous acoustic basement, and to the east a depocenter possibly underlie by a deformed basement. (c) A NE-SE seismic profile shows an uplifted area towards the north, which corresponds to the exposed Macuchi block. Notice the inferred presence of intrusive bodies possibly emplaced at different ages. Location of seismic profiles in Figure 2.
5.1.2. Inner Domain. In contrast to the outer domain, the inner domain is mostly characterized by long-wavelength anomalies (Figures 3 and 4). It is limited to the west by the convex-shaped lineament forming the eastern boundary of the outer domain (Figure 3), to the east by the limit of the survey (i.e., Andean piedmont and related outcrops of the Macuchi block), and to the north by the Canandé fault. This domain accounts for a large portion of the forearc region in Ecuador. A key feature of this domain is the high positive amplitude and long-wavelength Bouguer gravity anomaly, coincident with the exposures along the Chongón-Colonche Hills (Figure 3(a)).
From the inner and towards the outer domain, gravity values decrease considerably reaching up to ca. -10 mGal to the north and ca. -50 mGal south of the Chongón-Colonche Hills (Figure 3). The northernmost gravity low within this domain is associated with the Manabí sedimentary basin, which has an elliptical shape with a NE-SW oriented axis.
The analytical signal of the total magnetic intensity anomaly map (Figure 4) shows two major mafic-associated anomalies (M6 and M7). In between these two anomalies, there are a series of patchy circular to elliptical anomalies possibly associated with felsic intrusions, of similar dimen-sions as those outcropping farther to the east within the Macuchi block (Figure 2). It is likely that the circular anom-alies observed in the analytical signal may represent a SW prolongation of the intrusive bodies related to the Macuchi Unit. A seismic profile across this region (Figure 5(c)) shows a localized and irregular acoustic basement relief, typical of igneous intrusions.
The elongated M6 anomaly apparently expanding from west towards the east, exposed along the Chongón Colonche Hills, accounts primarily for rocks of mafic characteristics [10, 19]. Goossens and Rose [31] have previously reported elongated magnetic anomalies located along the Chongón-Colonche Hills, with a predominantly E-W orientation, and associated them with basaltic lavaflows. In contrast, in the northern part of the inner domain near the transition to the Naranjal block, the M7 anomaly coincides well with the exposures that define the Naranjal block (Item DR2), sug-gesting that the anomaly may be a southward prolongation of the former.
5.1.3. Southern Suture Domain (Gulf of Guayaquil). The positive Bouguer gravity anomaly over the Santa Elena block decreases to the south where it becomes negative over the Esperanza subbasin (Figure 3(a)). A rapid change related to the thick sedimentary succession of Quaternary deposits in the Esperanza subbasin, a depocenter that is associated with the northward migration of the North Andean Sliver [4, 65], whereas along the Tumbes basin, the gravity low is likely to be controlled by a s.s. forearc depocenter [4, 66]. Across the Ecuador-Peru border, south of the Tumbes basin (Figure 3), the gravity anomaly increases towards the Amotape-Tahuin Massif, which is of continental affin-ity and marks the southern limit of the suture domain.
The gravity map shown in Figure 3(a) shows an apparent oblique relationship between the Tumbes and Esperanza gravity lows. From the Esperanza subbasin towards the
con-tinent, the gravity low area narrows drastically into a location where it coincides with the major Chingual-Cosanga-Palla-tanga-Puná (CCPP) fault system defined by Alvarado et al. [67] (Figure 3(a)). The wider part of the whole negative anomaly may be associated with (1) the possibly northward displacement of the Santa Elena High, which is part of the North Andean Sliver tectonic scape [4], or (2) the trenchward extension of the Jubones fault. The latest is the southernmost location of the suture between the accreted oceanic terranes of the CLIP and the continent. At the narrow section of the gravity low, Late Cretaceous rocks from the Pallatanga For-mation (an age equivalent to the Piñón ForFor-mation) are inter-preted to underlay the sedimentary basin in this region [4].
Despite only partial coverage of the aeromagnetic survey across the eastern part of the Gulf of Guayaquil, this has allowed us to better constrain the deep crustal structure across a major boundary (Item DR2). The magnetic intensity map-reduced to the pole (RTP) shown in Figure 4(a) shows a decrease of values over the Puná island, pointing towards a reduction in magnetic susceptibility of the region. The dis-posal of the magnetic anomalies, shown in Figure 4(a), appears to correlate with some surface exposure of crustal units in the area. For instance, south of the Puná island, a prominent magnetic source correlates with the strike of the ultramafic Raspas Complex, an exhumed fragment from a Late Jurassic-Early Cretaceous subduction system [34, 68]. This magnetic high is bounded to the north by a magnetic low striking E-W and coincident with the trend of the Jubones fault (the southernmost identified suture) and to the south by the Late Cretaceous Lancones sedimentary basin.
5.2. Forward Models
5.2.1. Crustal Structure. Overall the model A-A’ shows an average thickness of 15 km of crust (Figure 6(c)), based on a best-fit approach, with some variations at the different domains. At the outer domain in profiles A-A’ and B-B’ (Figures 6 and 7, respectively) the seaward decrease of the gravity anomaly may be indicative of thickness or density variations. For instance, at profile A-A’ (between 20 and 50 km, 2600 kg/m3), this lower gravity anomaly may be
asso-ciated with a low-velocity zone along the western part of the prestacked depth migrated SIS-line 44 presented by Collot et al. [62], who suggest that this block represents an altered outer wedge affected by deep-sourced fluids flowing along crustal faults. Indeed, a three-dimensional velocity model covering the same block [61] supports a low-velocity zone that may be related to altered and hydrated mafic and ultra-mafic rocks, commonly observed along margins consisting of oceanic or island arcs accreted terranes. Furthermore, recent tomography-based shear velocity inversion models reveal low-velocity crustal bodies possibly associated with the subduction of the Carnegie Ridge, north of 1°S (Figure 3) [55, 56]. East of the low-density zone (Figures 6(b) and 6(c)), a high-amplitude magnetic anomaly shows decreasing values towards the Borbón basin. The magnetic contrast towards the east (0.01 SI) extends from 60 to 110 km in pro-file A-A’. In between 110 and 140 km, both the magnetic and
gravity anomalies are characterized by aflat gradient prior to entering into an area of varying magnetic values, associated with the major Canandé fault zone, as observed on the seis-mic profile shown in Figure 5(a). A series of faulted blocks with varying magnetic susceptibility are added to match the varying magnetic profile west of the Canandé extensional fault (Figure 6(a)). The blocks are vertically extended from the inferred top basement down to depths of 7-9 km match-ing the upper boundary of a higher density (2950 kg/m3) and laterally extended lower crust. The inferred fault system may be also associated with NNE-SSW dyke-shape mafic bodies, considering the high degree of variability in the total mag-netic intensity map, a typical response encountered at low latitudes [69]. The Canandé fault also marks the base of a steep gravity gradient and the eastern edge of the irregular magnetic zone. In our model, the depocenter of the Cenozoic Manabí basin and a less dense Late Cretaceous oceanic crust
basement account for this steep gradient marking the bound-ary between the inner and outer domains.
Along profile B-B’, anomalies are matched with a rela-tively shallow Moho with ~10 km depth and up to 15 km depth towards the Andean piedmont (Figure 7). The gravity anomaly and derived model show a similar pattern towards the trench as in A-A’, except that values are considerably higher compared to profile A-A’. To fit the anomaly, across the outer domain, a thicker upper crustal block (of ca. 7 km) with a density of 2740 kg/m3was adjusted into the model. This thicker upper crustal unit appears to relate to an outer-wedge geometry in the west, which may partly cor-respond to the northern prolongation of the interpreted Santa Elena High farther south. The latest consists of thick and highly deformed successions of Late Cretaceous to Paleocene sediments [4, 21, 46]. The highly deformed nature of the Late Cretaceous and Paleocene series of the Santa
Trench sediments 80 0 –80 100 0 –100 B o uguer gra vi ty ( m Gal) 50 100 150 200 0 NWA SEA′ D = 2850 S = 0.014 D = 2700 D = 2950 D = 3300 S = 0.011 S = 0.004 S = 0.007 S = 0.008 S = 0.016 S = 0.014 D = 2200 D = 2600 D = 2800 D = 2700 S = 0.006 Trench Sediment wedge Mantle Continental crust? Fig 5-A 0 30 20 10 (a) (b) (c) C
Outer domain Inner domain
T MI-R TP (n T) D ep th (km) = Calculated = Observed = Calculated = Observed Borbón basin Manabí basin Canandé fault Distance (km)
Figure 6: Two-dimensional gravity and magnetic forward models along profile A-A’, between 2°N and 0°. (a) Observed and calculated total
magnetic intensity reduced to the pole (TMI-RTP) across the profile, using the international geomagnetic reference field (IGRF) as the initial parameter listed in Table 1. (b) Bouguer’s gravity observed and calculated anomaly showing very small differences. (c) Geological cross-section with the different blocks constrained by surface geology and deep seismic profiles.
Elena block and the tectonic interaction with the Piñón block (here, the inner domain), this last one acting as a backstop [4], support this outer-wedge model (Figure 7).
The spectral analysis of the total magnetic intensity map indicates that the magnetic anomalies within the inner domain may be originated at different depth levels (Figure 4 and Item DR1). An initial model test with magnetized bodies at medium to shallow depth (<10 km) and susceptibility values between 0.01 and 0.02 SI account partly for the observed magnetic anomalies within the inner domain in profile B-B’ (Item DR3). An alternative interpretation for this initial model may include faults; however, it still requires the presence of highly magnetized bodies. We do not rule out a combined model, where highly magnetic bodies are associated with deep-seated faults.
The long-wavelength component of the magnetic anom-aly has been modeled considering deeper sources, to a depth of 10-15 km (Figure 7). Two different scenarios were consid-ered to match the main gravity low in the east part of the model. The first scenario involves a low-density polygon
located at the base of the oceanic crust representing a frag-ment of the continental autochthonous crust; a low-density polygon is necessary in order to match the gravity low with-out reaching an anomalous high thickness for the accreted plateau rocks. The second scenario (Figure 7) involves a sim-ilar autochthonous polygon with a paleohydrated mantle wedge necessary to match the high positive magnetic anom-aly. This last scenario is the preferred one, together with the presence of continental crust, as supported by the velocity model presented by Lynner et al. [56]. Indeed, partial serpen-tinization of the lower crust or a remnant hydrated mantle wedge may be the source of the positive magnetic and nega-tive gravity anomaly pair (see next section). The magnetic anomaly to the west in profile B-B’ (between 80 and 110 km, Figure 7) is located near to a high to low shear veloc-ity zone according to the model proposed by Lynner et al. [56] (Figure 4). Considering the gravity decrease in this area, the presence of magnetic underplated material or a hydrated mantle wedge seems plausible models. Similar observations are reported across other active margins, with the presence
250 0 100 0 –100 50 0 30 W E B B’ Trench Mantle Continental crust? = Calculated = Observed = Calculated = Observed
Outer domain Inner domain
200 20 10 Domain (a) (b) (c) D = 3200 D = 2805 D = 3250 D = 2405 Mag = 0.5; I = –30; D = 50 D = 2850 S = 0.01 –200 S = 0.70 D = 2900 S = 0.80 D = 2850 D = 2740 S = 0.014 D = 2800 100 150 200 0 Werner deconvolution solutions Dikes Contacts Distance (km) (mGal) D ep th (km) (n T) Fig-5C Manabí basin CCH Mantle wedge? Serpentinized block D = 2800 S = 0.01
Figure 7: Two-dimensional gravity and magnetic forward models along profile B-B’, between 1°and 2°S. (a) Observed and calculated total
magnetic intensity reduced to the pole (TMI-RTP) across the profile, using the international geomagnetic reference field (IGRF) as the initial parameter listed in Table 1. (b) Bouguer’s gravity observed and calculated anomaly showing very small differences. (c) Geological cross-section with the different blocks constrained by surface geology and deep seismic profiles [49, 56]. Density values are shown in the section, and magnetic susceptibility and remanence are listed in Table 1.
of a hydrated mantle wedge underlying a forearc basement of oceanic affinity like in Oregon and East Antarctica [70, 71]. 5.2.2. Southern Suture of the North Andean Sliver to the Continent. To investigate the southern suture between the trapped oceanic sliver and the continental South American Plate, we have integrated the observed tectonic elements of the area and modeled the gravity and magnetic response along profile C-C’ (see Figure 2 for location). The northern-most segment of profile C-C’ (Figure 8) partly crosses the eastern extent of the Chongón-Colonche Hills, which are characterized by surface exposures of the Piñón Formation and by the highest gravity anomaly in the region discussed in the previous section (Figure 3(a)). The high-amplitude gravity anomaly decreases towards the center of the profile
and coincides with the southeastern extent of the Progreso basin (Figure 8). This segment crosses a series of high-magnetic anomalies that were matched by introducing shal-low bodies (0.01 SI) and a deeper source of high magnetic susceptibility (0.07 SI) extending to a depth of ca. 15 km com-parable to profile B-B’.
Towards the south, at the Gulf of Guayaquil (Figure 8), the gravity anomaly drops to a minimum of ca. -120 mGal. A strong lateral contrast in density coincident with the base of the steep gravity gradient was introduced in the model to account for this gradient. Although less constrained than profiles A-A’ or B-B’, the profile C-C’could be divided and analyzed into two main segments: (1) the northern segment characterized by high gravity values as well as long-wavelength magnetic anomalies that extend laterally along
250 0 100 0 –200 50 100 150 200 0 N S C C’ S = 0.015 D = 2750 D = 2300 Continental crust = Calculated = Observed
Southern suture domain
D = 2705 S = 0.016D = 2780 Mag = 0.5; I = –6; D = 60 200 Gulf of Guayaquil Progreso basin S = 0.02 D = 2900 D = 2850 S = 0.02D = 2900 D = 2800 0 30 20 10 40
Jubones fault Raspas Complex
(a) (b) (c) D = 2605 S = 0.01D = 2750 S = 0.015 Mag = 0.55; I = –7; D = 65 T MI-R TP (n T) –250 = Calculated = Observed B o uguer gra vi ty (mGal) D ep th (km) Distance (km) Amotape-Tahuin Massif Inner domain Mantle D = 3300 Chongon-Colonche Hills S = 0.01 S = 0.01 Tear fault D = 2900 S = 0.07 S = 0.02 D = 2750
Figure 8: Two-dimensional gravity and magnetic forward models along profile C-C’, between 2°and 4°S. (a) Observed and calculated total magnetic intensity (TMI) across the profile, using initial parameters listed in Table 1. (b) Bouguer’s gravity observed and calculated anomaly. (c) Geological cross-section with the different blocks constrained by surface geology and seismic profiles. Density and magnetic susceptibility are shown in the section.
the Chongón-Colonche Hills (Figure 4) and (2) the southern segment presenting a gentle southward stepping-uptrend of gravity values and lower magnetic contrasts. In between 90 and 125 km (Figure 8), gravity values increase to ca. -60 mGal staying almost constant up to 180 km, where it increases again up to -20 mGal. At the lowermost gravity point (at ca. 90 km), the SE extend and deepening of the Progreso basin connects to the eastern extent of the Gulf of Guayaquil basin, without any hint on the eastward presence or continuation of the Santa Elena High, as described by Aizprua et al. [4] (Figure 8).
A series of north stepping magnetic highs, in between 120 and 210 km, characterized by steep slopes to the north and gentle gradients to the south (Figure 8) are modeled by a stacked series of blocks probably developed during the Late Cretaceous accretionary phase, later reactivated by exten-sional tectonics. Large basement faults with an extenexten-sional component have been previously reported in this area based on seismic profiles [4, 65, 72]. The southernmost part of the model is constrained by the surface exposure from the Raspas Complex that coincides remarkably well with a high mag-netic peak (at ca. 190 km) and the slight increase in gravity values forming a bell-shaped geometry. In between this area and the Jubones fault (Figure 8), the model isfitted with a block of lower density (2750 kg/m3) comparable to the block south of the Raspas Complex, suggesting that this area might be considered the continuation of the NE of the metasedi-ments from the Amotape-Tahuin Massif or it consists of a transitional zone to the obducted oceanic section (Figure 8).
6. Discussion
The gravimetric and magnetic anomalies in the Ecuadorian forearc show a clear correlation to the crustal exposures across the coastal region. Furthermore, the structural inter-pretation based on the anomaly’s gradients correlates well with their surface expression allowing to extend the interpre-tation to buried areas. The compilation of the different linea-ments interpreted from the spectral analysis of gravity and magnetic anomalies provides clear evidence of a complex crustal architecture (Figure 9), most likely inherited from the Late Cretaceous allochthonous terranes (CLIP)-passive margin collision event.
It is admissible to conceive that the structure of the cur-rent Ecuadorian forearc and part of the arc will depend on the preservation degree of the accreted terranes during the arc-continent collision, which is controlled at thefirst order by the polarity of subduction [12]. A major discrepancy in the precollision settings of the Late Cretaceous arc is related to the subduction polarity. A west-dipping subduction system colliding perpendicular with the South American margin, presented by Vallejo et al. [8], is in accordance with the“forward-facing” arc-continent collision type-1 (the fore-arc collidesfirst) proposed by Draut and Clift [12], which may lead to the preferential preservation of the intraoceanic arc, as observed in the northern part of the Western Cordil-lera. Suggested evidence for a westward polarity includes regional models proposed for volcanic island arcs located in Colombia and farther north in the Caribbean region and
the absence of magmatism older than 85-80 Ma in the Ecua-dorian margin [8]. Nevertheless, alternative models based on tomography and supported by a quantitative plate recon-struction support an east-dipping subduction system in the Northern Andes [1, 9]; a similar polarity has been considered in models across western Ecuador, inferred from a geochem-ical and stratigraphic approach (e.g. [5–7]). Suggested evi-dence for an eastward subduction includes the lack of a clear magmatic gap from the older oceanic plateau lavas (Piñón Fm.) to younger arc lavas, expected during a polarity reversal as proposed by Vallejo et al. [8]. Collision with an eastward polarity is in accordance with the “backward-facing” arc-continent collision type-1 (the back-arc collides first) proposed by Draut and Clift [12], which may lead to the preferential loss of the back-arc system.
6.1. Split of Rio Cala-San Lorenzo Arc and Development of a Marginal Basin? Major block rotation that took place between 70 and 75 Ma probably triggered the initial crustal fragmentation of the forearc area [10]. The series of high magnetic susceptibility sources along the outer domain (Figure 4(b)) appear to correlate with plateau and island arc-associated formations described within the San Lorenzo block (Figure 2) [7, 10]. The coincidental location of the major faults bounding the eastern limit of the M1, M2, and M3 anomalies (the Coastal Range Fault System, see Figure 4) suggests rheological controls on the formation of this major boundary. The patchy and apparent northward change in orientation between the M2 and M3 anomalies, along the Canandé fault, suggests crustal deformation possi-bly accompanied by block rotation. In addition, the lack of continuity between M1 and M2 anomalies (Figure 4) could be explained by a fault-related demagnetization process fol-lowing block fragmentation and strike-slip movements. This area is coincident with the development of the Pedernales basin [45, 73] within the outer domain.
Both the San Lorenzo and Esmeraldas blocks are charac-terized by the presence of volcanic rocks from the San Lorenzo Formation unconformably overlain by middle Eocene rocks, marking a clear stratigraphic hiatus [74]. A stratigraphic gap supports the interpretation of a structural high developed by Late Cretaceous [10, 75, 76]. Furthermore, an oil exploratory well located in the inner domain (Ricaurte-1 in Figure 5) encountered (near its bottom) a series of volcaniclastic deposits (Coniacian to Campanian) that corre-late to the Cayo Formation described farther south along the Chongón Colonche Hills [72, 74, 77]. The on lapping stratal termination pattern of the lowermost seismic unit onto the Piñón acoustic basement suggests that the depocenter and the bounding structural high were coeval with the sedimenta-tion of the Cayo Formasedimenta-tion. Thus, the onset of sedimentasedimenta-tion in the Cayo Formation may have preceded the main accre-tion whereas the upper part is synchronous with the major tectonic event during Late Campanian characterized by clockwise block rotations, between 75 and 70 Ma, recorded by paleomagnetic declination [10, 11] and most likely associ-ated with the main Late Cretaceous accretionary period in Ecuador [6–8]. Although the temporal relationships between the San Lorenzo and Rio Cala arcs are poorly constrained
(especially because of poorly defined ages for the Rio Cala arc; see [8]) the wealth of observations suggests that the outer domain and more specifically the San Lorenzo arc may repre-sent the western section of a split arc. An early separation
between these two arcs may have developed a marginal Late Cretaceous basin, where sedimentation of volcaniclastic deposits of the Cayo Formation took place. It is, however, dif-ficult to conceive the mechanism leading to the formation of
Guayaquil Quito NB MB PEB SLB PB IV ATB JFu Esperanza subbasin 1° N 0° 1° S Carnegie Ridge 2° S 3° S 4° S 79° W 80° W 81° W Outer wedge 0 25 50 100 200 km CCPP: MB: Macuchi block JuF: Jubones fault ATB: Amotape-Tahuin block
Chingual-Cosanga Pallatanga fault Coastal Range Fault System Estancia Magnetic High CRFS:
SLB: San Lorenzo block NB: Naranjal block EMH: ? ? 82° W Inner domain Macuchi/ serpentinized mantle? Outer domain Pallatanga block Continental Sedimentary basin Trench Airborne survey Magmatic intrusions G Lineament by gravity data AM Lineament by magnetic data Suture extension Esmeraldas block Geophysical Bomains Geological Bomains Late Cretaceous suture, vertical tear fault
Figure 9: Crustal model of the Western Ecuador forearc region depicting the different geophysical domains and buried elements derived from the interpretation of combined gravity and aeromagnetic data.
the marginal basin, especially because of doubts about the temporal relationships between the arcs and the subduction polarity during Late Cretaceous. However, the very weak deformation observed at the base of the depocenter, inter-preted here as a marginal basin, suggests that the accreted sliver was most likely transferred to the continental margin with little internal deformation. This last aspect may be inter-preted as a highly preserved sliver because of forward-facing collision. Nevertheless, a weak deformation may also be con-ceivable in the context of a thick accreted sliver colliding in a backward-facing mode and even with a transcurrent accre-tion mode.
At the southernmost part of the inner domain, we found one of the most significant positive and long-wavelength Bouguer anomalies in the northern Andes located along the Chongón Colonche Hills. Feininger and Seguin [15] and this study estimate that a shallow mantle and a thinner crust (down to 7 km locally) are contributing to the anomaly. This may be considered atypical for an oceanic plateau or for an island-arc, as they commonly exhibit thicknesses above 10 km [78]. Recent studies based on seismic tomography put in evidence a high shear velocity zone that correlated very well with this gravity anomaly, confirming the shallow man-tle model (Figure 3). Indeed, farther north, the thickness of the accreted sliver increases and reach values of ca. 15 km (Figure 6). The very significant positive anomaly seems coin-cident in the southern limit of the marginal basin, here related to a possible split of the Rio Cala and San Lorenzo arcs. Therefore, crustal thinning and resulting isostatic man-tle upwelling may well explain this gravity high in the region. Additionally, preliminary petrological analysis on intrusive rocks at the eastern part of the CCH [79] suggests significant denudation in excess of 2-3 km subsequent to the magmatic activity. Nevertheless, this hypothesis needs further verifica-tion, especially regarding the timing of the denudation period and its relationship with better known rotational and accre-tional periods in SW Ecuador.
6.1.1. The Regional Positive Magnetic Anomaly: A Serpentinized Mantle? We propose that a combination of (1) deep-seated faults controlling basalt flow location and (2) disturbances of the underlying mantle possibly through a serpentinization process may have considerably modified the density and magnetic properties of the underlying forearc basement or crustal mantle.
It is widely accepted that at depths of ~40-50 km, the subducting slab releases large amounts of water into the overlying lithosphere producing serpentine [70, 80]. Ser-pentinization can be distributed extensively affecting in some cases the entire forearc mantle [70]. It is known that serpentinization reduces the density of peridotites and pro-duces a residual iron oxide, typically magnetite, which imparts a strong magnetic susceptibility to serpentinites, where its value is proportional to the degree of serpentini-zation and amount of iron derived from source rocks [80, 81]. Magnetic susceptibilities may increase by several orders of magnitude; remanent magnetization may increase by one order whereas density may decrease from ~3000 kg/m3
to ~2500 kg/m3 (e.g., [70, 82]). Therefore,
and as suggested by Blakely et al. [70], long-wavelength magnetic anomalies lacking corresponding positive gravity anomalies may provide evidence to map hydrated mantle in convergent margin settings. Forearc hydrated mantles may also have a strong influence on deformation partition-ing and seismicity at depth [83, 84], and they have been usually discovered by the presence of anomalous low velocities in mantle regions (e.g., [70]).
The long-wavelength component of the anomalies described within the inner domain suggests that part of the anomalies may be originated at great depths. Thus, the very high positive magnetic anomaly (~250 nT) observed at ~180 km in profile B-B’ is not paired with a positive gravi-metric anomaly, although the gravigravi-metric low may be masked by the vicinity of the continental crust. In addition, the presence of small circular anomalies, highlighted by the analytical signal in Figure 4(b), with high magnetic suscepti-bility may suggest the presence of magnetite-rich igneous intrusions built on the accreted and composite sliver. Indeed, the apparent serpentinization of the forearc mantle does not appear to correlate to the modern arc (actually, a high-velocity mantle has been defined in the area; Lynner et al., 2020), and instead, it may be related to ancient plutonism. We suggest that part of the inner domain underlying the crustal mantle may have undergone a serpentinization pro-cess giving rise to this significant magnetic anomaly (Figure 4(c)), most likely coevally with the magmatic intru-sions, which east of the piedmont has been dated between 43 and 25 Ma in the Macuchi block [85]. Similar anomaly patterns have been observed along other active margins that share similar characteristics in terms of forearc sliver accretion, like in Cascadia on the Oregon coast [70], East Antarctica [71], and Japan [86].
The Macuchi block, just east of the inner domain, is char-acterized by a broad volcanic arc region and marked by pulses of adakite-like magmatism [87]. This author attributes the peculiar adakite-like magmas to a process of crustal thickening through the build-up of previous magmatic arcs. Indeed, the hydration of the mantle may have considerably modified the upper crustal structure through the emplace-ment of volcanism and felsic intrusive material such as the intrusives of the Macuchi block [85, 87–89]. The intrusions observed beneath the forearc depocenter, considered together with coeval intrusions outcropping in the Western Cordillera, may possibly represent the wider magmatic arc of the Cenozoic history of the Northern Andes of Ecuador (Figure 10(b)). In this context, the serpentinization process may have played a significant role in the generation of mineral deposits during Late Eocene to Oligocene such as the porphyr-y/epithermal Balzapamba, Chazo Juan, and La Plata deposits. Indeed, the suite of porphyry Cu-Au and epithermal Au deposits, such as those encountered in Ecuador, have been related to water-rich, calc-alkaline magmas originated by partial melting of a hydrated mantle wedge (e.g., [90, 91]). Alternative models for the serpentinization within the inner domain may be related to the obduction process of continental crust [92, 93]. Either process may have led to serpentinization of the mantle and lower crust, diminishing the density and therefore a reduction on the gravity anomaly. This may shed
some light on the up to now disputable Macuchi event (Late Eocene to Oligocene event) in the Ecuadorian geology. 6.2. Esmeraldas Block: Trailing Edge of a Different Accreted Sliver? South of the city of Esmeraldas, the total magnetic intensity map reveals strong negative anomalies oriented in a NE-SW direction, a pattern that differs from those observed along the outer domain (Figure 4). Figure 4(c) shows a deep source (>10 km) contributing to the negative anomaly. The southern limit of the anomaly coincides with the major Canandé fault. This long-wavelength and negative magnetic anomaly appears to extend trenchwards and landwards to the northeast prolonging into Colombia, where a major strike-slip system and a double forearc basin system have been previously described [76, 94]. The Borbón and Tumaco basins in Ecuador and Colombia, respectively, are coincident with the location of the magnetic low, with major basin
development onset by Early Miocene [76]. In Western Ecua-dor, the set of strike-slip duplex appears limited to the Esmeraldas block and northwards into Colombia. The north-ern limit of the magnetic low coincides with the southnorth-ern prolongation of the Buenaventura fault described in Colom-bia. The latter is interpreted as the suture trace between the Gorgona and the Dagua terrane (equivalent to the Piñón ter-rane) [95], both of an oceanic plateau origin. However, paleo-magnetic data from the Gorgona terrane [96] may suggest a different plateau origin compared to the CLIP [97, 98].
Farther north at the edge of the aeromagnetic survey, a slight increase in magnetic susceptibility appears to coincide very well with a decrease in gravity (Figure 3). Furthermore, the outline of a low-velocity zone, inferred from a tomo-graphic model [61], agrees with the gravity/magnetic relation-ship described above. This relationrelation-ship may be attributed to a serpentinization process of mafic rocks, commonly present
Suture 20 km
100 km
Accretion and clockwise block rotation Macuchi arc 20 km 100 km Volcaniclastics (b) (a) 20 km 100 km 0 Ma CPPF CTF CRF B o uguer + – + – 20 km 100 km 70-75 Ma 80 Ma WSW ENE WSW ENE W E WNW ESE SAP FA CLIP 80 Ma TM I R T P Outline airborne survey Esmeraldas block? 43-20 Ma Continental input Mantle hydration H2O Volcaniclastics Cayo San Lorenzo arc? Offscraping Low preservation Rio Cala island arc Late Cretaceous
marginal basin Transform
fault?
Deposition of volcaniclastic material (Cayo Fm).
Trench-rollback and mantle upwelling may have triggered splitting of the arc.
Mantle hydration and renewed arc magmatism emplaced along pre-existing faults, developed during arc splitting.
Mantleup welling
Figure 10: Geodynamic model of the oblique collision between the Caribbean Large Igneous Province (CLIP) and the South America passive margin (Western Ecuador). (a) Plate reconstruction at 80 Ma (modified after [9]). (b) Proposed tectonic evolution of the Western Ecuador subduction system showing an initial west-dipping subduction direction [8]. An alternative model is proposed by [6] controlled by an initial east-dipping subduction direction and a transform fault along the continental margin. Both alternatives are shown in (a). Continous red line after [8] and red dashed line after [6]. FA: Farallon Plate; SAP: South American Plate.

![Figure 3: (a) A combined Bouguer gravity anomaly map, including satellite gravity data [108] outside the outline of the aeromagnetic survey, marked in blue](https://thumb-eu.123doks.com/thumbv2/123doknet/13623916.425839/7.899.97.811.105.680/figure-combined-bouguer-gravity-anomaly-including-satellite-aeromagnetic.webp)