HAL Id: hal-01261396
https://hal.archives-ouvertes.fr/hal-01261396
Submitted on 25 Jan 2016
HAL is a multi-disciplinary open access
archive for the deposit and dissemination of
sci-entific research documents, whether they are
pub-lished or not. The documents may come from
teaching and research institutions in France or
abroad, or from public or private research centers.
L’archive ouverte pluridisciplinaire HAL, est
destinée au dépôt et à la diffusion de documents
scientifiques de niveau recherche, publiés ou non,
émanant des établissements d’enseignement et de
recherche français ou étrangers, des laboratoires
publics ou privés.
Strain partitioning and interplate friction in oblique
subduction zones: Constraints provided by experimental
modeling
A Chemenda, S Lallemand, A Bokun
To cite this version:
A Chemenda, S Lallemand, A Bokun. Strain partitioning and interplate friction in oblique subduction
zones: Constraints provided by experimental modeling. Journal of Geophysical Research. Oceans,
Wiley-Blackwell, 2000, �10.1029/1999JB900332�. �hal-01261396�
JOURNAL OF GEOPHYSICAL RESEARCH, VOL. 105, NO. B3, PAGES 5567-5581, MARCH 10, 2000
Strain partitioning and interplate friction
in oblique subduction zones:
Constraints provided by experimental modeling
A. Chemenda
G•osciences Azur, UMR 6526, Universit6 de Nice-Sophia Antipolis et CNRS, Valbonne, France
S. Lallemand
Laboratoire de G•ophysique, Tectonique et Sedimentologie, UMR 5573, CNRS et Universit6 Montpellier II, Montpellier, France
A. Bokun
Institute of Geology and Geochemistry of Fuel Minerals, Lvov, Ukraine
Abstract. Physical
modeling
of oblique
subduction
is performed
to study
the mechanism
of strain
partitioning.
The model
is two-layer
and includes
the elasto-plastic
lithosphere
(the overriding
and
subducting
plates)
and the low-viscosity
liquid asthenosphere.
The subduction
is driven
by a push
force from a piston
and a pull force when
the density
contrast
Ap between
the subducting
plate and
the asthenosphere
is positive.
We vary both Ap and the interplate
friction
(frictional
stresses).
Slip
partitioning
is obtained
only in the models
with high interplate
friction and only when the overrid-
ing plate contains
a weak
zone.
This zone
in the models
corresponds
either
to locally
thinned
litho-
sphere
or to cut (fault). The horizontal,
trench-normal
component
of the interplate
friction force
[Ffh[
can be comparable
with the absolute
value
of the horizontal
component
of the nonhydrostatic
interplate
pressure
force [Fph
[ in the subduction
zone.
Ffh is always
negative
(compression),
while
Fph
can be either
negative
(compressional
subduction
regime)
or positive
(extensional
regime).
High friction, which promotes
partitioning,
can completely
cancel
the extensional
(suction)
force
Fph.
Back arc tension
and strike-slip
faulting
appear
thus
as conflicting
processes,
although
they
can coexist
in the same
subduction
zone,
depending
on the relative
values
of relevant
forces.
It ap-
pears
that high friction
can exist
only in compressional
subduction
zones
where
partitioning
should
develop
more easily.
This conclusion
is supported
by the comparison
of two oblique
subduction
zones,
having
similar
geometry:
the compressional
southern
Kurile zone
(strong
partitioning)
and
extensional
southern
Ryukyu
zone
(no lithospheric-scale
partitioning).
Other
factors
controlling
the
strain
partitioning
are the length
of the oblique
subductlon
zone,
the boundary
conditions
at the
transverse
limits of the forearc
sliver, and of course,
the obliquity
of subduction.
1. Introduction
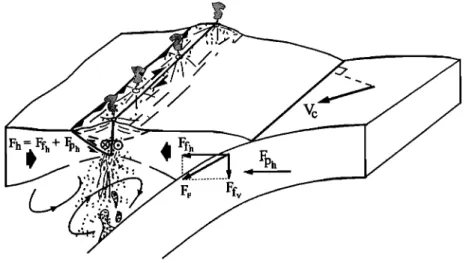
Strain partitioning in subduction zones consists of the accom-
modation of oblique plate convergence by two processes: sub-
duction with lesser obliquity and along-trench translation of the frontal wedge of the overriding plate, the forearc sliver. The
along-trench displacement is accompanied by the strike-slip mo- tion along one or several faults within the overriding plate (Fig-
ure 1). Theoretically, the total strike-slip component should be
proportional to the subduction obliquity angle { [Fitch, 1972]
defined in Figure 1 but certainly depends on other factors as well because there are regions with oblique subduction where no transcurrent faulting is observed (Marianas, for example). What
Copyright 2000 by the American Geophysical Union.
Paper number 1999JB900332. 0148-0227/00/1999JB900332509.00
these factors are and how they influence the partitioning is a subject of discussion in numerous papers [Jarrard, 1O86a;
McCaffrey, 1992; Liu et al., 1995; Lallemand, 1999]. Different
authors propose various, sometimes controversial, explanations of this phenomenon. For example, Fitch [ 19721, Beck [ 1983], and Jarrard [ 1986a] suggest that the partitioning occurs when the
interplate coupling is strong, while Yu et al. [ 1993] and Liu et al.
[1995] reach the opposite conclusion. Liu et al. [ 1995] emphasize the key role of the slab-pull force. Almost all authors agree that the interplate coupling is a basic factor controlling the partition- ing, although this notion does not have a clear physical defini- tion; different "couplings "have been introduced: a "general" coupling [Uyeda and Kanamori, 1979], a seismic coupling [Ruff,
19891, a mechanical coupling [Platt, 19931, and a kinematic cou- pling [McCaffrey, 1992].
Two principal types of observations are used to estimate the partitioning. The first one refers to the study of the transcurrent
faults cutting the overriding plate [Beck, 1991; Wesnousky and Jones, 1994]. Displacement along these trench-parallel faults is a
5568 CHE••A ET AL.: STRAIN PARTITIONING AND INTERPLATE FRICTION
Accretionary
Volcanic wedge
Back arc arc
spreading center ._._ Forearc I
Plate A
Figure 1. General
scheme
of slip partitioning.
Vc is the convergence
velocity
vector
between
plates
A and B; Vp•
and Vp2
are the slip velocity
components
along
the volcanic
arc and back
arc spreading
axis,
respectively;
• is the
convergence
obliquity
angle.
Stars
indicate
the zone
of strong
seismic
coupling.
direct confirmation of strain partitioning. The degree of parti- tioning can be defined as pk = Vp/(Vcsin{), where Vp is the rate of along-trench translation of the forearc sliver, Vc is the conver- gence rate, and { is the convergence obliquity angle I, see Figure 1). Large-scale active shear faults are normally located along weak zones associated with the volcanic arc (e.g. the Kurile arc), with preexisting fault or suture zones in the forearc area (Suma- tra) or with both (Philippines, Sumatra, Kurile, North Island, New Zealand, Aleutians) [Kimura, 1986; Ryan and Coleman,
1992; Diament et al., 1992]. Transcurrent motion of •he arc plate
can also be accommodated through oblique spreading in backarc basins (the Andaman Sea [Curray et al., 1979] and Commander Sea [Baranov et al., 1991]). Smaller-scale, sometimes diffuse, strike-slip faulting has also been observed in accretionary wedges
of the southern Kermadec [Collot and Davy, 1998], Hikurangi
[Barnes and Mercier de Lepinay, 1997], and southern Ryukyu arcs [Lallemand et al., 1999].
Another type of observation, used to reveal and quantify strain partitioning, is the deflection angle ¾ of the interplate seismic slip vector Vs from the convergence vector Vc [McCaffrey, 1992; Yu et al., 1993]. A degree of partitioning ps is defined in this case as ps = 1 - ({ - ¾)/{; ps = 0 corresponds to zero partitioning, and ps =
1 corresponds to complete partitioning. Logically, kinematic pk and seismic ps criteria should be directly related and propomonal. However, this is not always the case, and the use of the slip vec-
tor criterion leads sometimes to controversial conclusions. For example, in Tonga, ps > 1 [Yu et al., 1993], which is inconsistent
with the traditional assumption that convergence vector splits into two components; one oriented between this vector and trench normal and the other parallel to the trench. In other subduction zones (Kamchatka, Ryukyu, or northern Japan), ps < 0, which could be interpreted as transcurrent motion of the forearc sliver in a direction opposite to that predicted by strain partitioning model [Liu et al., 1995]. Value of ps can also lead one to assume a very high partitioning in subduction zones where no strike-slip faults have been revealed at all (the Marianas, for example).
Certainly, there are other factors controlling the ps value be- sides the transcurrent displacement of the forearc sliver. One of
them follows from the fact that in the traditional approach the
plates in subduction zones are considered to be rigid, while in re- ality, they undergo intense internal strain. Subducting lithosphere bends under the overriding plate; this bending accelerates relative sliding of the plates along the interplate surface in the direction perpendicular to the trench. The overriding plate also undergoes deformation not of the strike-slip type. This plate can exhibit
shortening or extending in the back arc to forearc area to a degree which is often underestimated. Recent Global Positioning System (GPS) measurements show, for example, that the northern part of
the Lau Basin is opening at a rate of about 16 crn/yr [Bevis et al..
1995]. The corresponding subduction rate therefore •,eache.: 2•:
crn/yr instead of the 8 crn/yr predicted by NUVEL-1 model [De- Mets et al., 1990]. The opening rate of the southern Okinawa Trough was also neglected in earlier kinematic models [Seno et
al., 1993], which resulted in underestimation of the subduction
rate in the southern Ryukyu by 3-4 crn/yr [Imanishi et al., 1996;
Lallemand et al., 1999]. Not only does the magnitude of the con-
vergence vector have to be corrected, but its orientation has to be corrected as well.
Considering the above remarks, it may be assumed that there is only one reliable criterion to define strain partitioning in a sub- duction zone: the along-trench displacement of the forearc sliver. Such a displacement can be accommodated along active, transcurrent lithospheric-scale faults within the overriding plate and/or along the back arc spreading center.
From the mechanical point of view, the partitioning represents a three-dimensional (3-D) problem. In the present paper we ad- dress this problem based on the results from 3-D experimental modeling of oblique subduction. Both mathematical [Platt, 1993; Braun and Beaumont, 1995] and experimental [,Pinet and Cob-
bold, 1992; Burbidge
and Braun, 1998] modeling
have
been
al-
ready
performed
to study
strain
partitioning.
Usually,
only de-
formation of the overriding plate with some "rigid" boundary conditions along the interplate surface or the lithosphere (crust)
base has been modeled. We model the whole subduction process,
varying the subduction parameters in order to understand a first-
CIq••A ET AL.: STRAIN PARTITIONING AND ]NTEP•LATE FRICTION 5569
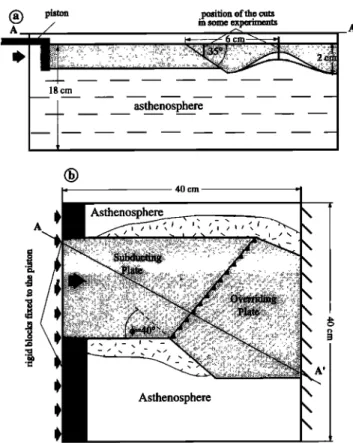
piston
in someposition
experimentsof
the
cuts
18 cm
asthenosphere
40 cm
A /I/ • / • // I
Asthenosphere
Figure
2. Scheme
of the
experiments.
(a) Cross
section
and
(b)
view from above. The thick shaded lines in Figure 2a correspondto the experiments
with vertical
cuts.
The patterned
areas
at the
two sides
of the "lithosphere"
in Figure
2b correspond
to a 1-
mm-thick
layer
of weak
plastic
material
floating
at the surface
of
the "asthenosphere."
This layer,
welded
to the lithosphere,
has
density
0.86
x 103
kg/m
3 and
yield
limit,
-3 Pa.
It serves
to pre-
vent
the liquid
asthenosphere
(water)
from
penetration
onto
the
surface
of the lithosphere
during
subduction
(formation
of the
trench of about 1-mm depth).
2. Experimental
Set-up
and Similarity
Criteria
The scheme
of the experiments
is presented
in Figure
2. Both
the
overriding
and
subducting
plates
are
one
layer
and
are
made
of compositional
systems
consisting
of alloys
of solid
hydrocar-
bons,
mineral
oils,
finely
grounded
powders,
and
small
quantities
of surface-active
substances.
The rheologic
properties
of these
materials
are strongly
temperature-dependent.
The experiments
are
conducted
at a temperature
of around
40øC
at which
the mate-
rials
possess
elasto-plastic
properties
with about
50% strain
weakening.
The values
of the rheologic
parameters
a, th•s
tern-
perature are given in Table 1. •[he composition, physico- chemical, and rheologic properties of these materials are de- scribed in detail by Shernenda [ 1992, 1994].
In all experiments the overriding plate is thinned from below
to simulate a weak zone associated with the volcanic arc. Such a
thinning to about 30 km has been clearly revealed in some real
arcs [Zhao et al., 1994] and follows t¾om thermal [Furukawa,
1993] and petrological [Schmidt and Poli, 1998] models of sub-
duction zones. A thinning and weakening of the plate in the arc area can be caused by a number of factors such as induced con- vection in the mantle and magmatic activity (presence of magma
chambers, and channels).
The lithosphere is underlain by a low-viscosity asthenosphere, which is pure water in the model. The viscous interaction be- tween the lithosphere and the asthenosphere is thus neglected. A justification for such a simplification is that the tangential stress at the lithospheric base is -2 orders of magnitude lower than the
lithosphere effective strength due to low viscosity of the astheno- sphere [Turcotte and Schubert, 1982]. Therefore strain partition- ing (deformation of the overriding plate) is mainly defined by the
stress conditions along the interplate surface. The man-
tle/lithosphere viscous interaction becomes more important with depth. The subduction can be either facilitated or resisted by this
interaction, which corresponds to increase or decrease, respec- tively, in the effective pull force that controls the interaction be-
tween the plates in subduction zone. The pull force Fpl is varied in the experiments and along with the push force produced by a piston drives subduction. The pull force Fpl is proportional to the
density contrast between the subducting lithosphere pl and the asthenosphere pa. The pa value is the same in all experiments, while Pt is either equal to or slightly higher than pa. The density
of the overriding plate is always equal to that of the astheno-
sphere. The yield limit Os of both plates is the same. Two values of the interplate friction have been tested: one was reduced al-
most to zero using lubricators, another was high. To increase the
friction we have used a special adhesive material which was spread on the surface of the subducting plate and on the internal (contact) surface of the overriding wedge. The interplate friction was thus equal to the adhesion or shear yield limit of this material
which is -2 Pa. The initial subduction angle 15 = 35 ø (Figure la) changes during subduction and is -18 ø at shallow depth and -40 ø near the overriding plate base which approximates the average dip of Benioff zones from 0 to 100-km depth [Jarrard, 1986b].
The similarity criteria which are met in this modeling are as follows [Shemenda, 1994]:
Os/(ptgH) = const; p/pa = const; 'ca/Os = const;
const; Vct/H = const. (1)
Here Os is the yield limit of the lithosphere under normal load; Pt and pa are the densities of the lithosphere and the asthenosphere,
Table 1. Parameter Values for the Model and Prototype
Model Prototype Os, Pa H, m Pl, 103 Pa, 103 x n; Pa { V t
k•Jm
3
k•/m
3
24 2 x 10 'z I 1 2 40 ø 10 -4 m/s I min (1.03)2.4 x 10⁸
6 x 10⁴
3.3
3.3
2 x 10⁷
40
ø
10 cm/yr
1.8 Ma
(3.4)The Os is the yield limit for the lithosphere under normal load; pt and pa are the densities of the lithosphere and the astheno- sphere; Xn is the interplate friction stress; •} is the subduction obliquity angle; H is the average thickness of the lithosphere; V is
5570 CHEMENDA ET AL.: STRAIN PARTITIONING AND INTERPLATE FRICTION
subductin&platc
a• ove
'ding
plate
ß
-'::i
i'---.':;•'"""'"":!:";:'";":!..-'i•i
...
'i'.:.:'
....
"'"'"'""':•::'•'•
...
:
....
... ß " ... .... . .... :i...:: .:. '- :. -. ;:'.::. --'"- :-..:: ... '" :'".':•"':":-:'"'- ... :'. ... :.•::-:--;::,.;;;•.½i•.-•:;..;i:.'..;.-..--: ... ... ' ... -.-.:., ... ;- ß ß ß •...:•.=... '. ... - "' •'•'. ... i;'- .... ... -.•..;.?"" "'•'•.•':..•"•:":• "::'::-'-'" ";': ;-J"::":'" ... ':;'--':--:•"":"':*':' '"'.';:.::'::::".. . ... '" • '::;..L•. . . ... ::.};...:...,• ... ,... - . .,,....!. .. .= ...• .•. ':: .. '.. :-:•..: .:. .'.;:?:i,1;:?'%;:..:;;.(" •.•';.•:.;i.;.:•-:;.:':•:.;•.:;.'...:,•' ... --.- '""' .... . ;. .. 5 cm •, ...'•
....
.½!;i?
...
";".:;:i!11.;!:::';;;;.:i'"'•:;:..':..:.,;
.:':.,
... •.!.?; ... •;-.::.•...
...
•:.•:'::::
....
"'.
...
-.:
..?;.:;•
.... .:..•::...
:(.}•
• •?:: ... ..:. ½4•'• ... "• ... ::::•;.• -ß
';;:,.
:.
...
:½•"•:•.:,:;t:;:•,:::?.-.".-:.:•"
,...:.:.Z"%•
.:]•}.;
.-.-%:•5; ...,• --
...-..
.... :,:•
::..,.2.:::•-:•½;: . ....•.....
...••::•..-• ::;;;;
...
-[. ,--•-•.-•-,•i•;•;•:;;-•:;::• ... "- •;: ...Figure 3. Experiment 1 (photographs of the successive stages of the experiment): high interplate friction, dense subducting plate, the overriding plate is thinned in the arc area (see Tables 1 and 2). (a) to (d), view of the model
from the side; (e) to (i), view from above. Here and on the. following figures, the photographs taken in cross section
and in plan view are not synchronous, and the scales in cross section and in plan are not equal.
Table 2. Conditions and Results From the Experiments
Interplate Pt - pa Upper Plate Type of Degree of Patti- h
Experiment Friction Weakeninl• Failure tionin[[ ?k (mm)
N l (Figure 3) High > 0 arc-notch arc thrust 0.63-0.70 5 N2 (Figure 4) low > 0 arc-notch no failure 0 5 N3 (Figure 5) high > 0 arc-cut cut 0.87-1 15
N4 high 0 arc-cut cut 0.9-1 15
N5 (Figure 6) high > 0 Forearc-cut cut 0.46-0.75 15 N6 (Figure 7) low 0 arc-notch arc thrust 0 5 N7 (Figure 8) low 0 arc-notch opposite 0 5
arc thrusts
See Figure 2 for explanation; h is the thickness of the overriding plate in the arc area. Degree of partitioning is defined as pk = Vp/(Vcsin•)), where Vp is the displacement rate along the transcurrent fault in the arc/forearc area; Vc is the convergence rate, and •) is the subduction obliquity angle.
CHE••A ET AL.' STRAIN PARTITIONING AND INTERPLATE FRICTION 5571
respectively; 'lJn is the interplate friction stress; { is the subduction
obliquity angle; H is the average thickness of the lithosphere; g is the acceleration of gravity; Vc is the rate of plate convergence; and t is time. The parameter values adopted for the prototype and the model which satisfy the conditions (1) are presented in Table
1. For more details regarding the properties of the model materi- als, experimental procedure, and scaling, see $hernenda [1992, 1994], who describes similar experiments on orthogonal subduc-
tion.
riding plate is vertically cut along the axis of the "arc." The litho- sphere thickness in the arc is increased to 15 mm (compared to 5 mm in the previous experiments) to avoid the formation of the arc thrust. The friction along the cut is very low. Almost complete (-0.9) partitioning is observed in this experiment from the very beginning: the forearc block moves along the trench with the rate
almost equal to Vc sin {. At the initial stages of subduction the overriding plate is under compression which reduces during ex-
periment to near zero.
3. Results of the Experiments
A total of 40 experiments have been conducted under different conditions. In this paper we describe seven representative ex- periments (see Tables 1 and 2) and summarize the results from
the others.
3.1. Experiment 1
The interplate friction in this experiment is high. The density of the subducting plate is larger than that of the asthenosphere. The overriding plate has a notch (see Figure 2a and Table 2), cor- responding to the volcanic arc area, but is continuous. The thin- ning of this plate was increased progressively from one experi-
ment to another conducted under the same conditions until the
plate failed in the weak zone during subduction. The obtained limit thickness value is h = 5 mm (-25% of "normal" lithospheric thickness), which corresponds to experiment presented in Figure 3. During subduction the thinned area in the overriding plate un- dergoes plastic dextral shear (see bending of the markers on Fig- ures 3f and 3g) and then fails along a trenchward dipping reverse fault (backthrust) with strike-slip component (Figures 3g and 3h). The failure is followed by slip partitioning. The plate conver- gence is now accommodated by less oblique subduction in the main subduction zone, and by thrusting and dextral strike-slip motion along the arc. At the stage in Figure 3h, the total amount of convergence is 5.4 cm, the underthrusting in the arc fault reaches 1.5 cm, and the shear displacement along this fault is 2.7 cm. The underthrusting within the arc then stops, while along-arc displacement of the forearc block continues. A degree of parti- tioning pk (see definition in Table 2) of-0.65 remains constant from the nucleation of the arc fault to the end of the experiment. At the last stages of the experiment the horizontal normal stress
within the overriding plate is close to zero. As the subducting plate is denser than the asthenosphere, the subducted slab finally
breaks off (Figure 3d).
3.2. Experiment 2
The difference of this experiment (Figure 4) from experiment 1 is that now the interplate friction is very low. At the last stages
the overriding plate is under trench-normal tension which is,
however insufficient to fail the plate. There is no partitioning.
3.3. Experiment 3
In this experiment (Figure 5) the interplate friction is high, and the subducting plate is denser than the asthenosphere. The over-
3.4. Experiment 4
The densities of the subducting plate and the asthenosphere are equal. The rest of the parameters are the same as in experi-
ment 3. The result (kinematics) is the same, but the overriding
plate is under constant compression during experiment which is -2 times greater than during the initial stages of experiment 3.
3.5. Experiment 5
The conditions of this experiment (Figure 6) are the same as of experiment 3; the only difference is that the vertical cut is made
in the forearc at a distance of 1 cm (corresponding to -30 km in nature) from the trench. At the beginning of the experiment the
degree of slip partitioning is near 0.75. The shifting, very narrow forearc sliver intrudes the weak material which surrounds the lithosphere (see Figure 2b) and causes some resistance to the sliver motion. At the same time, the interplate friction force de- creases during the partitioning because the length of the sliver, which is in contact with the subducting plate, becomes smaller. These two factors cause the degree of partitioning to reduce to -0.5 during later stages of the experiment.
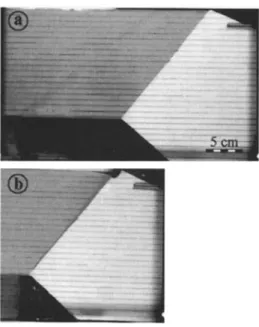
Figure 4. Experiment 2. View from above of initial (a) and final (b) stages of the experiment. Low friction, dense subducting plate
5572 CHEMENDA ET AL.: STRAIN PARTITIONING AND INSULATE FRICTION
cut
Figure 5. Experiment 3: view from above of four experimental stages. High friction, dense subducting plate, the
overriding plate is vertically cut in the arc area (see Tables 1 and 2).
3.6. Experiment 6
The interplate friction is low, the densities of the subducting plate and the asthenosphere are the same, the overriding plate is continuous and is thinned in the arc to 5 mm. During subduction, the overriding plate fails in the arc area along a fault dipping trenchward (backthrust), but there is no partitioning at all (Figure
7).
3.7. Experiment 7
The conditions are the same as in experiment 6, but the over- riding plate fails in a more complex way: there are two faults dip-
ping in opposite direction at different segments of the arc (Figure 8). No partitioning has been observed.
4. Analysis of the Experimental Results
The first direct conclusion following from the presented ex- periments is that partitioning occurs only if the interplate friction
stress Xn is high (experiments 1, 3, 4, and 5). This result has a
simple mechanical explanation. The only force enabling the forearc sliver to move parallel to the trench in our experiments is the friction force which is defined as F = Sxn (S is the square of
the interplate surface). Below we will consider this force per unit length of the plate boundary defined Ff = F/l, where I is the length of the plate boundary (Figure 9). Ff has three components: along-trench component Fft, vertical component Fly, and hori- zontal, perpendicular to the trench component Ffh. They can be
expressed in terms of the obliquity { and the subduction [5 angles
(Figure 9) as
Fft = Ff sin{;
Ffv = Ff cos{ sinIS; (2) Ff h =- Ff cos{• cos[•
(here and below, the horizontal force oriented toward the over-
tiding plate is assumed to be negative). Along-trench translation
of the forearc sliver is caused by the along-trench component of
the friction force Fft. The static equilibrium condition for the sliver is
Fft = Fa + Fc/l + Fell, (3)
where Fa is the force per unit length resisting the shear along the strike-slip fault and Fc and Fe are the boundary forces resisting
the partitioning which are defined in Figure 9. In the conducted
experiments, Fc = Fe -- 0. Therefore the condition for the parti- tioning in the experiments is reduced to
Ef t = Fa (4)
A trivial consequence from the first equation in (2) is that the in- crease in the obliquity angle { promotes the partitioning. In the experiments with vertical lubricated cuts in the arc and forearc (experiments 3, 4, and 5), Fa is very small; therefore the degree of partitioning is very high. In experiments 1 and 5, where strike-
slip motion occurs along the nonlubricated faults forming during
the experiment, Fa is higher; therefore the degree of partitioning
is lower (see Table 2:.
The horizontal compressive force Fh exerted on the overriding plate per unit length perpendicular to the trench is ß
Fh = Ff h, (5)
which is true only when the friction force is the only force acting in the subduction zone and totally controls the interaction be- tween the plates. In fact, along with the tangential (frictional) stress Xn, this interaction is defined also by the normal stress Pn,
CHEMENDA ET AL.' STRAIN PARTITIONING AND INTERPLATE FRICTION 5573 • • ... :• :.•. • • I ':-::: ... : ..'":.'.::"-:-:..,,:.x.-,:':,.'.-:,.•,:; •:i.::;;i::?-::-'-:: cut: . ... • ,:½½ "•"•'•i;::.•.• ' ' .... :::::::::::::::::::::: -:• •:•, .... •"-'-'--'-•-'- - '-'•-•:-2'•'...:
Figure 6. Experiment
5:. view from above
of fore experimental
stages.
High friction,
dense
subducting
plate,
the
overriding plate is vertically cut in the forearc area (see Tables 1 and 2).
which is the interplate pressure (Figure 10). At low IJn, this is Pn
which controls the subduction regime or the stress state of the
overriding lithosphere [Shemenda, 1993]. The regime can be ei- ther extensional or compressional. In the compressional regime the overriding plate undergoes a compression during subduction
and the extensional regime is characterized by tension in the overriding plate (Figure 10b).
The Xn is a deviatoric stress by definition. It is also convenient to introduce a deviatoric or more exactly nonhydrostatic inter-
plate pressure {Jn = Pn- Ph and nonhydrostatic pressure force Fp
Figure
7. Experiment
6: (a) to (c) View
from
the
side
and
(d)
to (f), view
from
above.
Friction
is low,
densities
of
the subducting plate and the asthenosphere are equal, and the overriding plate is thinned in the arc area (see Tables
5574 CHEMENDA ET AL.' STRAIN PARTITIONING AND INTERPLATE FRICTION
Figure 8. Experiment 7: view from above. Friction is low, densities of the subducting plate and the asthenosphere
are equal, and the overriding plate is thinned in the arc area (see Tables 1 and 2).
caused by this pressure (Ph = -Ptgz is the hydrostatic pressure, and z is defined in Figure 10a). The horizontal component of Fp
is (Figure 10)
H
Fph
= • (JndZ'
(6)
o
where
H is the thickness
of overriding
wedge.
Considering
this
force, (5) can be rewritten
Fh = Ff h + Fp h (7)
Fph can be either compressive (negative) or extensional (positive) depending on the On value. The vertical component of the pres-
sure force Fpv is oriented
upward
or downward,
respectively
(Figure 10). This force component produces either nonisostatic
uplift (Figure 10a) or subsidence (Figure 10b) of the forearc area. The nonisostatic relief formed in this way generates high free-air
gravity anomalies Ag. The subduction regime thus can be related to the gravity anomalies [Shemenda, 1985, 1993, 1994]: The compressional regime is characterized by high positive gravity
anomalies in the forearc and the extensional regime by negative
Figure 9. Forces in an oblique subduction zone. Vc is the convergence velocity; { is the obliquity angle; 13 is the
average
subduction
angle;
Xn
is the interplate
friction
stress;
Ff is the interplate
friction
force
per unit length
of the
plate boundary; Ffv, Fft, and Ff h are the vertical, trench-parallel, and horizontal (normal to the trench) components
of the friction force, respectively;
I is the length
of the considered
segment
of oblique
plate boundary
(of the
forearc/arc sliver); Fc and Fe are the compressive and the extensional forces, respectively, acting at the transverse borders of the segment (sliver); x is the tangential stress along the strike-slip fault; and Fa is the force caused by this
CHE••A ET AL.: STRAIN PARTITIONING AND INTERPLATE FRICTION 5575
Ag $mGal
(,•
300[
x_•
100
f
• •
Fp
i•--}Fpv
_ 1Ag
mGalFigure 10. Two regimes of oceanic subduction [Shemenda,
1994]. (a) Compressional regime corresponding in the experi- ments to Ap = Pl- Pa = 0 (pl is the subducting lithosphere density, p.• is the asthenospheric density). (b) Extensional regime corre- sponding to Ap > 0 (see text for details). Ag is the free-air gravity anomaly; Pn is the interplate pressure; Fp is the nonhydrostatic pressure force caused by nonhydrostatic interplate pressure Pn- Ph (Ph is the hydrostatic pressure); Fpv and Fp h are the vertical and horizontal components of this force, respectively; Fpl is the pull force due to the positive density contrast Ap. and H is the
thickness of the overriding plate.
or small positive anomalies (Figure 10). Of course, Ag in sub- duction zone is not only defined by the lithospheric deformation. The isostatic relief component also affects the gravity field but much less than the nonisostatic component. For example, 100 m of short-wavelength (--100 km) underwater isostatic relief gener- ates -60 times lower free-air gravity anomaly than the same nonisostatic relief. Gravity signature of 1-km isostatic relief is almost 10 times smaller than of the same nonisostatic relief [Tang et al., I999]. Ag depends also on the gravity etl•ct of the sub- ducted slab and the mantle dynamics. Both, however, are charac- terized by a small contribution to Ag amplitude and a large wavelength. For example, the anomaly caused by the subducted slab has -1000-km wavelength and a few tens mGal (or less) magnitude [Watts and Talwani, 1975]. We are dealing with -100-km wavelength anomalies with several tens to more than 100 mGal amplitude (Figure 10). Therefore in 2-D approximation
the absolute Ag value in the fore arc is roughly proportional to
the horizontal stress in the overriding lithosphere. For example, if
in the extensional regime the overriding plate fails completely (back arc spreading is started), then this plate cannot maintain the extensive stress anymore and it can even undergo a compression due to the back arc ridge push force. Thus the presence of back arc spreading does not necessarily mean that the arc plate is under horizontal extensive force and hence that the interplate pressure should be small. If the interplate pressure is not reduced com- pared to the hydrostatic pressure, then there will be no
nonisostatic
displacement
in the forearc
and hence
no associated
gravity
anomaly
It sh•u!d
be noted
tha• t•.• •elatiov
between
t¾:
gravity anomalies and the •tress •n tl•e l•tho•phere 0ecomes more complex in zones of continental subduction where low-density continental crust of variable thickness subducts to great depth [Tang et al., 1999].In the experiments the nonhydrostatic interplate pressure (•n is controlled by the density contrast Ap = Pi- pa and the length of the subducted plate, but in nature it depends on other factors as
well, such as the direction of asthenospheric currents, and the di- rection of motion of the overriding plate in the "absolute" refer- ence frame (relative horizontal motion of the subducted litho-
sphere and the surrounding mantle) [see Shemenda, 1993; and references herein]. If Ap > 0, Fph is zero or positive (extensional regime). This is the case in experiments 1, 2, 3, and 5. In experi-
ment 2 the friction is low, and therefore the pressure force Fp
completely defines the stress state of the overriding plate: This plate is under tension, but the tensional stress is not sufficient to
fail a 5-mm-thick (in the thinned zone) overriding plate. This
plate fails if it is thinned
to about
3 mm which
results
in back arc
opening
(see experimental
results
reported
by Shernenda
[1993,
1994]). In experiments 1, 3 and 5 the pressure force is the same
as in experiment
2, but the friction
force
is added.
The horizontal
component
of this force Ffh completely
suppresses
the horizontal
component of the pressure force Fph. The overriding plate there- fore fails in experiment 1 (Figure 3) mainly under the along- trench component of the tYiction fmce Ff t (mere is some compres• sion as well). This component then causes the slip partitioning.
If Ap _<
0, FPh
is negative.
The subduction
regime
is alway•
compressional whatever the interplate friction is. This regime is realized in experiments 4, 6, and 7. In experiments 6 and 7 the
friction is zero; therefore the stress state of the overriding plate is
completely defined by the interplate pressure force. The horizon- tal component of this force Fph is sufficient to fail a 5-mm-thick overriding plate (see Figures 7 and 8), but there is no partitioning
because the friction force is low. High-friction force in the com-
pressional (experiment 4) as well as in the extensional (experi-
ments 1 and 5) subduction regimes results in the partitioning. Ex-
periment 7 (Figure 8) shows also that the overriding plate can fail along either of two opposite directions. According to 2-D ex- perimental [Chemenda et al., 1997] and numerical [Tang et al., 1997] modeling the direction of failure is defined by two pa-
rameters, the distance L between the trench and the failure loca-
tion (the arc), and the interplate friction stress Xn. If Xn is zero (the case of experiments 6 and 7) and L is more than some critical value, the fault dips landward, and if less, it dips in the opposite direction, trenchward. The mechanism for "switching" the mode
of failure with variation of L and Xn is associated with the flexural
rigidity of the overriding plate and the wavelength of its bending.
The critical L value was estimated to be -200 km [Chemenda et
al., 1997; Tang et al., 1997] which corresponds to the average trench-arc distance in the subduction zones. This value was as-
5576 CHE••A ET AL.: STRAIN PARTITIONING AND INTERPLATE FILICTION
sumed to calculate L for the models presented above (L = 6 cm,
see Figure 2a). Therefore both failure directions are possible un-
der conditions of experiments 6 and 7. In fact, these details of
plate failure are probably not very important for the phenomenon
of partitioning in reality, since the volcanic arc is characterized
not only by thinned lithosphere [Zhao et al., 1994] but also by the presence of magma channels. In other words, this lithosphere ß is already very weak [Sant Blanquat et al., 1998] and partly cut
along subvertical surfaces connecting magma conduits filled with hot (molten) material which provides low friction. Such a situa- tion corresponds best to experiments 3 to 5 with the vertical lu- bricated cut where partitioning occurs without thrusting. The lithosphere in the arc is thicker in these experiments than in the others and horizontal compressive force Fh (see equation (7)) is
not sufficient
to cfiuse
it to fail. According
to (4) partitioning
should occur in this situation even if interplate friction is low. In reality there are two other forces Fc and Fe (see equation (3)) re-
sisting the partitioning. It is these forces along with the subduc-
tion obliquity and the complete interplate friction force (equal to Ff x l, see Figure 9) which should control the lithospheric-scale
strain partitioning.
To test the above analysis, we have chosen two comparatively simple examples: the southern Kurile and the southern Ryukyu
subduction zones characterized by compressional and extensional
regimes, respectively; one with clearly expressed lithospheric- scale strain partitioning and another without it.
4.1. Southern Kurile Arc
This zone is characterized by high positive free-air gravity anomaly Ag which reaches a maximum of more than +250 mGal in the frontal arc along the Lesser Kurile Islands and their under- water continuation, the Vityaz Ridge (Figure 11). The Kurile vol- canic arc with much higher topography is marked by Ag less than +200 mGal [Sandwell and Smith, 1997]. Hence the subduction regime in this zone is compressional (see Figure 10a). According to the NUVEL-1 model [DeMets et al., 1990], the subduction obliquity in the southern Kurile zone is not very high, 27 ø (Figure
11). Despite that, slip partitioning exists in this region and has
been nicely documented by Kimura [ 1981, 1986]. The -800-km- long and 200-km-wide forearc sliver is moving to southwest at. the rate of 6 to 11 mm/yr [DeMets, 1992] which yields pk = 0.22 _+ 0.07 (pk changes with time, and this estimate is very approxi- mate). The northeastern sliver boundary corresponds to the Bus- sol Strait which is described as a graben. The southwestern ter- mination of the sliver corresponds to the wide zone of southwest vergent thrusting within Hokkaido Island (Figure 11). The northwestern border of the sliver corresponds to a transcurrent
fault which passes along the volcanic arc [Kimura, 1986]. The
boundary conditions for the sliver are thus kinematically self- consistent. The interplate friction force in this area should be very high and sufficient not only to overcome the resistance along the
48' N 46' 44' 42' Hokkaid½
Sea of Okhotsk
•6'
o
X cø•/d•
'
\ 27 ø
Pacific
Ocean
142'
146'
150'
154'E
Figure 11. Geodynamic
setting
of the southwestern
Kurile arc. Faults
are from Kimura
[1986], relative
conver-
gence
vector
from DeMets
[ 1992].
The backthrust
position
is based
on the structural
and seismicity
data
from
Ba-
CHE••A
ET AL.: STRAIN PARTITIONING
AND INSULATE FRICTION
5577
Figure 12. Scheme
for the estimation
of the cross-sectional
sur-
face of the forearc silver.
strike-slip
fault but also
to cause
the forearc
block
to fail in two
places,
at southern
and
northern
ends
of the sliver.
Let us make
an estimation of the friction force, staying within the simple
rheologic
model
used in the present
modeling.
Assuming
the
thickness
of the overriding
wedge
H = 60 km, its average
strength
os = 2 x 10⁸
Pa, the average
subduction
angle
I• = 30 ø, the obliq-
uity angle
{ = 27 ø, and the length
of the sliver
I = 800 km, we
obtain
(see
Figure
12) Fc = Fe = •sH2cot
[• = 1.24
x 1018
N. From
(3) we haveFf t = 2Fc + Fa. (8)
For simplicity, let us neglect the friction force Fa along the vol-
canic arc. In this case the horizontal component of the friction
force perpendicular to the trench will be (see equation (2))
Ffh
= - Fft cot
{ cosl•
=-5.26
x 10
•2
Pa m
(9)
The corresponding friction stress is Xn = 50 MPa, which is in agreement with heat data-based estimates of this parameter incompressional
Japan
subduction
zone:
75 +_
20 MPa [Molnar
and
England, 1990] and 16-31 MPa [Tichelaar and Ruff, 1993]. The maximal value for the horizontal component of the pressure force FPh which characterizes the compressional regime of oceanic subruction at Ap = 0 is defined by Shernenda [ 1994] to be around
-4 x 10
•2 Pa m based
on the previous
modeling.
A similar
value
(3.6 x 10
•2 Pa m) follows
from
experiments
6 and 7 presented
in
this paper. The total horizontal compressive force per unit length
according
to (7• thus
is Fh = -9.26
x 10
•2 Pa m, i.e., of the
order
of 1013
Pa m. In the experiments
corresponding
to this
case
(high-
pressure
force and high-friction
force) the overriding
plate fails
along
the thrust
even
if it is >1 cm (but <1.5 cm) thick in the arc.
Such a failure seems to be occurring in the Kurile arc as shown in
Figure
13. It has
been
proposed
that the active
thrust
fault
behind
the Kurile arc (Figure 11) corresponds
to an incipient
subduction
zone [Baranov and Lobkovsky, 1980]. However, there is no strike-slip displacement along this fault. Such a displacement oc-
curs directly
along
the arc which thus corresponds
to the forearc
sliver border. Hence there are two major faults in this area: the
thrust fault behind the arc which accommodates part of the nor-
mal component
of the plate
convergence,
and the strike-slip
fault
along
the arc, which
accommodates
a shear
displacement
(Figure
13).
The obtained value of the interplate friction force for the Ku-
rile arc (see
equation
(9)) corresponds
rather
to the minimal
esti-
mation
of this parameter
as we neglected
the resistance
along
the
transcurrent fault. Therefore the F.f• value can be s..'.ill
Knowledge
of the exact
Ffh value is not very important
for the
compressional
subduction
regime
because
both
forces
Ffh and FPh
are compressive,
but it becomes
very important
for the exten-
sional
regime
where
Fph
is extensional.
It was found
in previous
modeling
[Shemenda,
1993] that the maximal
value of IFphl
in
this case is comparable to, but less than, that for the compres-
sional
regime
(<3 x 10¹²
Pa m). Therefore
the interplate
friction
force estimated for the Kurile zone (9) would completely sup-
press
the extensional
force
Fph
if it would
exist.
The interplate
friction stress in the extensional Mariana subduction zone is es-
timated to be Xn -- 18 +_ 8 MPa based both on the mineralogi-
cal/heat data [Maekawa et al., 1993] and the force balance analy- sis [Bird, 1978]. The corresponding horizontal compressive force
is Ffh
= (1.5-2.7)
x 1012
Pa m which
is less
than
the extensional
suction
force FPh indicated
above; the back arc extension
is
therefore
possible
in the Mariana
zone.
The situation
when
the
interplate
friction force completely
suppresses
the extensional
force Fph corresponds
to the late stages
of experiments
1 and 3
where the overriding
plate is characterized
by neutral/slightly
comp?essional
stress
state.
To enable
the back arc rifting, the
friction should be lower. Reduction of the friction in the Kurilezone would
stop
the partitioning.
In other
words,
a subduction
zone geometrically
similar
to the Kurile arc but where
the over-
riding plate is under
tension
should
be characterized
by lower
Figure
13. Compressional
subduction
regime
and
high
interplate
friction
in an oblique
subduction
zone.
The
over-
riding
plate
fails
along
the thrust
fault
dipping
under
the arc
from
the rear).
The partitioning
occurs
along
the arc
axis.
Fi: is the
component
of the
friction
force
Ff (shown
in Figure
9) parallel
to the
interplate
surface
and
normal
to
5578
CHEMENDA
ET AL.: STRAIN
PARTITIONING
AND INTERPLATE
FRICTION
interplate
friction
and hence
by the absence
of the lithospheric-
scale partitioning. A good example of such a subduction zone could be the southern Ryukyu arc, which we consider below.
Relative
to the southern
Kurile arc, this zone has comparable
length
l, average
subduction
obliquity
q•,
and similar
geometrical
setting, suggesting similar "resistive" conditions at the transverseboundaries of the possible forearc sliver.
4.2. Southern Ryukyu
The positive
anomaly
Ag in the Ryukyu
arc is very low, less
than +80 mGal and in the forearc
area
has a high negative
value
less
than
-200 mGal [Sandwell
and Smith,
1997].
The model
pre-
dicts thus that overriding plate is under high tensional stress
[Shemenda,
1994],
which
is supported
by the available
geological
and geophysical data [Letouzey and Kimura, 1986; Sibuet et al.,
1995]. According
to Seno
et al. [1993] the obliquity
of the con-
vergence
at southern
termination
of the Ryukyus
is q•
= 50 ø (Fig-
ure 14), but recent
GPS data [bnanishi
et al., 1996] provide
a
smaller
value,
around
40
ø [Lallemand
and Lui, 1998].
The obliq-
uity decreases to the northeast and reaches near 20 ø at a distance
of l = 800 km from
Taiwan.
The average
obliquity
of this seg-
ment is between
25 ø and 30 ø
. The geometric
and kinematic
set-
ting thus is roughly similar to those in the Kurile zone. GPS
measurements indicate a displacement of the Ryukyu arc south-
eastwards
with respect
to Asia at a rate of a few centimeters
per
year [Imanishi et al., 1996], instead of southwestward, whichshould
be the case if lithospheric-scale
slip partitioning
would
occur. Detailed swath mapping of the region [Sibuet et al., 1995; Lallemand et al., 1997, 1999] did not reveal any indication of
transcurrent faulting neither in the Ryukyu arc nor in the Oki-
nawa Trough. Trancurrent faulting is observed only within the accretionary prism. No E-W shortening has been detected at the western edge of the Ryukyu Arc near Taiwan; this shortening would exist if strain partitioning were present. On the contrary, GPS data even reveal some E-W extension in this area [Yu et al., 1997]. Summarizing the above information, we conclude that there is no lithospheric-scale partitioning in the southern Ryukyu arc, which is consistent with our prediction: the interplate friction
in the Ryukyu zone is much lower than in the Kurile zone (is near
10 MPa), which enables back arc rifting but "inhibits" strain par-
titioning.
5. Conclusions
The interaction between the plates in subduction zone is de-
fined by normal
(pressure)
Pn and tangential
(frictional)
stresses
along the interplate surface. Shemenda [1985] has shown that if
27' N 25' 23'


![Figure 10. Two regimes of oceanic subduction [Shemenda, 1994]. (a) Compressional regime corresponding in the experi- ments to Ap = Pl- Pa = 0 (pl is the subducting lithosphere density, p.• is the asthenospheric density)](https://thumb-eu.123doks.com/thumbv2/123doknet/13622291.425691/10.954.108.465.96.635/figure-subduction-shemenda-compressional-corresponding-subducting-lithosphere-asthenospheric.webp)
![Figure 11. Geodynamic setting of the southwestern Kurile arc. Faults are from Kimura [1986], relative conver- gence vector from DeMets [ 1992]](https://thumb-eu.123doks.com/thumbv2/123doknet/13622291.425691/11.954.146.807.595.1067/figure-geodynamic-setting-southwestern-kurile-faults-kimura-relative.webp)