HAL Id: hal-01424422
https://hal.archives-ouvertes.fr/hal-01424422
Submitted on 10 May 2021HAL is a multi-disciplinary open access archive for the deposit and dissemination of sci-entific research documents, whether they are pub-lished or not. The documents may come from teaching and research institutions in France or abroad, or from public or private research centers.
L’archive ouverte pluridisciplinaire HAL, est destinée au dépôt et à la diffusion de documents scientifiques de niveau recherche, publiés ou non, émanant des établissements d’enseignement et de recherche français ou étrangers, des laboratoires publics ou privés.
Linking small pelagic dietary shifts with ecosystem
changes in the Gulf of Lions
Pablo Brosset, Baptiste Le Bourg, David Costalago, Daniela Bănaru,
Elisabeth van Beveren, Jean-Herve Bourdeix, Jean-Marc Fromentin, Frédéric
Ménard, Claire Saraux
To cite this version:
Pablo Brosset, Baptiste Le Bourg, David Costalago, Daniela Bănaru, Elisabeth van Beveren, et al.. Linking small pelagic dietary shifts with ecosystem changes in the Gulf of Lions. Marine Ecology Progress Series, Inter Research, 2016, 554, pp.157-171. �10.3354/meps11796�. �hal-01424422�
1
Please note that this is an author-produced PDF of an article accepted for publication following peer review. The definitive publisher-authenticated version is available on the publisher Web site.
Marine Ecology Progress Series July 2016, Volume 554 Pages 157-171
http://dx.doi.org/10.3354/meps11796 http://archimer.ifremer.fr/doc/00347/45822/
© Inter-Research 2016 · www.int-res.com
Achimer
http://archimer.ifremer.fr
Linking small pelagic dietary shifts with ecosystem changes
in the Gulf of Lions
Brosset Pablo 1, 2, *, Le Bourg B 3, Costalago D 4, Bănaru Daniela 3, Van Beveren Elisabeth 2, Bourdeix Jean-Herve 2, Fromentin Jean-Marc 2, Ménard F 3, Saraux Claire 2
1 Université de Montpellier, UMR MARBEC (IRD, Ifremer, UM, CNRS), 34203 Sète cedex, France 2 IFREMER, UMR MARBEC (IRD, Ifremer, UM, CNRS), 34203 Sète cedex, France
3 Mediterranean Institute of Oceanography (MIO), Aix-Marseille Université/CNRS/IRD/Université de
Toulon, UM 110, 13288 Marseille, France
4 Department of Ecology, Environment and Plant Sciences, Stockholm University, 10691 Stockhom ,
Sweden
* Corresponding author : Pablo Brosset, email address : pablo.brosset@ifremer.fr
Abstract :
Since 2008, a severe decrease in size and body condition together with a demographic truncation has been observed in the sardine (secondarily in anchovy) population of the Gulf of Lions (NW Mediterranean Sea). In parallel, sprat biomass, which was negligible before, has increased tenfold. All of these changes have strongly affected the regional fisheries. Using trophic and isotopic data from contrasting periods of low versus high growth and condition, we investigated potential changes in diet and interspecific feeding interactions through time. Evidence of resource partitioning was found between sprat and both anchovy and sardine in 2004 and 2005. Since 2010, the isotopic niches of the 3 species have tended to overlap, suggesting higher risk of competition for food resources. Moreover, the wider trophic niche of sprat indicates higher variability in individual diets. Anchovy and sardine diet varied through time, with a high proportion of large copepods or cladocerans in periods of high growth and condition (1994 and 2007, respectively) versus a dominance of small copepods in the present (2011-2012). Furthermore, an important reduction in prey diversity was also identified in the diet of both anchovy and sardine during the most recent period. Our results support the hypothesis that changes in small pelagic fish growth, size and body condition and ultimately biomass could be due to bottom-up control characterized by changes in food availability and increasing potential trophic competition.
1. INTRODUCTION
Small pelagic fish species are characterized worldwide by important temporal fluctuations of their
abundance and biomass, generally ruled by environmental changes in marine ecosystems
(Schwartzlose et al. 1999, Alheit & Niquen 2004). Bottom-up control, driven by changing ocean
conditions was therefore often argued as the main hypothesis to explain these regime shifts (Cury &
Shannon 2004), but changes in plankton quantity and quality is difficult to confirm due to a lack of
sufficient observations of the planktonic community in both time and space.
In the Gulf of Lions, sardine (Sardina pilchardus, W. 1792), anchovy (Engraulis encrasicolus, L. 1758)
and sprat (Sprattus sprattus, L. 1758) the three main small pelagic species, act as a critical link
between planktonic production and top predators (Bănaru et al. 2013). Additionally, anchovy and
sardine support pelagic trawling and purse seine fisheries (between 30 and 50% of the total landings
in this area, Bănaru et al., 2013), making them both ecologically and economically essential
(Palomera et al. 2007). During the last decade, a decrease in size and body condition was observed
for anchovy and sardine while at the same time, sprat biomass which had been negligible before,
increased tenfold (Van Beveren et al. 2014). These changes made sardine and anchovy commercially
less interesting, so that landings dropped dramatically, reaching their lowest values in 150 years for
sardines (Van Beveren et al. 2016). Surprisingly, the recruitment has remained high and these
modifications primarily affected the adults, with a disappearance of older age classes, especially for
sardine (Van Beveren et al. 2014, Brosset et al. 2015).
Such changes in the small pelagic fish community are far less common than changes in recruitment
and might result from selective pressure from fishing or natural predation or modifications in prey
availability and/or quality. Yet, fishing pressure does not appear to be the main driver of these
changes, as these populations were/are not overfished (GFCM 2014) and exploitation rates have
remained low over the last 2 decades (i.e. at around 10 to 20% in average without exceeding 40%,
of those small pelagic fish in this area, has been recently evaluated to be < 2% (Van Beveren et al.
submitted), indicating that a top-down control is unlikely. While predation due to natural predator or
fishing remained at low levels for these species, body condition in sardine and anchovy has been
shown to be strongly affected by mesozooplankton abundance (Brosset et al. 2015), advocating for a
bottom-up control as the most probable source of small pelagic fish changes in the NW
Mediterranean. Unfortunately, plankton records are scarce in the Gulf of Lions, and no time series is
currently available to test for such a bottom-up control.
Stomach content analyses and stable isotope analyses (SIA) are two of the main approaches for
investigating feeding habits and trophic interactions (Darnaude et al. 2004, Post et al. 2007). Stomach
content analyses document recently consumed food items and permit a quantitative and qualitative
snapshot of the diet (Hyslop 1980). SIA are complementary to stomach content analyses and allow
obtaining an integrated measure of the assimilated food over the previous months depending on the
variability of prey and their stable isotope ratios, the fractioning and the isotopic turnover. Values of
δ15N may be related to the trophic level of an individual, while the δ13C ratio indicates the primary
production sources, that is, the different feeding environments (coastal/oceanic, pelagic/benthic)
used by consumers (Vander Zanden & Rasmussen 1999, 2001). Combining stomach content analyses
and SIA has become an effective tool to investigate changes in trophic structure. Hence, their joint
use contributes to the further understanding of how an ecosystem may be affected by changes in
interspecific interactions (Caut et al. 2006).
Several studies have provided important information on feeding habits and diets of these 3 species in
the Gulf of Lions (Plounevez & Champalbert 2000; Costalago et al 2012; Costalago and Palomera
2014; Pethybridge et al. 2014; Le Bourg et al 2015). However, they were usually limited to one
species or a given period, so that the investigation of potential temporal changes along the last 15 to
20 years is still missing. The aim of this study was to investigate the hypothesis that recent changes
changes. In this study, we propose to investigate changes in the feeding habits between periods of
contrasted growth and condition (before and after 2008) defined by Van Beveren et al. (2014). In
particular, isotopic interspecific overlap, trophic niche width and prey type were examined through
time. Indeed, knowing that sardines, sprats and anchovies strongly co-occur in terms of spatial
distribution in the Gulf of Lions (Saraux et al. 2014), trophic overlap between species might result in
food competition if resources become limited (Hardin 1960). Moreover, the niche width, i.e. an index
of prey diversity estimated through the range of δ15N and δ13C values or Shannon’s diversity may be
used to determine how generalist a population might be in terms of diet and feeding areas
(Newsome et al. 2007). Finally, prey species composition might have a strong effect on the energy
intake of predators (Beaugrand et al. 2003, Blanchard et al. 2012).
2. MATERIAL AND METHODS 2.1 Study area
The Gulf of Lions (42°26’-43°40’N and 3°00’-5°27’E; Fig. 1) is located in the North Western
Mediterranean Sea and is characterized by a large continental shelf (Millot 1990). Shallow waters
between 0 and 200 meters associated with Rhône river discharge and coastal upwelling due to
Northern winds support high productivity, making it one of the most productive areas of the
Mediterranean Sea (Minas & Minas 1989, Lefevre et al. 1997). A decreasing trend in the
concentration of nutrients exists from East to West and from coastal to deeper waters (Bănaru et al.,
2013). The particulate organic matter and phyto- and zooplankton communities at the base of the
food webs show inter annual, seasonal and spatial variations in terms of composition and stable
isotope ratios inside this area (Darnaude et al. 2004, Bănaru et al. 2014, Espinasse et al. 2014). These
variations may be related to the terrestrial and anthropogenic river inputs, to currents and wind
communities in terms of species composition and size classes (Rau et al. 1990, Harmelin-Vivien et al.
2008, Bănaru et al. 2014).
2.2 Sample collection
Fish and zooplankton samples were collected during MERLUMED and Pelagic Mediterranean
(PELMED) scientific surveys during the summer under a similar protocol. Fish were sampled with a
pelagic trawl with a small-mesh cod-end (mesh length 5 mm, ISO 1107) and towed at an approximate
speed of 4 knots over 30 min periods. All specimens were selected randomly from hauls and their
standard length was determined to the nearest mm, as well as their mass (to the nearest g) and sex.
Numerous stations were sampled each year in the Gulf of Lions (i.e inshore/offshore, West and East)
to cover the complete area (Fig 1.) and to avoid bias of interannual differences due to spatial
heterogeneity. In 2004, 2005 and 2014, zooplankton was sampled using a vertical WP2 net (200 μm
mesh size) at each trawl station (4 stations in 2004 and 2005 and 10 in 2014, respectively).
Zooplankton samples were stored in frozen sea water to be used for SIA as bulk. Using a combination
of previously published data (Costalago et al. 2012, Le Bourg et al. 2015) and new samples that were
analyzed for this study, stable isotope values were available for June and July of 2004, 2005, 2008,
and 2010-2014 (except for sprat in 2008 which was not sampled). Stomach content data were
available in 2011-2012 for both anchovy and sardine (previously published data; n = 118 & 104 for
sardine and anchovy respectively; Le Bourg et al 2015) as well as prior to population changes: in 2007
for sardine (n=156; Costalago et al. 2014) and in 1994 for anchovy (n=50, unpublished).
2.3 Stable isotope analyses
Fish isotope analyses were conducted on a piece of ~1 cm3 of white muscle that had been kept
frozen at -80°C (Sweeting et al. 2005).
Both fish white muscle and zooplankton samples were freeze-dried during 48h and grounded into a
(La Rochelle, France). An acidification step was necessary for zooplankton samples to remove any 13
C-enriched carbonates (DeNiro & Epstein 1978). A subsample was acidified with 1% of HCl, rinsed with
distilled water and dried to determine the δ13C ratio while an untreated subsample was used for δ15N
analysis. Three zooplankton replicates were performed from each sampled site for both δ13C and
δ15N. A continuous-flow isotope ratio mass spectrometer (Delta V Advantage, Thermo Scientific)
coupled to an elemental analyzer (Flash EA1112, Thermo Scientific) was used to perform stable
isotope measurements. Results were expressed in parts per thousand (‰) relative to Vienna PeeDee
Belemnite and atmospheric N2 for δ13C and δ15N, respectively, using the equation:
δX = ((Rsample/Rstandard) - 1) x 103
where X is 13C or 15N and R is the isotope ratio 13C/12C or 15N/14N, respectively. Replicate
measurements of internal laboratory standards (acetanilide) indicated a precision of 0.2‰ for both
δ13C and δ15N values.
Variation in lipid content among fish species can introduce a bias in carbon stable isotope analyses
(Post et al. 2007). Therefore, the potential effect of lipids on δ13C values of fish samples was
corrected by applying the procedure of (Post et al. 2007) when the C/N ratio was >3.5 (which was
mainly the case for sprat). Thus, the time and uncertainty due to lipid extraction were reduced. For
all years, fish length ranges were kept similar (from 10 to 15 cm, Table 1.) to avoid any bias due to
ontogenetic changes.
2.4 Stomach content analyses
A similar protocol was applied on all analyses of stomach contents regardless of the year (see details
in Costalago and Palomera, 2014; Le Bourg et al., 2015). Briefly, fish were frozen at -20°C
immediately after being caught to stop digestive processes. Then, the gut was removed and stored
into alcohol (95%) at the laboratory. Each stomach was carefully opened and all prey species were
placed in a Petri dish and identified and quantified under a stereo microscope to the lowest possible
statistical analyses. A single difference in protocol occurred, as fish were analysed individually in all
years except for sardines in 2007, for which fish of a given station were pooled together, i.e. between
16 and 20 stomachs were pooled together. In that case the associated sardine length corresponded
to the mean length of all individuals from a given sample. Prey dry weight was derived from
literature (see Le Bourg et al., 2015).
Prey importance was assessed using the percentage of occurrence (%O, proportion of stomachs
where the prey species was found), percentage in number (%N, ratio between the number of one
prey species and the total number of prey), percentage in dry weight (%DW, ratio between the
weight of one prey species and the total weight of prey). These percentages were then combined to
calculate the Index of Relative Importance (IRI, Pinkas et al. 1971), necessary to compute the %IRI,
which allows an integrated comparison between dietary items of the same species (Hyslop 1980,
Cortés 1997):
∑
where IRI = %O x (%N + %DW) and n is the number of prey species. Because of potential disparities in
species or groups of species names between 1994 and 2011-2012, we carefully linked all prey names
to current species name. Due to a lack of correspondence between periods, few species were not
retained. However these species/groups of species, all had very low %IRI (< 0.2%), so that their
absence could not significantly affect the computation of %IRI and trophic niche width (see below).
The trophic niche width was measured for each period, using the exponential of Shannon’s entropy,
N1 = exp(H), where H is the Shannon-Wienner diversity index: ∑ ( ) and pi is the
2.5 Data analyses
Determinants of isotopic values
To investigate the potential effect of species, year, fish length, latitude, longitude and
coastal/offshore gradient on δ13C and δ15N values, we used the Classification And Regression Tree
(CART) approach of Breiman et al. (1984). Decision trees were built by recursively partitioning our
dataset into increasingly homogeneous subgroups of isotope values. Each split is defined by a simple
rule based on a single explanatory variable, and each final group is characterized by its mean isotope
values. Two separate CARTs were applied for fish δ13C and δ15N values. As less stations and years
were sampled for zooplankton, we only tested annual differences in δ13C and δ15N to look for
interannual variability (2004, 2005 and 2014) using one-way analyses of variance (ANOVA).
Isotopic niches
Standard ellipse areas corrected for small sample size (SEAc,Jackson et al. 2011), which define the
isotopic niche space of 40% of typical individuals within the group based on bivariate normal
distributions, were calculated as a measure of the mean core population isotopic niche in order to
analyze resource partitioning among species over time. However, because both the shape and size of
the area filled by the points influence this estimate, we first scaled isotope values as recommended
by Cucherousset & Villéger (2015) to obtain an informative assessment of isotopic overlap. Then,
niche overlaps between the different species were determined using SEAc. Niche overlap varied
between 0 (no overlap) and 1 (one species is included in the other species stable isotope space).
Additionally to niche overlap, the size of standard ellipses was also compared between species and
between years for each species. To do that, bayesian standard ellipse areas (SEAB) were calculated,
which allowed for robust statistical comparisons. In addition, the probability of Bayesian ellipses,
which were larger or smaller relative to the compared group was computed (e.g p, the proportion of
ellipses in 2011 that were lower than 2012, see Jackson et al. (2011) for more details). We considered
were smaller than those of another group (Turner et al. 2010). Estimation via Bayesian inference
allowed to make robust comparisons among data sets comprising different sample sizes (Syväranta
et al. 2013).
Temporal variation in stomach contents
To describe the temporal variations in stomach contents of anchovy and sardine, we applied a
principal component analysis (PCA), which is a multivariate analysis of individuals’ stomach contents
in function of prey using a correlation matrix. For each predator species, only prey constituting > 2%
of %IRI in at least one of our data subsets were considered for the analysis, except for non-identified
copepods. Empty stomachs were excluded from this analysis. To deal with different sampling
strategies for sardine stomach contents between 2007 and 2011/2012, the 8 stations of 2007
(representing each between 16 and 20 individuals) were weighted by the number of corresponding
individuals in the PCA analysis. The PCAs were performed on the dry weight (%DW) of the different
prey ingested for each individual. Similar results were obtained when PCAs were performed on the
proportion of frequency (%N), showing the robustness of these results.
All statistical analyses were performed with R version 3.0.2. Values are indicated as mean ± standard
error (SE) and all statistical tests were performed at a significance level of 0.05. All data were tested
for normality and heteroscedasticity using Kolmogorov-Smirnov and Levene’s tests.
3. RESULTS
3.1 Factors influencing isotope values
Fish size, nitrogen and carbon stable isotope ratios were determined for 330 anchovies, 327 sardines
and 236 sprats (Table 1. & Fig 2). Using a CART analysis, 85% of the variability in the δ 13C values were
significantly explained by the variables year and species, whereas spatial locations of capture inside
retained (Fig 3a). The year variable had the greatest effect, and δ13C values were mainly split
accordingly (Fig 3a). First, the maxima for 2004 and 2005 were separated from all other years. In this
small group, a secondary partition separated high δ13C sprat values from anchovy and sardine values.
From all remaining years (2008 to 2014), the years 2010 and 2011 showed the most negative values,
especially for sprat (Fig 3a). Years 2008, 2012, 2013 and 2014 had intermediate δ13C values, with no
differences between the three species studied. Between 2004 and 2014, the δ13C isotope values of all
three species decreased progressively, but less for sardine and anchovy (-2‰) than for sprat (-3‰)
(Fig 2).
According to the CART, 39% of the variability for the δ 15N signal was accounted for by year and
species variables (Fig 3b). In 2005 and 2011 to 2013, δ15N values were lower for anchovy and sprat in
comparison to sardine (Fig 3b). In contrast, during all others years (2004, 2008, 2010 and 2014),
sardine and sprat had more similar δ15N values than anchovy. Only in anchovy in certain years did
other variables affect isotope values. Indeed, anchovy values in 2004, 2008, 2010 and 2014 also
depended on the sampling location, in particular the longitude, with lower values in the East.
Moreover, in the Western part during those years, anchovy δ15N values increased with size (Fig 3b).
However, even if year was significant in the CART analysis (Fig 3b), during our study period only a
slight difference in trophic levels was observed for any species (δ15N range), with no clear temporal
trend (Fig 2).
Similarly to fish, the δ13C values of the bulk of zooplankton were higher in 2004 and 2005 in
comparison to 2014 (ANOVA, p< 0.001) while δ15N values remained stable over time (ANOVA, p>
0.05; Fig.A.1).
3.2 Temporal changes in isotopic niche overlap
Figure 4 displays the bayesian ellipse areas (SEAC) that represent the isotopic niche of the three small
pelagic species in a scaled isotopic niche space. Two patterns were observed: firstly, sprat was
the overlap of sprat isotopic niche on sardine’s was present until 2014 (Table 2.). Sprat also
overlapped strongly with anchovy in 2012 and 2013, but no clear temporal trend was evidenced
(Table 2.). In contrast, the trophic niche overlap of sardine and anchovy was high in 2004 and 2005
(Table 2.). In 2008, the total anchovy niche even fell within the one from sardine. However, during
the subsequent years (2010-2014), overlap was much lower except for 2013 (at least halved
compared to before 2010, Table 2.). For each species, the isotopic location of the SEAc differed
among years (Fig 4).
3.3 Temporal changes in isotopic niche width
The niche width of the three species varied notably between years (Fig 2.). The anchovy isotopic
niche width decreased between 2004 and 2008 (SEAB: P <0.001) and then increased to remain steady
at middle values (SEAB: P >0.05, Fig 2.). The sardine isotopic niche width also decreased between
2004 and 2005 (SEAB: P <0.001), but increased between 2005 and 2008 (SEAB: P <0.01) to then
decrease again in 2010 (SEAB: P <0.01) and finally remain steady until 2014 (SEAB: P >0.05, Fig 2.). The
isotopic niche width of sprat decreased between 2004 and 2010 (SEAB: P <0.01) and subsequently
increased and stabilized from 2011 to 2014 (SEAB: P >0.05, Fig 2.). In 2010 and 2013, the SEAB width
was similar between all three species (SEAB: P >0.05, Fig 2.). On the contrary, during years 2004,
2005, 2011, 2012 and 2014, sprat always had a larger SEAB than sardine and anchovy (SEAB: P <0.05,
Fig 2.). Thus, sprat always had a larger or equivalent isotopic niche width when compared to anchovy
or sardine. In 2008, when only two species were available, sardine SEAB was significantly larger than
the anchovy one (SEAB: P <0.001).
3.4 Size, area and temporal variations in diet composition
The diet of sardine and anchovy was mainly zooplanktivorous, with some traces of phytoplankton
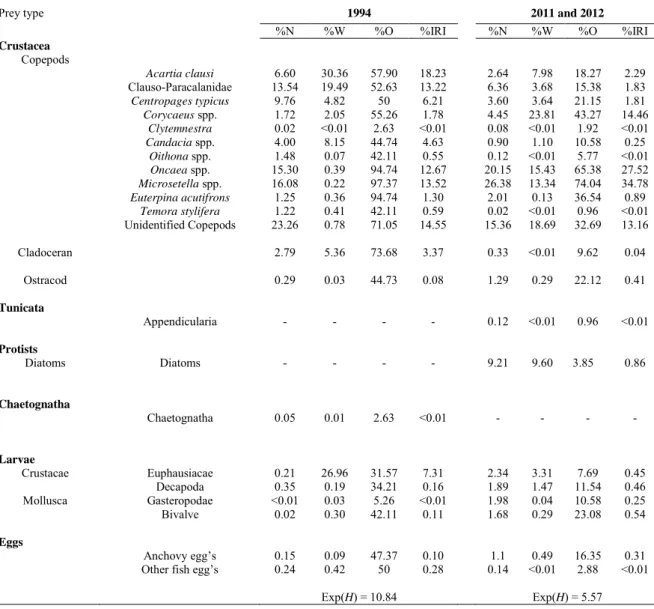
consumption (diatoms) in 2011-2012 for both species (see Tables 3 and 4). The anchovy diet in 1994
was characterized by the dominance of Acartia clausi (18.23 %IRI), Microsetella spp (13.52 %IRI),
(Table 3). Copepods also dominated the anchovy diet in 2011-2012, but anchovy fed almost only on
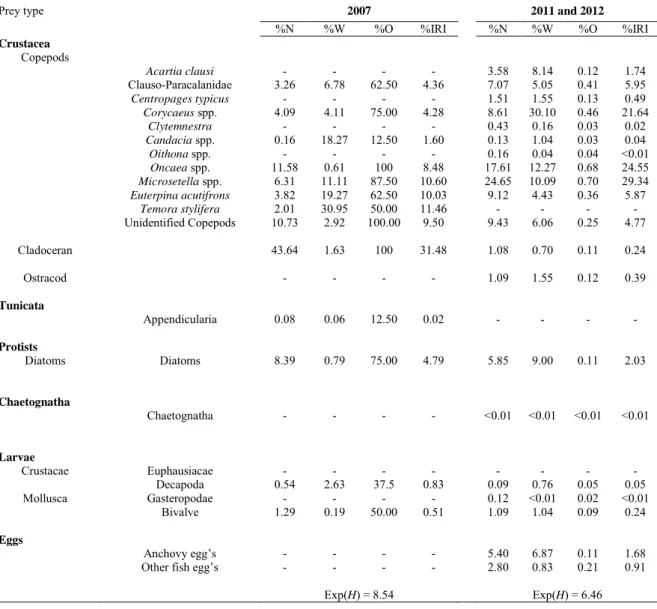
two species: Microsetella spp (34.78 %IRI) and Oncaea spp. (27.52 %IRI). In 2007, sardine diet was
composed of copepods (60.31 %IRI, mainly Euterpina acutifrons, Microsetella spp. and Temora
stylifera) and cladocerans (31.48 %IRI). In contrast, cladocerans were almost absent in 2011-2012,
while Microsetella spp. (29.34 %IRI), Oncaea spp. (24.55 %IRI) and Corycaeus spp. (21.64 %IRI)
dominated the sardine diet (Table 4). For both sardine and anchovy, we also found a strong increase
in the proportion of Corycaeidae during years 2011 and 2012.
The trophic niche width, measured with the exponential of Shannon’s entropy was highest in the
earliest period studied for both species (10.84 in 1994 versus 5.57 in 2011-2012 for anchovy (Table
3), and 8.54 in 2007 versus 6.46 in 2011-2012 for sardine, see Table 4).
In the PCA performed on the dry weight (%DW) of the different prey of anchovy, the first (F1) and
second (F2) component represented respectively 35% and 25% of the total variance (Fig 5). F1
represented a gradient whereby Oncaea spp was opposed mainly to Acartia clausi and
Clauso/Paracalanidae species. F2 represented a gradient opposing Microsetella spp to Acartia clausi
and Clauso/Paracalanidae species in anchovy diet. The majority of anchovy from 1994 had negative
values on both axes while the majority of anchovy from 2011-2012 had positive values. Thus, we
deduced an increasing proportion in dry weight of Microsetella spp and Oncaea spp and a decreasing
proportion of Acartia clausi and Clauso/Paracalanidae species in the anchovy diet from 1994 to
2011-2012 (Fig. 5). In the PCA carried out on the sardine data, F1 and F2 represented 44% and 18% of the
total variance respectively (Fig 6.). Microsetella spp was opposed to Oncaea spp, Corycaeus spp and
cladocerans on F1 axis, while the second axis showed a clear separation between the cladocerans
and other prey species. The two time periods were opposed on the second axis reflecting a
decreasing gradient of cladocerans and an increasing proportion of Oncaea spp, Corycaeus spp and
from 10 to 16 cm) as well as sampling area (3 areas; West, Central and East) were plotted on the PCA,
but both factors displayed no trend.
4. DISCUSSION
Data availability does not allow us to describe the trophic ecology along the last 20 years, but we can
contrast the present situation to data collected before the drastic changes in demography occurred.
The comparison of small pelagic trophic data: (i) showed wider isotopic niche in sprat compared to
sardine and anchovy; (ii) tended to confirm the hypothesis of changes in the anchovy and sardine
diets and (iii) suggested a recent increase in the trophic overlap between the different small pelagic
fish species of the Gulf of Lions.
Using SIA and isotope-derived metrics to study interspecific trophic differences, we showed that
sprat had a larger isotopic niche width (in 2004, 2005, 2011, 2012 and 2014) than sardine and
anchovy or at least equivalent (in 2010 and 2013), mainly due to the broad range of δ13C. Assuming
that wider sprat isotopic niche reflects higher variability in individual diets (Matthews & Mazumder
2004), sprat intraspecific trophic competition may be lower than those of other species. Additionally,
stomach content analyses tended to indicate a slightly more diversified sprat diet (Le Bourg et al.
2015). These results are particularly interesting from a population dynamics viewpoint. Indeed, sprat
biomass has considerably increased since 2008, while the ratio biomass/abundance of both sardine
and anchovy has considerably declined (GFCM 2015). Previous studies have shown that those
changes were mainly driven by reduced growth, age truncation and condition and bottom-up
processes were the most likely drivers (Van Beveren et al. 2014). Being a generalist feeder with low
intraspecific food competition might thus have conferred important advantages to sprat over sardine
and anchovy, especially to adapt to environmental changes. This might also explain why sprat body
condition was more stable, while sardine and anchovy condition exhibited stronger ups and downs,
This study also depicts a considerable reduction in both sardine and anchovy isotopic niche through
time. The carbon isotopic composition of fish muscle is mainly related to the ingested preys (Hobson
1999). As previously stated, strong changes in δ13C values of small pelagic fish and zooplankton were
observed along years. Differences between years in fish stable isotope values may be due to
inter-annual differences in the planktonic community and/or the organic matter, the latter being at the
basis of the food web. The Gulf of Lions is further known as a highly variable area in water
circulation, productivity and stable isotope ratios of plankton community (André et al. 2005,
Espinasse et al. 2014), which could add variability in fish isotopic signature. Yet, similarly to previous
findings obtained with a different methodology (e.g fatty acid profiles, Pethybridge et al. 2014), we
showed that isotopic values did not differ between sampling areas except for δ15N in anchovy during
some years, underlining the weak influence of the sampling area on the isotopic values at the scale of
the present study. This allows us to reasonably assume that differences were not due to sampling
bias, even if the sampling locations varied from year-to-year. A reduction of the anchovy isotopic
niche was observed between 2004 and 2013, although the largest shrinkage occurred between 2004
and 2005. Nevertheless, this considerable change in isotopic niche area between the two years has
to be considered with caution, due to the lower sampling size in 2005 in comparison to 2004 which
reduces the precision of the estimated mean of niche width (see Syväranta et al. 2013). The largest
reduction in sardine isotopic niche was observed between 2008 and 2013, concomitantly with the
decrease in sardine size, condition and biomass.
Moreover, stomach contents also confirmed a significant reduction in the trophic niche width of both
anchovy and sardine (25% and almost 50%, respectively). Specifically, both species displayed a much
narrower diet during recent years (2011-2012) compared to previous time periods (1994 or 2007).
This might have resulted from a decrease in the availability of certain prey species, downplaying their
role in the diet of the small pelagics, as indicated by temporal differences in composition and size
range of consumed prey. The sampling methodology has been kept as consistent as possible during
related to variables such as year, area and fish size. However, no size class or sampling area effects
were detected during analyses, so that observed changes are likely to be due to a year effect. For
adult anchovy and sardine, copepods were, as in most other studies in the Mediterranean (see
Tudela & Palomera 1997, Borme et al. 2009, Nikolioudakis et al. 2012), by far the most important
prey item, regardless of the year. However, there was a prey size reduction between both periods. In
1994, large copepods (size >1 mm, Acartia spp., Candacia spp., Clauso/Paracalanus spp. and
Centropages typicus), attained almost 50% of the relative importance index (%IRI) and 65% in relative
dry weight (%DW). This contrasted with 2011-2012 years when they represented barely more than
5% of the relative importance index and 15% in relative dry weight (Le Bourg et al., 2015). Large
copepods in the anchovy diet were replaced in 2011-2012 by small copepods species (size <1 mm,
such as Coryceidae, Microsetella spp. and Oncaea spp.), which increased threefold. The proportion of
small and large copepods in 1994 was in agreement with another study from 1995 and 1996,
performed in the same area and during the same period (Plounevez & Champalbert 2000). Marked
changes between 1994 and 2011/2012 in the anchovy diet also concerned other prey groups, such as
cladocerans that became practically absent in recent years, larvae (mainly Euphausiacea) that also
decreased while diatoms appeared. The decrease of large Euphausiacea larvae, recognized as
important anchovy prey in other areas such as the Humboldt current (Ayón et al. 2011), might have
accentuated the deficiency in large prey species.
Similarly, small copepods dominated sardine diet in recent years, while cladocerans were the
dominant prey in 2007. Assuming that larger copepods have a higher energy content (Dumont et al.
1975, Vijverberg & Frank 1976, Zarubin et al. 2014), current nutritional conditions of anchovy and
sardine might have thus strongly decreased compared to pre-2008, potentially explaining the strong
demographic changes observed in both species after 2008. Furthermore, fish were sampled in July,
when adults need to accumulate their fat supply to survive the next winter (Wiegand 1996,
Sánchez-Gómez 2013). Therefore, the lack of large copepods in their stomachs could reflect difficulties to
reproduce at that moment. This might thus explain the apparent adult overmortality detected for
sardine (less pronounced for anchovy, Van Beveren et al. 2014). However, in order to better
understand the impact of the changes in sardine and anchovy diet, a detailed investigation of
zooplankton variations in terms of quantity/quality and fish energetics would be required.
Nonetheless, considering the usual importance of large copepods in the diet of anchovy and sardine,
these changes probably reflect a potential decrease in their availability, which might result either
from an increase in competition between fish species or a decrease in abundance of large copepods.
First, the increase in sprat abundance and biomass might have drawn more intensive interspecific
competition. Indeed, all three species have been shown to inhabit the same areas and to spatially
co-occur in the Gulf of Lions, except for some deeper grounds where only anchovy co-occurs (Saraux et al.
2014).
The hypothesis of an increased interspecific competition during the last decade is supported by the
changes in the degree of overlap and segregation in the isotopic niches of the fish species. Indeed,
there was clear isotopic niche segregation between sprat and the two other species in 2004 and
2005, indicating that sprat could have exploited different species groups from anchovy and sardine
during these still prosperous years. On the contrary, sprat diet has overlapped significantly with
anchovy and/or sardine diet since 2010. Conversely, the overlap between anchovy and sardine was
strong in 2004, 2005 and 2008, but was nearly inexistent in 2010, 2011, 2012 and 2014. These stable
isotope analyses are in accordance with stomach content analyses, which also provided evidence for
potential strong competition between sprat, sardine and anchovy (Le Bourg et al. 2015). So, this
study underlined the importance of new food sharing in the context of the recent increase of the
sprat population. The special case of 2013 might be caused by very limited food resources
(quantitatively or/and qualitatively), forcing the three species to highly exploit prey species with
Second, beyond prey size spectrum changes, we also showed the decreasing richness of small pelagic
fish diet with time. This result was in agreement with observed and modeled changes in the
composition and the phenology of zooplankton in Mediterranean areas surrounding the Gulf of Lions
(Balearic Sea: Auger et al., 2014; Puelles and Molinero, 2008; Ligurian Sea: Molinero et al., 2008,
2005). Recent low prey diversity and small prey sizes suggest that recent environmental changes
affected the planktonic production. This study, despite some missing values in some years, showed a
decreasing trend in δ13C values for zooplankton. This is also in agreement with other studies, which
underlined similar isotopic values in 2010 and in 2014, and most importantly strictly lower values in
2010 than in 2004 and 2005 (Bănaru et al., 2013; Espinasse et al., 2014; Strady et al., 2015). Although
isotopic variations may result from a multitude of drivers, strong differences documented in this
study could support important changes in the planktonic community and/or in the organic matter
sources. Auger et al., (2014) showed that climatic and environmental variations may induce changes
in size structure of the plankton community, while Rau et al., (1990) showed that small
phytoplankton (pico and nano phytoplankton) had lower δ13C values than micro phytoplankton.
Interestingly, possible reduction in δ13C values for zooplankton between 2004/2005 and 2010
correspond to the period of the drastic changes in small pelagic fish populations (Van Beveren et al.
2014). As already observed in the Benguela ecosystem, where shifts between anchovy and sardine
regimes were caused by changes in the availability of mesozooplankton prey mediated through
changes in environmental conditions (Shannon et al. 2004), growth and condition of sardine and
secondarily anchovy in the Gulf of Lions are also likely to be mediated by a bottom-up control.
CONCLUSION
This study supports the hypothesis that changes in small pelagic fish growth, size and body condition
could be due to a bottom-up control characterized by changes in food availability or/and increasing
potential trophic competition, two other factors that might influence the feeding success and the
a combination of short (stomach content) and longer term (SIA) indicators. This not only helps to
understand the current ecosystem fluctuations in the Gulf of Lions, but also provides an insight in the
trophic dynamics of the pelagic ecosystem, possibly allowing a more efficient monitoring of marine
food-web evolution.
Acknowledgements
The authors are grateful to the captain and the crew of RV “L’Europe”, as well as all the scientists
onboard for their assistance during PELMED surveys. PELMED surveys are co financed by Europe
through the Data Collection Framework. The authors express their thanks to Isabel Palomera for
providing Spanish data, Mireille Harmelin-Vivien for comments on previous works, Gaël Guillou for
performing stable isotope analyses and Virginie Marques for artwork help. This research was partly
funded through the EcoPelGol project (Study of the Pelagic ecosystem in the Gulf of Lions), financed
by France Filière Pêche (FFP) and partly funded through PERSEUS (Policy-oriented marine
Environmental Research for the Southern EUropean Seas) financed by FP7 EU project, EMIBIOS
(End-to-end Modelling and Indicators for BIOdiversity Scenarios) financed by FRB (Fondation pour la
Recherche et la Biodiversité) and IPP (Intéractions plankton – planctonophages) financed by WP2
MERMEX (Marine Ecosystems Réponse dans l'Expérience de la Méditerranée). PB acknowledges
doctoral fellowship support from the French Ministère de l’Education Nationale, de la Recherche et
de la Technologie.
References
Alheit J, Niquen M (2004) Regime shifts in the Humboldt Current ecosystem. Progress in Oceanography 60:201–222
André G, Garreau P, Garnier V, Fraunié P (2005) Modelled variability of the sea surface circulation in the North-western Mediterranean Sea and in the Gulf of Lions. Ocean Dynamics 55:294–308 Auger PA, Ulses C, Estournel C, Stemmann L, Somot S, Diaz F (2014) Interannual control of plankton
communities by deep winter mixing and prey/predator interactions in the NW Mediterranean: Results from a 30-year 3D modeling study. Progress in Oceanography 124:12–27
Ayón P, Swartzman G, Espinoza P, Bertrand A (2011) Long-term changes in zooplankton size distribution in the Peruvian Humboldt Current System: conditions favouring sardine or anchovy. Mar Ecol Prog Ser 422:211–222
Bănaru D, Carlotti F, Barani A, Grégori G, Neffati N, Harmelin-Vivien M (2014) Seasonal variation of stable isotope ratios of size-fractionated zooplankton in the Bay of Marseille (NW
Mediterranean Sea). J Plankton Res 36:145–156
Bănaru D, Mellon-Duval C, Roos D, Bigot J-L, Souplet A, Jadaud A, Beaubrun P, Fromentin J-M (2013) Trophic structure in the Gulf of Lions marine ecosystem (north-western Mediterranean Sea) and fishing impacts. Journal of Marine Systems 111–112:45–68
Bearhop S, Adams CE, Waldron S, Fuller RA, Macleod H (2004) Determining trophic niche width: a novel approach using stable isotope analysis. Journal of Animal Ecology 73:1007–1012 Beaugrand G, Brander KM, Alistair Lindley J, Souissi S, Reid PC (2003) Plankton effect on cod
recruitment in the North Sea. Nature 426:661–664
Blanchard JL, Jennings S, Holmes R, Harle J, Merino G, Allen JI, Holt J, Dulvy NK, Barange M (2012) Potential consequences of climate change for primary production and fish production in large marine ecosystems. Phil Trans R Soc B 367:2979–2989
Borme D, Tirelli V, Brandt S, Fonda Umani S, Arneri E (2009) Diet of Engraulis encrasicolus in the northern Adriatic Sea (Mediterranean): ontogenetic changes and feeding selectivity. Marine Ecology Progress Series 392:193–209
Breiman L, Friedman JH, Olshen RA, Stone CJ (1984) Classification and Regression Trees. Chapman and Hall, London
Brosset P, Ménard F, Fromentin J, Bonhommeau S, Ulses C, Bourdeix J, Bigot J, Van Beveren E, Roos D, Saraux C (2015) Influence of environmental variability and age on small pelagic fish body condition in the Gulf of Lions. Marine Ecology Progress Series
Brosset P, Menard F, Fromentin J, Bonhommeau S, Ulses C, Bourdeix J, Bigot J, Van Beveren E, Roos D, Saraux C (2015) Influence of environmental variability and age on the body condition of small pelagic fish in the Gulf of Lions. Mar Ecol Prog Ser 529:219–231
Caut S, Roemer GW, Donlan CJ, Courchamp F (2006) Coupling stable isotopes with bioenergetics to estimate interspecific interactions. Ecological Applications 16:1893–1900
Cortés E (1997) A critical review of methods of studying fish feeding based on analysis of stomach contents: application to elasmobranch fishes. Can J Fish Aquat Sci 54:726–738
Costalago D, Navarro J, Alvarez-Calleja I, Palomera I (2012) Ontogenetic and seasonal changes in the feeding habits and trophic levels of two small pelagic fish species. Mar Ecol Prog Ser
460:169–181
Costalago D, Palomera I (2014) Feeding of European pilchard (<em>Sardina
pilchardus</em>) in the northwestern Mediterranean: from late larvae to adults. Scientia Marina 78:41–54
Cucherousset J, Villéger S (2015) Quantifying the multiple facets of isotopic diversity: New metrics for stable isotope ecology. Ecological Indicators 56:152–160
Cury P, Shannon L (2004) Regime shifts in upwelling ecosystems: observed changes and possible mechanisms in the northern and southern Benguela. Progress in Oceanography 60:223–243
Darnaude AM, Salen-Picard C, Polunin NVC, Harmelin-Vivien ML (2004) Trophodynamic linkage between river runoff and coastal fishery yield elucidated by stable isotope data in the Gulf of Lions (NW Mediterranean). Oecologia 138:325–332
DeNiro MJ, Epstein S (1978) Influence of diet on the distribution of carbon isotopes in animals. Geochimica et Cosmochimica Acta 42:495–506
Dumont HJ, Velde IV de, Dumont S (1975) The dry weight estimate of biomass in a selection of Cladocera, Copepoda and Rotifera from the plankton, periphyton and benthos of continental waters. Oecologia 19:75–97
Espinasse B, Harmelin-Vivien M, Tiano M, Guilloux L, Carlotti F (2014) Patterns of variations in C and N stable isotope ratios in size-fractionated zooplankton in the Gulf of Lion, NW
Mediterranean Sea. J Plankton Res 36:1204–1215
GFCM (2014) Report of the working group on stock assessment of small pelagic species, p39. Hardin G (1960) The competitive exclusion principle. Science 131:1292–1297
Harmelin-Vivien M, Loizeau V, Mellon C, Beker B, Arlhac D, Bodiguel X, Ferraton F, Hermand R, Philippon X, Salen-Picard C (2008) Comparison of C and N stable isotope ratios between surface particulate organic matter and microphytoplankton in the Gulf of Lions (NW Mediterranean). Continental Shelf Research 28:1911–1919
Hill MO (1973) Diversity and Evenness: A Unifying Notation and Its Consequences. Ecology 54:427– 432
Hobson KA (1999) Tracing origins and migration of wildlife using stable isotopes: a review. Oecologia 120:314–326
Hyslop EJ (1980) Stomach contents analysis—a review of methods and their application. Journal of Fish Biology 17:411–429
Jackson AL, Inger R, Parnell AC, Bearhop S (2011) Comparing isotopic niche widths among and within communities: SIBER – Stable Isotope Bayesian Ellipses in R. Journal of Animal Ecology 80:595–602
Layman CA, Arrington DA, Montaña CG, Post DM (2007) Can stable isotope ratios provide for community-wide measures of trophic structure? Ecology 88:42–48
Le Bourg B, Bănaru D, Saraux C, Nowaczyk A, Le Luherne E, Jadaud A, Bigot JL, Richard P (2015) Trophic niche overlap of sprat and commercial small pelagic teleosts in the Gulf of Lions (NW Mediterranean Sea). Journal of Sea Research 103:138–146
Lefevre D, Minas HJ, Minas M, Robinson C, Le B. Williams PJ, Woodward EMS (1997) Review of gross community production, primary production, net community production and dark community respiration in the Gulf of Lions. Deep Sea Research Part II: Topical Studies in Oceanography 44:801–832
Matthews B, Mazumder A (2004) A critical evaluation of intrapopulation variation of δ13C and isotopic evidence of individual specialization. Oecologia 140:361–371
Medina A, Goñi N, Arrizabalaga H, Varela JL (2015) Feeding patterns of age-0 bluefin tuna in the western Mediterranean inferred from stomach-content and isotope analyses. Marine Ecology Progress Series 527:193–204
Millot C (1990) The Gulf of Lions’ hydrodynamics. Continental Shelf Research 10:885–894
Minas M, Minas H. (1989) Primary production in the Gulf of Lions with considerations to the Rhone River inputs. Water Pollution Research Reports 32(5):112–125
Molinero JC, Ibanez F, Nival P, Buecher E, Souissi S (2005) North Atlantic climate and northwestern Mediterranean plankton variability. Limnology and Oceanography 50:1213–1220
Molinero JC, Ibanez F, Souissi S, Buecher E, Dallot S, Nival P (2008) Climate control on the long-term anomalous changes of zooplankton communities in the Northwestern Mediterranean. Global Change Biology 14:11–26
Newsome SD, Martinez del Rio C, Bearhop S, Phillips DL (2007) A niche for isotopic ecology. Frontiers in Ecology and the Environment 5:429–436
Nikolioudakis N, Isari S, Pitta P, Somarakis S (2012) Diet of sardine Sardina pilchardus: an “end-to-end” field study. Mar Ecol Prog Ser 453:173–188
Palomera I, Olivar MP, Salat J, Sabatés A, Coll M, García A, Morales-Nin B (2007) Small pelagic fish in the NW Mediterranean Sea: An ecological review. Progress in Oceanography 74:377–396 Pethybridge H, Bodin N, ArsenaultPernet EJ, Bourdeix JH, Brisset B, Bigot JL, Roos D, Peter M (2014)
Temporal and inter-specific variations in forage fish feeding conditions in the NW Mediterranean: lipid content and fatty acid compositional changes. Mar Ecol Prog Ser 512:39–54
Pinkas L, Oliphant M., Iverson I (1971) Food Habits of Albacore, Bluefin Tuna, and Bonito In California Waters.
Plounevez S, Champalbert G (2000) Diet, feeding behaviour and trophic activity of the anchovy (Engraulis encrasicolus, L.) in the Gulf of Lions (Mediterranean Sea). Oceanologica Acta 23:175–192
Post DM, Layman CA, Arrington DA, Takimoto G, Quattrochi J, Montaña CG (2007) Getting to the fat of the matter: models, methods and assumptions for dealing with lipids in stable isotope analyses. Oecologia 152:179–189
Puelles MLF de, Molinero JC (2008) Decadal changes in hydrographic and ecological time-series in the Balearic Sea (western Mediterranean), identifying links between climate and zooplankton. ICES J Mar Sci 65:311–317
Rau GH, Teyssie JL, Rassoulzadegan F, Fowler SW (1990) C-13/C-12 AND N-15/N-14 VARIATIONS AMONG SIZE-FRACTIONATED MARINE PARTICLES-IMPLICATIONS FOR THEIR ORIGIN AND TROPHIC RELATIONSHIPS. Marine Ecology Progress Series 59:33–38
Sánchez-Gómez S (2013) Advances in the knowledge of condition and energy budgets along the life cycle of two small pelagic fishes from the Western Mediterranean.
Saraux C, Fromentin J-M, Bigot J-L, Bourdeix J-H, Morfin M, Roos D, Van Beveren E, Bez N (2014) Spatial Structure and Distribution of Small Pelagic Fish in the Northwestern Mediterranean Sea. PLoS ONE 9:e111211
Schwartzlose RA, Alheit J, Bakun A, Baumgartner TR, Cloete R, Crawford RJM, Fletcher WJ, Green-Ruiz Y, Hagen E, Kawasaki T, Lluch-Belda D, Lluch-Cota SE, MacCall AD, Matsuura Y, Nevárez-Martínez MO, Parrish RH, Roy C, Serra R, Shust KV, Ward MN, Zuzunaga JZ (1999) Worldwide large-scale fluctuations of sardine and anchovy populations. South African Journal of Marine Science 21:289–347
Shannon LJ, Field JG, Moloney CL (2004) Simulating anchovy–sardine regime shifts in the southern Benguela ecosystem. Ecological Modelling 172:269–281
Strady E, Harmelin-Vivien M, Chiffoleau JF, Veron A, Tronczynski J, Radakovitch O (2015) 210 Po and 210 Pb trophic transfer within the phytoplankton–zooplankton–anchovy/sardine food web: a case study from the Gulf of Lion (NW Mediterranean Sea). Journal of environmental
radioactivity 143:141–151
Sweeting CJ, Jennings S, Polunin NVC (2005) Variance in isotopic signatures as a descriptor of tissue turnover and degree of omnivory. Functional Ecology 19:777–784
Syväranta J, Lensu A, Marjomäki TJ, Oksanen S, Jones RI (2013) An Empirical Evaluation of the Utility of Convex Hull and Standard Ellipse Areas for Assessing Population Niche Widths from Stable Isotope Data. PLoS ONE 8:e56094
Tudela S, Palomera I (1997) Trophic ecology of the European anchovy Engraulis encrasicolus in the Catalan Sea (northwest Mediterranean). Marine Ecology Progress Series 160:121–134
Turner TF, Collyer ML, Krabbenhoft TJ (2010) A general hypothesis-testing framework for stable isotope ratios in ecological studies. Ecology 91:2227–2233
Van Beveren E, Bonhommeau S, Fromentin J-M, Bigot J-L, Bourdeix J-H, Brosset P, Roos D, Saraux C (2014) Rapid changes in growth, condition, size and age of small pelagic fish in the
Mediterranean. Mar Biol:1–14
Van Beveren E, Fromentin J-M, Rouyer T, Bonhommeau S, Brosset P, Saraux C (2016) The fisheries history of small pelagics in the Northern Mediterranean. ICES J Mar Sci
Vander Zanden MJ, Rasmussen JB (1999) Primary consumer δ13c and δ15n and the trophic position of aquatic consumers. Ecology 80:1395–1404
Vander Zanden MJ, Rasmussen JB (2001) Variation in δ15N and δ13C trophic fractionation: Implications for aquatic food web studies. Limnology and oceanography 46:2061–2066 Vijverberg J, Frank TH (1976) The chemical composition and energy contents of copepods and
cladocerans in relation to their size. Freshwater Biology 6:333–345
Wiegand MD (1996) Composition, accumulation and utilization of yolk lipids in teleost fish. Rev Fish Biol Fisheries 6:259–286
Zarubin M, Farstey V, Wold A, Falk-Petersen S, Genin A (2014) Intraspecific Differences in Lipid Content of Calanoid Copepods across Fine-Scale Depth Ranges within the Photic Layer. PLoS ONE 9:e92935
Table 1. Mean standard length (in mm ± standard deviation, sd) and number of samples analysed (n) for stable isotopes of Engraulis encrasicolus, Sardina pilchardus and Sprattus sprattus.
Year Engraulis encrasicolus
Standard length (mm)
Sardina pilchardus
Standard length (mm)
Sprattus sprattus
Standard length (mm)
Mean ± sd n Mean ± sd n Mean ± sd n
2004 113 ± 16 65 131 ± 22 83 106 ± 6 14 2005 121 ± 15 29 129 ± 18 25 114 ± 8 8 2008 115 ± 4 15 136 ± 4 17 NA NA 2010 110 ± 4 32 100 ± 5 33 87 ± 8 32 2011 103 ± 19 61 117 ± 14 51 96 ± 8 57 2012 97 ± 5 36 111 ± 13 38 95 ± 8 50 2013 108 ± 17 43 104 ± 18 38 103 ± 8 39 2014 111 ± 14 49 121 ± 15 42 94 ± 9 36
Table 2. Standard ellipse overlaps for each combination of species. The values represent the percentage of overlap between the standard ellipse areas in the scaled stable isotope space. Each number in the cell refers to the percentage of overlap of the area of the species indicated first (e.g 68% is the percentage of ellipses of sardine that are overlapped with the ellipses of the anchovy while 52% is the percentage of the ellipses of anchovy that are overlapped with sardine).
Year Sardine| Anchovy Anchovy| Sardine Anchovy| Sprat Sprat| Anchovy Sardine| Sprat Sprat| Sardine 2004 68 52 0 0 0 0 2005 58 89 0 0 0 0 2008 100 15 NA NA NA NA 2010 0 0 0 0 50 41 2011 12 14 8 6 41 35 2012 14 13 69 52 43 30 2013 69 63 65 65 54 49 2014 32 27 9 5 70 32
Table 3. Summary of stomach content analysis for E. encrasicolus. %N: Percent number; %W: percent estimated dry weight; %O: percent frequency of occurrence; %IRI: percent Index of Relative Importance; Exp(H): trophic niche width determinate with stomach content.
Prey type 1994 2011 and 2012
%N %W %O %IRI %N %W %O %IRI Crustacea Copepods Acartia clausi 6.60 30.36 57.90 18.23 2.64 7.98 18.27 2.29 Clauso-Paracalanidae 13.54 19.49 52.63 13.22 6.36 3.68 15.38 1.83 Centropages typicus 9.76 4.82 50 6.21 3.60 3.64 21.15 1.81 Corycaeus spp. 1.72 2.05 55.26 1.78 4.45 23.81 43.27 14.46 Clytemnestra 0.02 <0.01 2.63 <0.01 0.08 <0.01 1.92 <0.01 Candacia spp. 4.00 8.15 44.74 4.63 0.90 1.10 10.58 0.25 Oithona spp. 1.48 0.07 42.11 0.55 0.12 <0.01 5.77 <0.01 Oncaea spp. 15.30 0.39 94.74 12.67 20.15 15.43 65.38 27.52 Microsetella spp. 16.08 0.22 97.37 13.52 26.38 13.34 74.04 34.78 Euterpina acutifrons 1.25 0.36 94.74 1.30 2.01 0.13 36.54 0.89 Temora stylifera 1.22 0.41 42.11 0.59 0.02 <0.01 0.96 <0.01 Unidentified Copepods 23.26 0.78 71.05 14.55 15.36 18.69 32.69 13.16 Cladoceran 2.79 5.36 73.68 3.37 0.33 <0.01 9.62 0.04 Ostracod 0.29 0.03 44.73 0.08 1.29 0.29 22.12 0.41 Tunicata Appendicularia - - - - 0.12 <0.01 0.96 <0.01 Protists Diatoms Diatoms - - - - 9.21 9.60 3.85 0.86 Chaetognatha Chaetognatha 0.05 0.01 2.63 <0.01 - - - - Larvae Crustacae Euphausiacae 0.21 26.96 31.57 7.31 2.34 3.31 7.69 0.45 Decapoda 0.35 0.19 34.21 0.16 1.89 1.47 11.54 0.46 Mollusca Gasteropodae <0.01 0.03 5.26 <0.01 1.98 0.04 10.58 0.25 Bivalve 0.02 0.30 42.11 0.11 1.68 0.29 23.08 0.54 Eggs Anchovy egg’s 0.15 0.09 47.37 0.10 1.1 0.49 16.35 0.31 Other fish egg’s 0.24 0.42 50 0.28 0.14 <0.01 2.88 <0.01
Table 4. Summary of stomach content analysis for S. pilchardus. %N: Percent number; %W: percent estimated dry weight; %O: percent frequency of occurrence; %IRI: percent Index of Relative Importance; Exp(H): trophic niche width determinate with stomach content.
Prey type 2007 2011 and 2012
%N %W %O %IRI %N %W %O %IRI Crustacea Copepods Acartia clausi - - - - 3.58 8.14 0.12 1.74 Clauso-Paracalanidae 3.26 6.78 62.50 4.36 7.07 5.05 0.41 5.95 Centropages typicus - - - - 1.51 1.55 0.13 0.49 Corycaeus spp. 4.09 4.11 75.00 4.28 8.61 30.10 0.46 21.64 Clytemnestra - - - - 0.43 0.16 0.03 0.02 Candacia spp. 0.16 18.27 12.50 1.60 0.13 1.04 0.03 0.04 Oithona spp. - - - - 0.16 0.04 0.04 <0.01 Oncaea spp. 11.58 0.61 100 8.48 17.61 12.27 0.68 24.55 Microsetella spp. 6.31 11.11 87.50 10.60 24.65 10.09 0.70 29.34 Euterpina acutifrons 3.82 19.27 62.50 10.03 9.12 4.43 0.36 5.87 Temora stylifera 2.01 30.95 50.00 11.46 - - - - Unidentified Copepods 10.73 2.92 100.00 9.50 9.43 6.06 0.25 4.77 Cladoceran 43.64 1.63 100 31.48 1.08 0.70 0.11 0.24 Ostracod - - - - 1.09 1.55 0.12 0.39 Tunicata Appendicularia 0.08 0.06 12.50 0.02 - - - - Protists Diatoms Diatoms 8.39 0.79 75.00 4.79 5.85 9.00 0.11 2.03 Chaetognatha Chaetognatha - - - - <0.01 <0.01 <0.01 <0.01 Larvae Crustacae Euphausiacae - - - - Decapoda 0.54 2.63 37.5 0.83 0.09 0.76 0.05 0.05 Mollusca Gasteropodae - - - - 0.12 <0.01 0.02 <0.01 Bivalve 1.29 0.19 50.00 0.51 1.09 1.04 0.09 0.24 Eggs Anchovy egg’s - - - - 5.40 6.87 0.11 1.68
Other fish egg’s - - - - 2.80 0.83 0.21 0.91
Figure captions:
Figure 1. Sampling sites in the Gulf of Lions (Northwestern Mediterranean Sea). The left panel indicates isotope sampling locations and the right one stomach content sampling locations.
Figure 2. Summary of a) δ13C, b) δ15N values (mean, s.d., in ‰) and c) trophic niche size of the 3 species over time in the Gulf of Lions. SEAC (SEAC: standard ellipse area) are indicated in ‰². The Bayesian area estimate of the standard ellipse metrics (SEAB) that present differences between years for each species are indicated by superscripts.
Figure 3. Classification and regression tree assessing the importance of year, species, fish length, latitude, longitude and coastal/offshore gradient on (A) δ13C values and (B) δ15N values. Trees are split off on the values of one covariate at a time such that the overall variance in the dependent variable is minimized at each split. Terminal nodes indicate the value of assigned δ13C or δ15N to the node.
Figure 4. Species scaled isotopic niche space between 2004 and 2014, represented by solid bold lines based on the area of the standard ellipses corrected to small samples sizes (SEAc). Stable carbon and nitrogen isotope values are from the muscle of adult anchovy, sardine and sprat.
Figure 5. Principal component analysis of the dry weight percentage of the main anchovy prey in the Gulf of Lions. Cory: Corycaeus spp; Micr: Microsetella spp; Clpa: Clauso-Paracalanidae; Onca: Oncaea spp; Cand: Candacia spp; Acar: Acartia clausi; Euph: Euphausiacae; Cent: Centropages typicus. Barycenters of the years (Y) are added as supplementary variables.
Figure 6. Principal component analysis of the dry weight percentage of the main sardine prey in the Gulf of Lions. Clad: cladoceran; Temo: Temora stylifera; Cory: Corycaeus spp; Micr: Microsetella spp; Eute: Euterpina acutifrons; Diat: Diatoms; Clpa: Clauso-Paracalanidae; Onca: Oncaea spp. Barycenters of the years (Y) are added as supplementary variables.
Figure 5.