HAL Id: ird-01700836
https://hal.ird.fr/ird-01700836
Submitted on 5 Feb 2018
HAL is a multi-disciplinary open access
archive for the deposit and dissemination of sci-entific research documents, whether they are pub-lished or not. The documents may come from teaching and research institutions in France or abroad, or from public or private research centers.
L’archive ouverte pluridisciplinaire HAL, est destinée au dépôt et à la diffusion de documents scientifiques de niveau recherche, publiés ou non, émanant des établissements d’enseignement et de recherche français ou étrangers, des laboratoires publics ou privés.
Characterization of genome-wide microsatellite markers
in rabbitfishes, an important resource for artisanal
fisheries in the Indo-West Pacific
Ilkser Erdem Kiper, Paulette Bloomer, Philippe Borsa, Thierry Bernard
Hoareau
To cite this version:
Ilkser Erdem Kiper, Paulette Bloomer, Philippe Borsa, Thierry Bernard Hoareau. Characteriza-tion of genome-wide microsatellite markers in rabbitfishes, an important resource for artisanal fish-eries in the Indo-West Pacific. Molecular Biology Reports, Springer Verlag, 2018, 45 (1), pp.19-25. �10.1007/s11033-017-4136-x�. �ird-01700836�
1
To be cited as:
Kiper IE, Bloomer P, Borsa P, Hoareau TB (2018) Characterization of genome-wide microsatellite markers in rabbitfishes, an important resource for artisanal fisheries in the Indo-West Pacific. Molecular Biology Reports 45, 19-25. , doi:
10.1007/s11033-017-4136-x
Characterization of genome-wide microsatellite markers in rabbitfishes, an important resource for artisanal fisheries in the Indo-West Pacific
Ilkser Erdem Kiper 1,2, Paulette Bloomer 1,2, Philippe Borsa 3, Thierry Bernard Hoareau 1✉,2
1 Molecular Ecology and Evolution Programme, Department of GeneticsUniversity of PretoriaPrivate Bag
X20, Hatfield, Pretoria 0028, South Africa
2 Department of Genetics, University of Pretoria, Private Bag X20 Hatfield 0028 South Africa 3 UMR 250 “Ecologie marine tropicale des océans Pacifique et Indien”, Institut de recherche pour le
développement (IRD), BP A5, 98848 Nouméa, New Caledonia
✉Molecular Ecology and Evolution Programme, Department of Genetics, University of Pretoria, Private Bag X20, Hatfield, Pretoria 0028, South Africa; Phone: +27(0)12 420 5062; Email: thoareau@gmail.com Received: 23 September 2016 / Accepted: 12 December 2017
2
Abstract Rabbitfishes are reef-associated fishes that support local fisheries throughout the Indo-West Pacific
region. Sound management of the resource requires the development of molecular tools for appropriate stock delimitation of the different species in the family. Microsatellite markers were developed for the cordonnier
Siganus sutor, and their potential for cross-amplification was investigated in 12 congeneric species. A library of
792 repeat-containing sequences was built. Nineteen sets of newly developed primers, and 14 universal finfish microsatellites were tested in S. sutor. Amplification success of the 19 Siganus-specific markers ranged from 32 to 79% in the 12 other Siganus species, slightly decreasing when the genetic distance of the target species to S.
sutor increased. Seventeen of these markers were polymorphic in S. sutor and were further assayed in S. luridus, S. rivulatus, and S. spinus, of which respectively 9, 10 and 8 were polymorphic. Statistical power analysis and an
analysis of molecular variance showed that subtle genetic differentiation can be detected using these markers, highlighting their utility for the study of genetic diversity and population genetic structure in rabbitfishes.
3
Introduction
Rabbitfishes (genus Siganus) are Indo-West Pacific reef-associated fishes currently comprising 30 valid species [1,2]. These fishes are economically important as a food source in coastal areas across the Indo-West Pacific where they support local fisheries and aquaculture [3,4,5,6,7]. Overfishing threatens this resource, as in the case of the cordonnier Siganus sutor (Valenciennes 1835), along the coasts of eastern Africa [8,9]. Appropriate resource management requires the identification of demographically independent populations, which is often achieved using microsatellite markers [10]. The aim of the present study was to develop microsatellite markers for siganid fishes. To this end, we identified polymorphic microsatellite loci in a target species (S. sutor) and evaluated their utility as genetic markers in twelve other congeneric species.
Materials and methods
Siganus spp. fin tissue samples were obtained from several locations across the Indo-West Pacific (Online Resource 1). The rabbitfish species included in this study were S. argenteus, S. canaliculatus, S. corallinus, S.
doliatus, S. fuscescens, S. laqueus, S. luridus, S. puellus, S. punctatus, S. rivulatus, S. spinus, S. sutor and S. vulpinus
(Online Resource 1). Genomic DNA was extracted from fin tissue by using the DNeasy kit (Qiagen, Valencia CA, USA) following the manufacturer’s protocol.
The microsatellite library was developed for S. sutor using the protocol of fast isolation by amplified-fragment length polymorphism of sequences containing repeats, which involves a protocol based on digestion and ligation reactions [11] combined to 454 sequencing [12]. We followed the same procedures as [13]. Genomic DNA was fragmented by enzyme digestion using the restriction enzyme MseI (New England Biolabs, Ipswich, MA). This was followed by the ligation of the small fragments to an adaptor (5′-TACTCAGGACTCAT-3′/5′-GACGATGAGGTCCTGAG-3′) [11,13]. The ligation products were then hybridized to the repeat containing biotinylated probes (CAAA6, GAAA6, and GATA6) [14] and the
hybridized regions were captured on streptavidin-coated beads (Roche, Basel, Switzerland). After
hybridization, non-specific binding elements were removed by washing. The eluted DNA, which consists of chemically and heat-separated DNA fragments containing selected repeats removed from the probes, was amplified according to [11] and the amplification product was pyrosequenced using GS-FLX titanium reagents by the 454 Genome Sequencer FLX™ (Inqaba Biotech, Pretoria, South Africa).
The repeat–enriched sequence library was mined for potential microsatellites, i.e., nucleotide sequences containing ≥ 8 short tandem repeats for all the repeat types including mono-, di-, tri-, tetra-, penta- and hexa-nucleotides, using MSATCOMMANDER v. 0.8.2 [15]. Sequences > 100-bp long were selected to ensure
adequate flanking regions for primer design. Duplications were verified using the online version of the alignment program MAFFT (http://mafft.cbrc.jp/alignment/server/), selecting the default settings, but choosing the option for adjusting the direction of nucleotide sequences. A single copy of identical sequences was kept. The program PRIMER DESIGNER v. 4.20 (SECentral, Scientific & Educational Software, Durham NC, USA) was used to generate 59 primer sets based on standard criteria (Online Resources 2–4). A total of 19 of these primer sets were selected for further tests. Additionally, we included 14 microsatellite markers that universally amplify in acanthopterygian fishes [16]. All 33 markers were used for cross-species amplification in
S. sutor and the 12 other siganid species. A total of 17 markers found to be polymorphic in S. sutor were
4
Amplification reactions were done in 10 µL volumes and the reaction mixture included ~ 40 ng of template DNA, 1× PCR buffer, 1.5 mM MgCl2, 0.2 mM dNTPs (Promega, Madison WI, USA), 0.2 pM
primers (Whitehead Scientific, Johannesburg, South Africa), and 0.04 U Supertherm Taq polymerase (Southern Cross Biotechnologies, Cape Town, South Africa). The PCR cycling conditions were: 94 °C for 5 min, followed by 30 cycles of 94 °C for 30 s, 1 min at annealing temperature (details in Online Resource 3), 72 °C for 1 min and by a final elongation at 72 °C for 7 min. Amplification products were subjected to electrophoresis on 3% agarose gels (1.5 h, 100 V) and visualised with GelRed™ stain (Biotium, Hayward CA, USA). The amplification reactions were repeated using fluorescently-labelled ChromaTide® Alexa Fluor™ 488-5-dUTPs (Invitrogen, Carlsbad CA, USA) to confirm the presence of multiple alleles at each locus. Forward primers of Siganus-specific loci that were polymorphic were labelled by the fluorescent G5 dye set (Applied Biosystems, Foster City CA, USA). Genotyping was done using the Quantitect Multiplex PCR kit (Qiagen), following the manufacturer’s recommendations. The fragments were analysed on an ABI 3500xl genetic analyzer (Applied Biosystems) with the GeneScan Liz™ 500 Size Standard (Applied Biosystems). Scoring of genotypes was done using the GENEMARKER v. 1.5 software (SoftGenetics, State Collage,
Pennsylvania, USA).
To investigate the transferability of the 19 new Siganus-specific markers across the family, we evaluated the relationship between genetic distance to the target species S. sutor and cross-species amplification success. To estimate genetic distance, nucleotide sequences of the mitochondrial cytochrome b (cytb) gene were used. This included sequences available from GenBank (Online Resource 5) and new sequences generated in the present study (Online Resource 6). We followed the procedure described in [17] to design specific primers for the family Siganidae. Cycling conditions included initial denaturation at 94°C for 3 min; 35 cycles of
denaturation at 94°C for 30 s, annealing at 55°C for 30 s, elongation at 72°C for 1 min; and final elongation at 72°C for 7 min. The amplified products were precipitated using 2.8 volumes of absolute ethanol, 0.4 volumes of Sabax water and 0.08 volumes of 3M sodium acetate, followed by a washing step using 90 µL 70% ethanol. The products were eluted in 15 µL Sabax water. Cycle sequencing reactions contained approximately 30 ng purified DNA, 1 µL ABI PRISM BigDye Terminator Cycle Sequencing Ready Reaction Kit v. 3.1 (Applied Biosystems), 5 x sequencing buffer and 3.2 pM primer. Sequencing was done on an ABI 3500xl sequencer (Applied Biosystems).
Genetic distance between species was estimated as the net mean nucleotide divergence (Kimura-2-parameter model; MEGA6) [18] at the cytb locus between S. sutor and the other species considered. The
distances were used to reconstruct a Neighbor-Joining tree in MEGA6, to illustrate the diversity of species used in the present study and their phylogenetic relationships (Fig. 1a). The GenBank sequences that represented possibly misidentified specimens, possible mitochondrial-DNA introgression or cryptic species were removed from the analysis (Online Resource 5).
Summary statistics on the microsatellite genotype data, and their significance, were estimated using GENETIX v.4.05 [19]. The possible presence of null alleles was assessed using MICROCHECKER v. 2.2.3 [20].
Linkage disequilibrium (LD) among markers was estimated and tested using permutation tests in ARLEQUIN
v. 3.0 [21]. BAYESCAN v. 2.1 [22] and LOSITAN [23] were used to detect potential outlier loci based on allelic
differences estimated by FST, and comparison between the observed FST and expected heterozygosity among
the populations, respectively. We used the program POWSIM v. 4.1 [24] to evaluate the statistical power of the
markers to detect subtle genetic structure. This program identifies the threshold above which FST values
become significant, given the distribution of allele frequencies in a set of markers. The specific test that we performed relied on simulated pairs of populations (100 replicates) with a set sample size (50 individuals) and
5
effective population size (Ne = 5000), but a varying number of generations since isolation (t = 5–300) to
generate various levels of divergence (i.e. FST values). To further evaluate the utility of the markers with
regards to potential spatial genetic structuring, an analysis of molecular variance (AMOVA) [25] was done among samples of S. spinus and S. luridus, the two species from the study with multiple samples from different locations. Each sampling location was defined as a population (see Online Resource 1). The significance of the variance components among populations and within populations was determined using 1000
permutations.
Results and discussion
The repeat-enriched library contained 6112 sequences and the mining step uncovered 310, 61, and 421 sequences containing di-, tri- and tetra-nucleotide repeats, respectively (Online Resource 7). Only a subset of these sequences was longer than 100 bp and contained sufficiently long flanking regions at both ends. These included 28, 12, and 38 sequences containing di-, tri-, and tetra-nucleotide repeats, respectively. Among these, 59 sequences were used for primer design (Online Resource 2). Due to budget limitations, only 19 of these potential markers were tested for amplification in 13 Siganus species, including S. sutor.
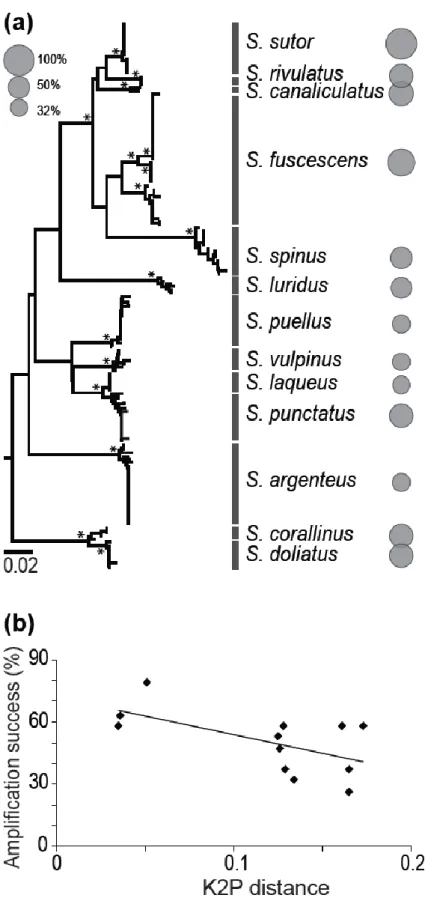
Cross-species amplification success of the 33 markers (of which 19 were Siganus-specific and14 were universal in ray-finned fishes) across 12 siganids ranged from 36% (S. laqueus) to 76% (S. corallinus, S. doliatus and S. fuscescens). The genetic distance to S. sutor, estimated from nucleotide sequences at the cytb locus, ranged from 0.035 (S. rivulatus) to 0.165 (S. argenteus) (Online Resource 8).The amplification success of the 19 Siganus-specific markers ranged from 32% (in S. vulpinus) to 79% (in S. fuscescens) (Fig. 1a) and showed a weak yet significant decrease with the genetic distance to S. sutor (Fig. 1b). The new microsatellite markers therefore amplify in species other than S. sutor but phylogenetic distance affects the amplification efficiency. Alternative primers might need to be designed for the few markers that do not, or poorly amplify in some species. Similar negative correlation has been reported previously [13,26]. This trend is likely a general one across taxa and markers, and should be accounted for in the evaluation of cross-species amplification.
Twelve of the 19 Siganus-specific markers and five of the universal acanthopterygian fish markers were polymorphic in S. sutor (Online Resource 3). These were tested for polymorphism in three other siganid species (Table 1). The expected heterozygosity averaged across all loci was 0.822 for S. luridus, 0.753 for S.
rivulatus, 0.682 for S. spinus, and 0.823 for S. sutor, while the mean number of alleles across loci was 8.78, 5.73,
6.75, and 11.69, respectively. Significant deviation from Hardy–Weinberg equilibrium was detected at 3/9 loci in S. luridus, 1/11 loci in S. rivulatus, 2/8 loci in S. spinus, and 7/17 loci in S. sutor, but null alleles were detected in only a smaller proportion of the loci: SIG006 in S. spinus, and SIG008 and SIG013 in S. sutor. Significant linkage disequilibrium values were detected for 2/28 locus-pairwise comparisons in S. spinus (Online Resource 9) and for 5/120 comparisons in S. sutor, after Bonferroni correction [27] (Online Resource 10). Considering the low occurrence of significant values, both null alleles and linkage disequilibrium are expected to have a marginal effect on the analysis of genetic differentiation between populations in S. spinus and S. sutor. BAYESCAN [22] and LOSITAN [23] detected a single outlier locus (SIG017), relative to the level of genetic
differentiation between populations. The occurrence at this locus of an FST value above the 99% confidence
interval suggests directional selection, but this can also be due to non-overlapping allele sizes between species. By assessing the resolution power of the microsatellite markers, we were able to evaluate whether the sets of microsatellites in S. rivulatus, S. spinus and S. sutor could potentially identify genetically distinct populations. A previous simulation study showed that the threshold FST values for the detection of genetic subdivision
6
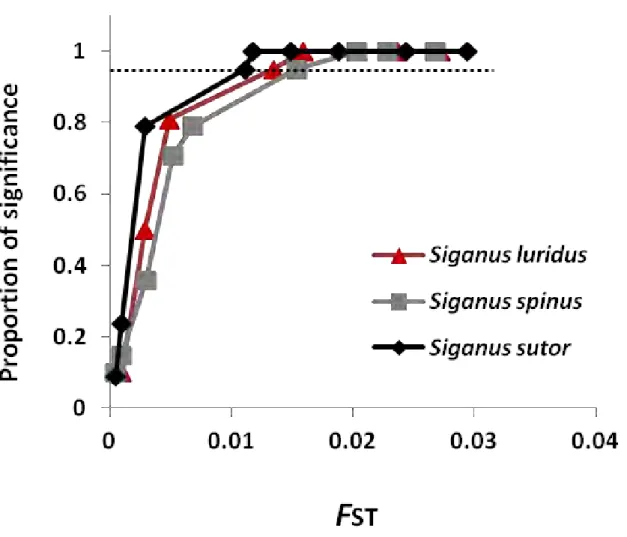
among populations ranged from as low as 0⋅005–0⋅007 when using the appropriate set of markers [29]. In the present study, the set of microsatellite markers was able to detect subtle levels of genetic differentiation through the power analysis. These values were as low as FST = 0.0135 in S. luridus, FST = 0.015 in S. spinus,
and FST = 0.011 in S. sutor (Fig. 2); S. rivulatus was excluded from this analysis due to low sample sizes. These
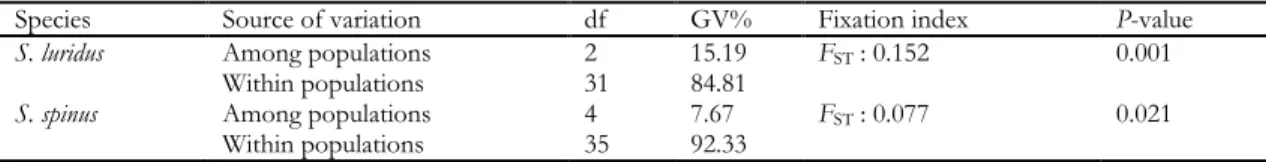
results based on simulations were confirmed by the AMOVA analyses, which showed significant genetic differentiation among locations in both S. luridus (FST = 0.152, P = 0.001) and S. spinus (FST = 0.077, P = 0.021) despite low sample sizes per location ranging from one to ten (Table 2). The set of markers
proposed in this study therefore proved useful in detecting subtle genetic structure in Siganus spp.
The amplification success, the level of polymorphism, the resolution power, and the pilot study for the detection of population differentiation show that these microsatellites represent a valuable molecular resource for rabbitfish species. These markers will be useful for developing studies aimed at improving resource management in artisanal rabbitfish fisheries across the Indo-West Pacific.
Acknowledgements
We would like to thank the following collaborators for facilitating the collection of samples: A. Brito and R. Mutombene from the Instituto Nacional de lnvestiqacao Pesqueira (Mozambique), N. Wambiji from the Marine & Fisheries Research Institute (Kenya), S. Abeare from Reef Doctor (Madagascar), G. Gouws from the South African Institute for Aquatic Biodiversity (South Africa), A. Collet, G. Mou-Tham and D. Lecchini from IRD (New Caledonia), P. Boblin and E. Tardy from SPC (New Caledonia), E. Tessier from Parc Marin (La Réunion), F. Giancarlo from Proyek Biokor (Indonesia and West Papua), M. Hassan from SMEL (France), and M. Low from NUS (Singapore).
Funding
This project was funded by the Western Indian Ocean Marine Science Association (WIOMSA): MARG I/11/2013 and the South African Department of Science and Technology/National Research Foundation African Coelacanth Ecosystem Programme (ACEP) II. Sampling was funded in part by IRD, SPC and SAIAB. IEK benefitted from a PhD scholarship from the University of Pretoria’s PhD programme. TBH was supported by the University of Pretoria’s research fellowship programme and the University of Pretoria Research Development Programme.
Conflict of interest
We have no conflict of interest regarding the content of the present paper.
References
1. Froese R, Pauly D (2016) FishBase. World Wide Web electronic publication. http://www.fishbase.org. Accessed 23 Mar 2016
2. Eschmeyer WN, Fricke R, van der Laar R (2016) Catalog of fishes: genera, species, references, electronic version. http://researcharchive.calacademy.org/research/ichthyology/catalog/. Accessed 23 Mar 2016 3. Lam TJ (1974) Siganids: their biology and mariculture potential. Aquaculture 3:325–354
7
4. Woodland DJ (1990) Revision of the fish family Siganidae with description of two new species and comments on distribution and biology. Indo-Pac Fishes 19:1–136
5. Kuiter R (1993) Coastal fishes of south-eastern Australia. University of Hawaii Press, Honolulu
6. Kuriiwa K, Hanzawa N, Yoshino T, Kimura S, Nishida M (2007) Phylogenetic relationships and natural hybridization in rabbitfishes (Teleostei: Siganidae) inferred from mitochondrial and nuclear DNA analyses. Mol Phylogenet Evol 45:69–80
7. Lemer S, Aurelle D, Vigliola L, Durand J-D, Borsa P (2007) Cytochrome b barcoding, molecular systematics, and geographic differentiation in rabbitfishes (Siganidae). C R Biol 330:86–94
8. Wambiji N (2010) Reproductive biology of three siganid species: Siganus canaliculatus (Park 1797), Siganus
sutor (Valenciennes 1835) and Siganus stellatus (Forsskal 1775) in family Siganidae along the Kenyan coast.
Kenya Marine and Fisheries Institute, Mombasa, Mombasa
9. Samoilys MA, Osuka K, Maina GW, Obura D (2017) Artisanal fisheries on Kenya’s coral reefs: decadal trends reveal management needs. Fish Res 186:177–191
10. Selkoe KA, Toonen RJ (2006) Microsatellites for ecologists: a practical guide to using and evaluating microsatellite markers. Ecol Lett 9:615–629
11. Zane L, Bargelloni L, Patarnello T (2002) Strategies for microsatellite isolation: a review. Mol Ecol 11:1– 16
12. Abdelkrim J, Roberson BC, Stanton JL, Gemmell NJ (2009) Fast, cost-effective development of species-specific microsatellite markers by genomic sequencing. Biotechniques 46:185–192
13. Reid K, Hoareau TB, Bloomer P (2012) High-throughput microsatellite marker development in two sparid species and verification of their transferability in the family Sparidae. Mol Ecol Resour 12:740–752 14. Tóth G, Gáspári Z, Jurka J (2000) Microsatellites in different eukaryotic genomes: survey and analysis.
Genome Res 10:967–981
15. Faircloth BC (2008) MSATCOMMANDER: detection of microsatellite repeat arrays and automated,
locus-specific primer design. Mol Ecol Resour 8:92–94
16. Gotoh R, Tamate S, Yokoyama J, Tamate HB, Hanzawa N (2013) Characterization of comparative genome-derived simple sequence repeats for acanthopterygian fishes. Mol Ecol Resour 13:461–472 17. Hoareau TB, Boissin E (2010) Design of phylum-specific hybrid primers for DNA barcoding: addressing
the need for efficient COI amplification in the Echinodermata. Mol Ecol Resour 10:960–967
18. Tamura K, Stecher G, Peterson D, Filipski A, Kumar S (2013) MEGA6: molecular evolutionary genetics
analysis version 6.0. Mol Biol Evol 30:2725–2729
19. Belkhir K, Borsa P, Chikhi L, Raufaste N, Bonhomme F (2004) GENETIX 4.05, logiciel sous WINDOWS™
pour la génétique des populations. Laboratoire Génome, Populations, Interactions, CNRS UMR 5171, Université Montpellier II, Montpellier
20. Van Oosterhout C, Hutchinson WF, Wills DP, Shipley P (2004) MICRO-CHECKER: software for identifying and correcting genotyping errors in microsatellite data. Mol Ecol Notes 4:535–538 21. Excoffier L, Laval G, Schneider S (2005) ARLEQUIN (ver. 3.0): an integrated software package for
population genetics data analysis. Evol Bioinform Online 1:47–50
22. Foll M, Gaggiotti O (2008) A genome-scan method to identify selected loci appropriate for both dominant and codominant markers: a Bayesian perspective. Genetics 180:977–993
23. Antao T, Lopes A, Lopes RJ, Beja-Pereira A, Luikart G (2008) LOSITAN: a workbench to detect molecular adaptation based on a Fst-outlier method. BMC Bioinform 9:323
8
24. Ryman N, Palm S (2006) POWSIM: A computer program for assessing statistical power when testing for genetic differentiation. Mol Ecol 6:600–602
25. Excoffier L, Smouse PE, Quattro JM (1992) Analysis of molecular variance inferred from metric distances among DNA haplotypes: application to human mitochondrial DNA restriction data. Genetics 131:479– 491
26. Carreras-Carbonell J, Macpherson E, Pascual M (2008) Utility of pairwise mtDNA genetic distance for predicting cross-species microsatellite amplification and polymorphism success in fishes. Conserv Genet 9:181–190
27. Rice WR (1989) Analyzing tables of statistical tests. Evolution 43:223–225
28. Weir BS, Cockerham CC (1984) Estimating F-Statistics for the analysis of population structure. Evolution 38:1358–1370
29. Waples RS, Gaggiotti O (2006) What is a population? An empirical evaluation of some genetic methods for identifying the number of gene pools and their degree of connectivity. Mol Ecol 15:1419–1439
9
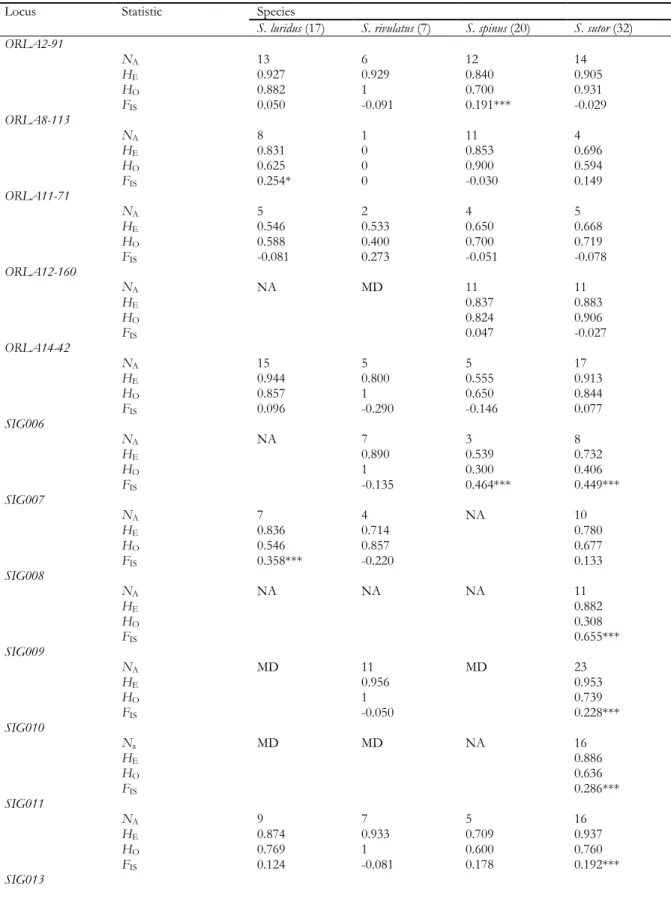
Table 1 Summary statistics for 17 polymorphic loci tested in four siganids (with sample size in brackets)
including the number of observed alleles (NA), expected heterozygosity (HE), observed heterozygosity (HO),
and inbreeding coefficient (FIS) estimates [28]
Locus Statistic Species
S. luridus (17) S. rivulatus (7) S. spinus (20) S. sutor (32)
ORLA2-91 NA 13 6 12 14 HE 0.927 0.929 0.840 0.905 HO 0.882 1 0.700 0.931 FIS 0.050 -0.091 0.191*** -0.029 ORLA8-113 NA 8 1 11 4 HE 0.831 0 0.853 0.696 HO 0.625 0 0.900 0.594 FIS 0.254* 0 -0.030 0.149 ORLA11-71 NA 5 2 4 5 HE 0.546 0.533 0.650 0.668 HO 0.588 0.400 0.700 0.719 FIS -0.081 0.273 -0.051 -0.078 ORLA12-160 NA NA MD 11 11 HE 0.837 0.883 HO 0.824 0.906 FIS 0.047 -0.027 ORLA14-42 NA 15 5 5 17 HE 0.944 0.800 0.555 0.913 HO 0.857 1 0.650 0.844 FIS 0.096 -0.290 -0.146 0.077 SIG006 NA NA 7 3 8 HE 0.890 0.539 0.732 HO 1 0.300 0.406 FIS -0.135 0.464*** 0.449*** SIG007 NA 7 4 NA 10 HE 0.836 0.714 0.780 HO 0.546 0.857 0.677 FIS 0.358*** -0.220 0.133 SIG008 NA NA NA NA 11 HE 0.882 HO 0.308 FIS 0.655*** SIG009 NA MD 11 MD 23 HE 0.956 0.953 HO 1 0.739 FIS -0.050 0.228*** SIG010 Na MD MD NA 16 HE 0.886 HO 0.636 FIS 0.286*** SIG011 NA 9 7 5 16 HE 0.874 0.933 0.709 0.937 HO 0.769 1 0.600 0.760 FIS 0.124 -0.081 0.178 0.192*** SIG013
10 NA MD NA MD 5 HE 0.658 HO 0.044 FIS 0.935*** SIG014 NA 12 8 MD MD HE 0.909 0.912 HO 0.688 0.714 FIS 0.250* 0.231 SIG015 NA NA NA NA 15 HE 0.899 HO 0.781 FIS 0.133* SIG017 Na 5 6 3 6 HE 0.708 0.747 0.471 0.691 HO 0.647 0.714 0.400 0.625 FIS 0.088 0.048 0.176 0.096 SIG019 NA NA NA MD 12 HE 0.806 HO 0.781 FIS 0.031 SIG020 NA 5 6 NA 14 HE 0.822 0.864 0.880 HO 0.800 0.500 0.857 FIS 0.030 0.444* 0.044
* P < 0.05; *** P < 0.001. NA: locus with no amplification, MD: locus with missing data (a proportion of the individuals were not amplified)
11
Table 2 Analysis of molecular variance for Siganus luridus and Siganus spinus. Degrees of freedom (df),
percentage contribution to overall genetic variance (GV%) and fixation index (FST) with related P-value are
presented.
Species Source of variation df GV% Fixation index P-value
S. luridus Among populations 2 15.19 FST : 0.152 0.001
Within populations 31 84.81
S. spinus Among populations 4 7.67 FST : 0.077 0.021
12
Fig. 1 Amplification success of the new set of 19 microsatellites in 13 Siganus species. a Genetic relationships among 13 Siganus species illustrated by a Neighbour Joining tree based on 184 cytochrome b gene sequences [MEGA6: Kimura-2 parameter (K2P) model; pairwise deletion] [18]. The amplification success of the 19 loci represented by circles whose surface is proportional to the proportion of amplifying loci. Supported nodes (≥ 75% bootstrap score) are indicated with a star. cytb gene sequences of three surgeonfish species (Acanthurus blochii, A. triostegus, Naso unicornis) were chosen as
outgroup. b Amplification success plotted against K2P distance to S. sutor. Linear regression model:
13
Fig. 2 Power analysis for the set of polymorphic microsatellite markers illustrating the proportion of
significance (PS) as a function of the FST value in S. luridus (9 loci; 17 individuals; PS = 2.076 + 0.261. ln(FST); FST95 = 0.0135), S. spinus (8 loci; 20 individuals; PS = 2.055 + 0.265. ln(FST); FST95 = 0.015), and S. sutor (16 loci;
32 individuals; PS = 1.991 + 0.232. ln(FST); FST95 = 0.011). Dotted line indicates 95% significance threshold
(FST95). The relatively low FST values observed at this threshold show that fine-scale population structure can be
14
Molecular Biology Reports
Supplementary information to:
Characterization of genome wide microsatellite markers for rabbitfishes, an important resource for artisanal fisheries in the Indo-Pacific
Ilkser Erdem Kiper, Paulette Bloomer, Philippe Borsa, Thierry Bernard Hoareau
Correspondence: Molecular Ecology and Evolution Programme, Department of Genetics, University of Pretoria, Pretoria 0002, South Africa
thoareau@gmail.com
15
Online Resource 1
List of rabbitfish, Siganus spp. specimens sub-sampled for genetics, with sampling details. MNHN: Muséum national d’histoire naturelle, Paris.
Species Specimen no. Sampling date Sampling locality Collector
S. argenteus
IFA0001 11 Dec. 2013 Mangily, Ifaty, Madagascar S. Abeare
S006 04 Feb. 2005 Nouméa fish market, New Caledonia A. Collet
S. canaliculatus
ScanJurong02 21 Nov. 2006 Jurong fish market, Singapore (from off Phuket, Thailand) P. Borsa
ScanJurong03 21 Nov. 2006 Jurong fish market, Singapore (from off Phuket, Thailand) P. Borsa
S. corallinus
T-392 30 Apr. 2005 SE side, Conception Is., Seychelles G. Gouws
S002
(MNHN 2007-0006) 04 Feb. 2005 Nouméa fish market, New Caledonia A. Collet
S. doliatus
S003
(MNHN 2007-0007) 04 Feb. 2005 Nouméa fish market, New Caledonia A. Collet
S007
(MNHN 2007-0008) 04 Feb. 2005 Nouméa fish market, New Caledonia A. Collet
S. fuscescens
Sfus04 June 2006 Marau, Solomon Islands, E. Tardy
Sfus05 June 2006 Marau, Solomon Islands, E. Tardy
S. laqueus
T-66 16 Apr. 2005 Victoria market, Seychelles G. Gouws
RB09-241 01 Dec. 2009 Mangrove channel, Nampula, Mozambique G. Gouws
KEN0012 14 Mar. 2014 Msambweni, Kenya N. Wambiji
KEN0013 14 Mar. 2014 Msambweni, Kenya N. Wambiji
S. luridus
KEN0002 01 Apr. 2014 Kilifi, Kenya N. Wambiji
KEN0003 01 Apr. 2014 Kilifi, Kenya N. Wambiji
KEN0010 13 Mar. 2014 Msambweni, Kenya N. Wambiji
KEN0011 13 Mar. 2014 Msambweni, Kenya N. Wambiji
KEN0018 11 Feb. 2013 Mombasa, Kenya N. Wambiji
KEN0019 11 Feb. 2013 Mombasa, Kenya N. Wambiji
KEN0022 17 Jan. 2014 Malindi, Kenya N. Wambiji
KEN0023 17 Jan. 2014 Malindi, Kenya N. Wambiji
Slur01 2002 Lattaqieh, Syria M. Hassan
Slur02 2002 Lattaqieh, Syria M. Hassan
Slur03 2002 Lattaqieh, Syria M. Hassan
Slur04 2002 Lattaqieh, Syria M. Hassan
Slur05 2002 Lattaqieh, Syria M. Hassan
Slur06 2002 Lattaqieh, Syria M. Hassan
Slur07 2002 Lattaqieh, Syria M. Hassan
Ss01 - La Réunion E. Teissier
Ss02 - La Réunion E. Teissier
S. puellus
S004 04 Feb. 2005 Nouméa fish market, New Caledonia A. Collet
S. punctatus
S001
(MNHN 2007-0010) 04 Feb. 2005 Nouméa fish market, New Caledonia A. Collet
S. rivulatus
Sriv01 2002 Lattaqieh, Syria M. Hassan
Sriv02 2002 Lattaqieh, Syria M. Hassan
Sriv03 2002 Lattaqieh, Syria M. Hassan
Sriv04 2002 Lattaqieh, Syria M. Hassan
Sriv05 2002 Lattaqieh, Syria M. Hassan
Sriv06 2002 Lattaqieh, Syria M. Hassan
Sriv07 2002 Lattaqieh, Syria M. Hassan
S. spinus
JNC 1555 28 June 2005 Récif Goéland, New Caledonia G. Mou-Tham
JNC 1556 28 June 2005 Récif Goéland, New Caledonia G. Mou-Tham
Sspi01 28 June 2005 Récif Goéland, New Caledonia G. Mou-Tham
Sspi02 13 June 2006 Ngela, Solomon Is. E. Tardy
Sspi03 19 June 2006 Ngela, Solomon Is. E. Tardy
Sspi04 27 Aug. 2006 Manus I., Papua New Guinea P. Boblin
Sspi05 27 Aug. 2006 Manus I., Papua New Guinea P. Boblin
Sspi06 27 Aug. 2006 Manus I., Papua New Guinea P. Boblin
Sspi07 27 Aug. 2006 Manus I., Papua New Guinea P. Boblin
Sspi08 27 Aug. 2006 Manus I., Papua New Guinea P. Boblin
Sspi10 27 Aug. 2006 Manus I., Papua New Guinea P. Boblin
16
Sspi12 27 Aug. 2006 Manus I., Papua New Guinea P. Boblin
Sspi13 27 Aug. 2006 Manus I., Papua New Guinea P. Boblin
Sspi14 21 Feb. 2007 Bali barat, Indonesia F. Giancarlo
Sspi34-1 2 27 Mar. 2006 Opunohu Bay, Moorea D. Lecchini
Sspi34-2 1 27 Mar. 2006 Opunohu Bay, Moorea D. Lecchini
Sspi34-2 2 27 Mar. 2006 Opunohu Bay, Moorea D. Lecchini
Sspi34-2 3 27 Mar. 2006 Opunohu Bay, Moorea D. Lecchini
S. sutor
INS0001 31 Mar. 2014 Inhassoro, Mozambique A. Brito
INS0002 31 Mar. 2014 Inhassoro, Mozambique A. Brito
INS0004 31 Mar. 2014 Inhassoro, Mozambique A. Brito
INS0005 31 Mar. 2014 Inhassoro, Mozambique A. Brito
INS0006 31 Mar. 2014 Inhassoro, Mozambique A. Brito
INS0007 31 Mar. 2014 Inhassoro, Mozambique A. Brito
INS0008 31 Mar. 2014 Inhassoro, Mozambique A. Brito
INS0009 31 Mar. 2014 Inhassoro, Mozambique A. Brito
INS0011 31 Mar. 2014 Inhassoro, Mozambique A. Brito
INS0012 31 Mar. 2014 Inhassoro, Mozambique A. Brito
INS0013 31 Mar. 2014 Inhassoro, Mozambique A. Brito
INS0014 31 Mar. 2014 Inhassoro, Mozambique A. Brito
INS0015 31 Mar. 2014 Inhassoro, Mozambique A. Brito
INS0018 31 Mar. 2014 Inhassoro, Mozambique A. Brito
INS0019 31 Mar. 2014 Inhassoro, Mozambique A. Brito
INS0020 31 Mar. 2014 Inhassoro, Mozambique A. Brito
INS0022 31 Mar. 2014 Inhassoro, Mozambique A. Brito
INS0023 31 Mar. 2014 Inhassoro, Mozambique A. Brito
INS0024 31 Mar. 2014 Inhassoro, Mozambique A. Brito
INS0025 31 Mar. 2014 Inhassoro, Mozambique A. Brito
INS0026 31 Mar. 2014 Inhassoro, Mozambique A. Brito
INS0027 31 Mar. 2014 Inhassoro, Mozambique A. Brito
INS0028 31 Mar. 2014 Inhassoro, Mozambique A. Brito
INS0029 31 Mar. 2014 Inhassoro, Mozambique A. Brito
INS0031 31 Mar. 2014 Inhassoro, Mozambique A. Brito
INS0032 31 Mar. 2014 Inhassoro, Mozambique A. Brito
INS0033 31 Mar. 2014 Inhassoro, Mozambique A. Brito
INS0034 31 Mar. 2014 Inhassoro, Mozambique A. Brito
INS0035 31 Mar. 2014 Inhassoro, Mozambique A. Brito
INS0036 31 Mar. 2014 Inhassoro, Mozambique A. Brito
INS0037 31 Mar. 2014 Inhassoro, Mozambique A. Brito
INS0038 31 Mar. 2014 Inhassoro, Mozambique A. Brito
S. vulpinus
17
Online Resource 2
Procedure of selection of the di-, tri- and tetra-nucleotide microsatellite markers from the sequences containing repeats to the design of primers
Statistic Length of repeat
Di-nucleotide Tri-nucleotide Tetra-nucleotide
Number of sequences containing repeats 310 61 421
Number of sequences with adequate flanking
regions 56 21 190
Number of sequences > 100bp in length with no
duplicates 28 12 38
Number of sequences with designed primers 21 5 33
a Primers were designed using the program PRIMER DESIGNER v4.20 based on the standard criteria (melting temperature, GC content, presence
18
Online Resource 3
Details of the 17 polymorphic markers genotyped in Siganus sutor, including locus name, fluorescent dye, repeat motif, annealing temperature (TA) and the allele size range in base pairs
Locus Dye Repeat motif TA (°C) Allele range (bp)
ORLA2-91 b, c NED (GT)7 60 134-174
ORLA8-113 b, c PET (CA)13 60 161-167
ORLA11-71 a, c 6-FAM (CA)8 60 377-387
ORLA12-160 b, c PET (CA)12(TA)(CA)6 60 283-303
ORLA14-42 b, c PET (CA)10 60 368-400
SIG006 a NED (CAAA)9 55 215-251
SIG007 a VIC (CAAA)5(CAGA)(CAAA)8 55 191-259
SIG008 a 6-FAM (ATAG)4(GTAG)(ATAG)11 55 130-186
SIG009 a PET (AGAT)18 55 196-352
SIG010 a 6-FAM (AGAT)12 55 238-282
SIG011 b VIC (AGAT)16 55 184-268
SIG013 b 6-FAM (GTTT)11 57 266-282
SIG014 a VIC (GTTT)11 55 333-369
SIG015 b NED (CTTT)11(CTCT)(CTTT)6 55 243-299
SIG017 a PET (CAG)8 55 102-117
SIG019 b 6-FAM (GTT)12 55 187-235
SIG020 a NED (ACC)15 57 115-157
a Multiplex combination 1
b Multiplex combination 2
c Primer set from Gotoh et al. (2013)
19
Online Resource 4
Details of the 59 microsatellite markers designed from the repeat-enriched library obtained for Siganus sutor, including locus name, forward and reverse primer sequences, repeat motif and size of microsatellite amplicon in base pairs
Locus Forward primer 5’ – 3’ Reverse primer 5’ – 3’ Repeat motif Amplicon size (bp)
SIG001 GTGGCACGAACAACACATGA GGGCTTTGCAAGTCACGAAGTC (ATCT)10 231
SIG002 a CTTGGCAAGCAATGGAAGC AGTGAGTTGCCTGGAAAG (ATCT)21 308
SIG003 a ACATTTAGCGTGGGAGAC TTCTGCATCAGACTGAAC (ATCT)12 153
SIG004 a CCTCCGTGGAAGTCAACAG AATCATGGCGACTGTTGAGC (GT)9 175
SIG005 a GTCGAAGGTCGTAGTTCTTG GCATGCCTGTGACTGTCAAC (ATCT)13 261
SIG006 a, b AACTGTGTGAGCGATCTG TCAGTACAGCGTGACATC (CAAA)9 237
SIG007 a, b AAACAAACGTCCGGAAAC GGTCAGTCAGCATCGTAA (CAAA)5(CAGA)(CAAA)8 265
SIG008 a, b TGCTAAATGTCCCTTCAC TGGATCTGTGCTACCTAC (ATAG)4(GTAG)(ATAG)11 160
SIG009 a, b TCCTGCTACCCACTCCTTC ATTACAGGAAGCGGAAAC (AGAT)18 243
SIG010 a, b ATCTGACGGATACGATTC TCGAGCAGAATGGCACTCAG (AGAT)12 269
SIG011 a, b TTCTCCTAGGCCTGGAGATG CCTCCTCTAATGCACCTAT (AGAT)16 211
SIG012 a GGCTCGTTGACCTCTCAG AGAACAAACTCCGGAAAC (GTTT)8 293
SIG013 a, b CGGCTCTTTTGTGTCTGT ACAATGTTGCGCTCACTC (GTTT)11 269
SIG014 a, b TGGCTGTTCCTTACTGTCT TATGACGGCCACTAGATG (GTTT)11 354
SIG015 a, b GGGGAGAGAAATGATAGC CCGCATTAGTAATTGCTC (CTTT)11(CTCT)(CTTT)6 279
SIG016 a GGCTATGCACTGATTCAC ACATAATCCCATCAGCAG (AGC)8 124
SIG017 a, b GAGTGGGTGTCCTGAATG AGCATCAATAGACGTGTG (CAG)8 111
SIG018 a ACTGATGAGCTGGTTTTC TGCTGCTGTCAGCAGTTC (AGG)9 115
SIG019 a, b AAGTAGCGCCACCTTCTG TGACAGCTTGCAGCAGAA (GTT)12 198
SIG020 a, b TCTGAACCATGAGCTTCC TCGAACGGAGACGCTTCA (ACC)15 138
SIG021 CTTCTCGCCTTCCAGCTCATC TGTGATGAGTACCTGAGTAA (CTTT)10 349
SIG022 GAGGCAGTGACAGCCTGTCT GTAAGGTGCTGCAGCAGGATG (CTTT)14 189
SIG023 ACACAGGACCTGCAAGAGA TGCGGATAGGCTCCAATGACC (ATCT)14 268
SIG024 ATGAGACCGTACATCTTCATC TTGTTGGGTTTAGTTCTAGGA (GT)13 173
SIG025 CCAATGCAGCACATTCAGT GGATGTTGTAGCAGCCTCCA (GT)11 130
SIG026 TTTCCTCTACCACCTCTCATC CGAATGACTTCGCTGGAAC (ATCT)10 223
SIG027 TCAGAACCGCCTCTCACTGC AAGAAGTACGAGTGATAGAG (CT)9 163
SIG028 GGGGGCGCAATAGTAAGATG TCAGATTGGAGGCCACAATCC (ATCT)19 245
SIG029 TCCTCTGCCATTAGGTTCTG GGCGTAAACTTACAGTACA (GT)9 150
SIG030 TTATGCCACACTGGAGGTTC CCTCCCTTGATGTGGAGTAG (GT)11 160
SIG031 CCACAACACACATATACAC GTGCAGCAGTAAGGTGGTCT (ATCT)15 204
SIG032 F:GAGGGCTTCTCTTACAGTAG ATGGAGGCGAGAGGCAGAGA (ATCT)19 294
SIG033 CATCAACAGGTTGGCTACAG GTACCAGCCTGGAAACTAGC (GT)8 156
SIG034 TCCTCATCGCACTCGCCAGA ACGCAGATCGTGATGAGTC (ATCT)13 300
SIG035 GGCAGTGCTGGTGGATCTAC ACGCAGAGGAAACACAGAAC (GT)9 152
SIG036 GTGGCCGTTCTTATATTATG CTAATGAGGTCGAGTCC (GT)8 136
SIG037 CAGCGCTGATGGCACAATCC CTTCTCTCCTTTTTTCTTAC (GT)18 224
20
SIG039 GTGGGGCCAATATCTGTGGG AGCCTGGCCAATATCTGAGTG (ATCT)12 208
SIG040 TGACGACTAGGCTAGCAGAG ACCCTCAGGCTCCAATACCTT (AAAC)13 194
SIG041 CTGGATGCACAGGTGTGTA GGTTCACAGGTGGCTGCTGCTG (AAAC)13 236
SIG042 CTGGGTCGAGTCGCCCCC TGCTTCTGTCGTTGCATCAG (AAAC)10 166
SIG043 ACCTGCCATCTGTATCATTC CATGGCGGGAAACGTTCTGAGC (AC)8 122
SIG044 CGTAGCCCGTGGCCGTGTAG CGTTAGCCCGTCCACGGCGT (AC)11 164
SIG045 AGTGTATGAGGACGAGCGG TGTTGTCTCACTTTACAACAACAC (AAAC)9 236
SIG046 TCAACAACTGGAATCAACAAACTG CTGATCTCCGTGCTCCACC (AAAC)13 248
SIG047 AGAAACAAACGTCCGGAAAC CCTGAGTAATCATCTCCGGC (AAAC)8 311
SIG048 TGACTCATGCACAAGTACATCC TTGTGGTAATATACAGGGCGG (AAAC)13 187
SIG049 ACACACTCCCCTATTCCTGC TAACGTCTGGGACGAGAGC (AGAT)17 197
SIG050 TCACGCTCAGCAAGTAACC ACTGGTGAGACTATTCTTGGC (AAAC)10 176
SIG051 ACTGTTGCCATAGTGAAGTGC AGCGCACTGTGTCCATTAG (AC)8 161
SIG052 ACATTTATGTCTTAGCAACGGGG ACAAAGTGGAGGCGAACTG (AC)11 181
SIG053 TCCCCACAGTGTTTCCACC ACAGCTTTTGGCCCTTCAG (AC)10 232
SIG054 ACACTCTCACACAGACCTGC ACGGCGAGCCTACTTACTTC (AC)20 221
SIG055 GCCGGTCTGGTAGTCAAAAC ATTAGTGTTGGACAAATGCCCC (AC)9 159
SIG056 CTCTTACGTGCATACACAGTTG AAAGTATGGCCCGGCAGATG (AC)10 151
SIG057 GGGATGAAGTGGTAGAAGAAGC ATGATGTCCACGGAGAGCC (AC)13 155
SIG058 CCAACCTGCACGCTCTATC GATCGCGGTCAAAGGTCAAC (AC)12 152
SIG059 CGTACTGATCACCGATGGC ACCTTTGTACAGCGACCTTG (AC)12 162
a Primer pair tested for PCR-amplification in other Siganus spp.
21
Online Resource 5
GenBank accession numbers for cytochrome b-gene sequences of Siganus spp.
Species GenBank accession no.
S. argenteus
AB276798-AB276814; AY190542; DQ898028-DQ898036; EF210174
S. canaliculatus
EF210176; GU929677
S. corallinus
AB276925, AB276926, AB276928, AB276930, AB276931
S. doliatus
AB276951-AB276957, AB276960; DQ898038
S. fuscescens
AB276822-AB276825, AB276830; GU929680-GU929684; HQ843182-HQ843185, HQ843187-HQ843191, HQ843196, HQ843197, HQ843200, HQ843201, HQ843209-HQ843217, HQ843227, HQ843228, HQ843230-HQ843232, HQ843235, HQ843236, HQ843238-HQ843242, HQ843246 S. luridus DQ898056-DQ898058; EF210185, EF210186 S. punctatus AB276873-AB276880; DQ898068-DQ898074, DQ898092; EF210187 S. puellus AB276855-AB276867; DQ898063-DQ898067 S. rivulatus DQ898075-DQ898078 S. spinus
AB276815-AB276821; AY190545, AY190554; DQ898079-DQ898082; EF210189-EF210192
S. sutor
EF210193, EF210194
S. vulpinus
AB276902; AY190548; DQ898084; DQ898085; DQ898086; DQ898087; DQ898088; DQ898089 Some of the sequences available from GenBank were dismissed because of suspected misidentification, mtDNA introgression or cryptic species. These included AB276924-AB276931 labelled S. corallinus and AB276834-AB276850, DQ274055, EF210175, GU929678, GU929679 labelled S. canaliculatus
22
Online Resource 6
Cytochrome b-gene sequences of Siganus spp. that were newly generated, including species name, specimen identification number (ID), sampling location and GenBank number
Species Specimen ID Sampling location GenBank no.
S. laqueus RB09-241 Mozambique MF326182 T-66 Seychelles MF326187 KEN0001 Kenya MF326163 KEN0012 Kenya MF326164 KEN0013 Kenya MF326165 KEN0030 Kenya MF326166 TZW067 Tanzania MF326188 S. sutor R0301-211 La Réunion MF326167 R0301-212 La Réunion MF326168 R0301-213 La Réunion MF326169 R0301-214 La Réunion MF326170 R0301-215 La Réunion MF326171 R0301-216 La Réunion MF326172 R0301-217 La Réunion MF326173 R0301-218 La Réunion MF326174 R0301-219 La Réunion MF326175 R0301-220 La Réunion MF326176 R0301-221 La Réunion MF326177 R0301-222 La Réunion MF326178 R0301-223 La Réunion MF326179 R0301-224 La Réunion MF326180 R0301-225 La Réunion MF326181 Ssut10 Rodrigues MF326183 Ssut14 Rodrigues MF326184 Ssut17 Rodrigues MF326185 Ssut21 Rodrigues MF326186
23
Online Resource 7
Repeat-containing library information for Siganus sutor. Frequency of repeat types in the library (6112 sequences obtained by 454 pyrosequencing). The search criteria for the different repeat types were: ≥10 repeat motifs for mono-nucleotide; ≥8 for di-, tri- and tetra-nucleotide; ≥4 for penta- and hexa-nucleotide.
24
Online Resource 8
Siganus spp. Species-pairwise Kimura-2-Parameter net mean genetic distance among species, based on cytochrome b-gene nucleotide
sequences Species Species 1 2 3 4 5 6 7 8 9 10 11 12 13 1. S. argenteus - 2. S. canaliculatus 0.164 - 3. S. corallinus 0.140 0.129 - 4. S. doliatus 0.157 0.140 0.011 - 5. S. fuscescens 0.130 0.057 0.144 0.149 - 6. S. laqueus 0.150 0.100 0.092 0.111 0.130 - 7. S. luridus 0.147 0.119 0.178 0.204 0.131 0.156 - 8. S. puellus 1.370 0.105 0.096 0.116 0.136 0.061 0.145 - 9. S. punctatus 1.590 0.110 0.090 0.103 0.134 0.014 0.166 0.064 - 10. S. rivulatus 0.166 0.059 0.176 0.118 0.064 0.127 0.134 0.115 0.131 - 11. S. spinus 0.202 0.120 0.184 0.178 0.088 0.161 0.146 0.177 0.165 0.119 - 12. S. sutor 0.165 0.036 0.161 0.073 0.051 0.111 0.126 0.129 0.128 0.035 0.125 - 13. S. vulpinus 1.132 0.121 0.103 0.116 0.130 0.061 0.141 0.062 0.059 0.128 0.162 0.134 -
25
Online Resource 9
Pairwise linkage disequilibrium estimates in S. spinus
Locus Locus
0RLA2-91
ORLA11-71 ORLA14-42 ORLA8-113 ORLA12-160 SIG006 SIG011 SIG017
0RLA2-91 - ORLA11-71 0.753 - ORLA14-42 0.959 0.792 - ORLA8-113 0.998 0.560 0.902 - ORLA12-160 0.998 0.346 0.992 0.998 - SIG006 0.216 0.691 0.925 0.205 0.186 - SIG011 0.620 0.532 0.915 0.107* 0.262* 0.170 - SIG017 0.661 0.171 0.923 0.487 0.499 0.455 0.640 - * P < 0.05 (1000 permutations)
26
Online Resource 10
Pairwise linkage disequilibrium estimates in Siganus sutor
Locus Locus ORLA 2-91 ORLA 11-71 ORLA 14-42 ORLA 8-113 ORLA 12-160
SIG006 SIG007 SIG008 SIG009 SIG010 SIG011 SIG013 SIG015 SIG017 SIG019 SIG020 0RLA2-91 - ORLA11-71 0.822 ORLA14-42 1 0.886 - ORLA8-113 0.287 0.620 0.097 - ORLA12-160 0.997 0.745 0.994 0.207 - SIG006 1 0.514 1 0.199 0.929 - SIG007 1 0.998 1 0.231 0.989 1 SIG008 1 0.736 1 0.192 0.949 0.896 0.998 - SIG009 1 0.990 1 0.941 1 1* 1 1 - SIG010 1 0.997 1 0.524 1 1 1 1 1* - SIG011 1 0.979 1 0.353 0.999 1 1 0.785 1* 1* - SIG013 0.986 0.343 0.859 0.770 0.555 0.260 0.537 0.091 1 0.995 0.511 - SIG015 1 0.769 1 0.230 0.991 1 1 1 1 1 1 0.900 - SIG017 0.915 0.271 0.734 0.452 0.634 1 0.970 0.990 1 0.953 0.776 0.921 0.933 - SIG019 1 0.831 1 0.604 0.998 1 1 0.999 1 1 1 0.904 1 0.954 - SIG020 1 0.437 1 0.425 0.999 0.889 1 0.615 1* 1 0.977 0.972 1 0.502 0.954 - * P < 0.05 (1000 permutations)