Spatially Invariant Coding of Numerical Information in Functionally De
fined Subregions
of Human Parietal Cortex
E. Eger1,2,3, P. Pinel1,2,3, S. Dehaene1,2,3and A. Kleinschmidt1,2,3,4
1
INSERM U992, Gif/Yvette, France,2CEA, DSV, I2BM, NeuroSpin, Gif/Yvette, France,3University Paris-Sud, Orsay, France and 4
Department of Clinical Neurosciences, University Hospital (HUG) and University of Geneva, CH-1211 Geneva, Switzerland
Address correspondence to Dr Evelyn Eger, INSERM U.992– Neuroimagerie Cognitive CEA/NeuroSpin, Bâtiment 145, Point Courrier 156, 91191 Gif/Yvette, France. Email: [email protected]
Macaque electrophysiology has revealed neurons responsive to number in lateral (LIP) and ventral (VIP) intraparietal areas. Recently, fMRI pattern recognition revealed information discriminative of individ-ual numbers in human parietal cortex but without precisely localizing the relevant sites or testing for subregions with different response profiles. Here, we defined the human functional equivalents of LIP (feLIP) and VIP (feVIP) using neurophysiologically motivated locali-zers. We applied multivariate pattern recognition to investigate whether both regions represent numerical information and whether number codes are position specific or invariant. In a delayed number comparison paradigm with laterally presented numerosities, parietal cortex discriminated between numerosities better than early visual cortex, and discrimination generalized across hemifields in parietal, but not early visual cortex. Activation patterns in the 2 parietal regions of interest did not differ in the coding of position-specific or position-independent number information, but in the expression of a numerical distance effect which was more pronounced in feLIP.
Thus, the representation of number in parietal cortex is at least par-tially position invariant. Both feLIP and feVIP contain information about individual numerosities in humans, but feLIP hosts a coarser representation of numerosity than feVIP, compatible with either broader tuning or a summation code.
Keywords: fMRI, multivariate decoding, number processing, parietal cortex
Introduction
The ability to approximately enumerate a set of objects is a basic capacity shared by humans and many other animals (Feigenson et al. 2004;Cantlon et al. 2009). Because this func-tion is thought to provide a foundafunc-tion for mathematical competence (Dehaene 1997) and correlates with higher math-ematical achievements (Halberda et al. 2008), its neurophysio-logical underpinnings are of considerable interest. Numerical processing relies on brain areas along the dorsal visual pathway in humans, as evidenced by neuropsychological and functional imaging findings (e.g., Cipolotti et al. 1991;
Dehaene 1997;Ansari 2008). Indeed, we have recently shown that the activation pattern in parietal cortex is specific enough to read out the individual number that a subject is processing (Eger et al. 2009), but that study did not more precisely define the contributing anatomical or functional subregions.
Using macaque electrophysiology, number-responsive neurons have been observed in the parietal lobe in lateral (LIP) and ventral (VIP) intraparietal areas (Nieder et al. 2006;
Roitman et al. 2007). Interestingly,firing rates showed mono-tonic increases or decreases with number in LIP, but tuning to a preferred number in VIP. This could correspond to 2 sequen-tial processing stages, as proposed by some computational
models (e.g., Dehaene and Changeux 1993;Verguts and Fias 2004). However, thesefinding were obtained by different lab-oratories, in distinct tasks, and at different training levels, and could therefore as well reflect differences in methodology. It thus appears important to test to what extent the equivalent regions contribute to the representation of individual numbers in humans.
Another recent issue of interest has been whether the rep-resentation of numerosity is spatially specific or invariant. Psy-chophysics has shown that numerosity can be adapted in a spatially specific way (Burr and Ross 2008), and a new compu-tational model based on unsupervised learning of numerosity (Stoianov and Zorzi 2012) supports the plausibility of a spatially selective processing stage. Which levels of the cortical hierarchy contain invariant versus spatially specific number codes, however, remains to be understood. One possibility could be that, due to the special processing demands of the dorsal stream in relation to object-directed action, any infor-mation represented in parietal cortex retains a large degree of spatial specificity. Alternatively, position specificity could differ between parietal subregions as a function of their recep-tivefield sizes: LIP neurons have smaller receptive fields than VIP neurons (Ben Hamed et al. 2001;Bremmer et al. 2002), and could therefore constitute an initial spatially selective pro-cessing stage preceding a more spatially invariant numerical representation that could exist in VIP. Finally, even in LIP some electrophysiological studies in macaques have described responses to nonspatial features (e.g., category membership) outside the neurons-receptive field, which could imply that spatial selectivity for a property such as number also need not necessarily follow the gradient of receptivefield sizes.
Human and nonhuman primate number discrimination be-havior (e.g., Moyer and Landauer 1967; Piazza et al. 2004;
Cantlon and Brannon 2006) is characterized by an effect of numerical distance, and numerical distance during comparison tasks affects the level of intraparietal activation in neuroima-ging (e.g.,Pinel et al. 2001;Castelli et al. 2006). The extent to which such comparison distance effects reflect represen-tational overlap or decision-related effect remains a subject of controversy (Van Opstal et al. 2008). The decoding of individ-ual numbers in the delayed number comparison paradigm used in our previous decoding work (Eger et al. 2009) is disso-ciating the representation of the numbers presented from decision- and response-associated components and thus allows for a cleaner assessment of representational overlap between numerically close numbers. Distance effects in our previous work, however, were restricted to the experiment in-volving small numbers of dots. One potential reason for this might be that, in the experiment involving larger numbers, Cerebral Cortex May 2015;25:1319–1329
doi:10.1093/cercor/bht323
these were separated by a rather large ratio so that distance effects arrived at saturation.
Building on our previous demonstration of information dis-criminative of individual numbers in human parietal cortex, the present study tried to clarify several issues about this number representation: First, using once again pattern recog-nition methods (Haynes and Rees 2006; Kriegeskorte et al. 2006; Norman et al. 2006), we wanted to test whether areas equivalent to those tuned or responsive to number in maca-ques also encode numerical information in humans. Therefore, we defined the functional equivalents of LIP and VIP (feLIP and feVIP) by neurophysiologically motivated localizer scans using, respectively, saccadic eye movements and a combina-tion of visual mocombina-tion and tactile stimulacombina-tion. Second, laterally presented numerosities allowed us to probe whether number representation was location-specific or generalized across left and right hemifields, within each of the regions tested. Third, we used numbers separated by a smaller ratio than previously to test whether and in which region effects of numerical dis-tance on pattern discrimination would appear in this situation, implying representational overlap of nearby numbers.
Materials and Methods
Participants and Data Acquisition
Fourteen healthy volunteers with normal or corrected vision (8 males and 6 females, mean age 23.7 ± 2.8 years) gave written informed consent and were included in the study which had been approved by the regional ethics committee (Hôpital de Bicêtre, France). Eleven of
the participants (6 males, 5 females) returned for a second imaging session on a different day to define functional subregions in parietal cortex. Functional images were acquired on a 3-Tesla MR system with a 12-channel head coil (Siemens TIM Trio, Erlangen, Germany) as T2*-weighted echo-planar image (EPI) volumes using a high-resolution
EPI-sequence. Thirty oblique-transverse slices covered occipital and parietal cortex and were acquired in interleaved order with a TR of 2.5 s (FOV 192 mm, fat suppression, TE 33 ms,flip angle 84°, voxel size 2 × 2 × 2 mm).
Paradigm and Stimuli Main Experiment
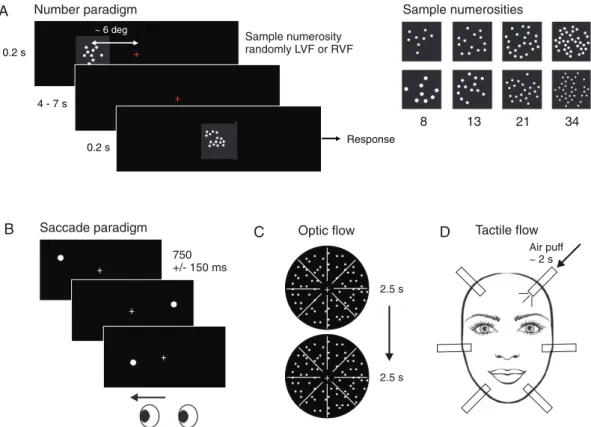
Visual stimuli were back-projected onto a translucent screen located at a distance of∼1 m from the subjects’ eyes at the end of the scanner bore and viewed via a mirror attached to the head coil. The trials in the delayed numerosity comparison task (Fig.1A) started with brief (200 ms) presentation of a sample dot pattern stimulus (8, 13, 21, or 34 dots) in light gray color on a black background subtending ∼6° of visual angle and appearing at an excentricity of∼ 6° either left or right of central fixation. The Fibonacci numbers 8, 13, 21, and 34 were chosen because their consecutive ratios are nearly equal (∼1.618) and they are, therefore, nearly equidistant on a logarithmic scale and thus equi-discriminable. After a delay of 4–7 s, a second dot pattern (the “match”) appeared for 200 ms. Participants were instructed to keep in mind the approximate number of dots in the sample stimulus and respond with 1 of 2 buttons held by their left and right hand depend-ing on whether the match numerosity was numerically smaller or larger than the previous sample numerosity. Again, the match numer-osities used had a constant ratio of∼1.6 relative to the sample numer-osities (thus smaller and larger match numerosites were 5 and 13 for sample 8; 8 and 21 for sample 13; 13 and 34 for sample 21; 21 and 54 for sample 34). The hands assigned to either smaller or larger
+ + ~ 6 deg + + ~ 6 deg 0.2 s + + + + 4 - 7 s + + Response + + 0.2 s + + + + + + A B C D Sample numerosity randomly LVF or RVF + + + + + + Air puff ~ 2 s 2.5 s 750 +/- 150 ms 2.5 s Number paradigm
Saccade paradigm Optic flow Tactile flow
Sample numerosities
8 13 21 34
Figure 1. Paradigm and stimuli: In the main experiment (A), participants were presented with sample numerosities 8, 13, 21, or 34 in either the left or right visual field, and had to compare the sample numerosity to a match numerosity presented after a delay of 4–7 s (smaller/larger judgment). fMRI activity patterns evoked by the sample numerosities were compared between conditions. Two subregions of interest in parietal cortex were defined by separate functional localizer sessions: For the functional equivalent of area LIP (B), visually guided saccades were compared with passivefixation of identical stimuli. In the case of the functional equivalent of area VIP, a paradigm involving visual stimulation by expanding—receding dot motion (optic flow: C), and air-puff stimulation of 6 locations of the subject’s face (tactile flow: D) was used (see Materials and Methods for details).
responses were systematically changed between scanning runs, with counterbalanced order across runs.
Dot positions were chosen randomly for each stimulus. In addition to the 2 sides of presentation of the sample stimulus, 2 stimulus lists differing in low-level parameters were used that either equated the overall number of gray pixels (list 1: resulting in decreasing dot size with increasing number) or dot size (list 2: resulting in increasing number of gray pixels) between numerosities (Fig.1B). Each exper-imental run contained 2 trials for each numerosity, side, and stimulus list (2 × 4 numerosities × 2 sides × 2 stimulus lists = 32 trials overall), which were presented in randomized order within each run. Each subject performed 8 runs of∼6 min length each of this numerosity comparison task.
Functional Localizers
The mapping of the human functional equivalents of areas LIP and VIP (feLIP and feLIP) used a procedure previously conceived in our labora-tory (Hubbard et al. 2008, Hubbard, E.M. et al. unpublished obser-vations), based on known neurophysiological response properties of LIP and VIP. We tested the parietal lobe for responsiveness to saccadic eye movements for definition of feLIP (Koyama et al. 2004) and to ap-proaching/receding dot motion in conjunction with tactile stimulation of the face for definition of feVIP. The stimulus conditions chosen to define feVIP were designed to account for the combined visual and tactile sensitivity which has been established by monkey neurophysiol-ogy (Avillac et al. 2005), and our stimulation conditions are similar to those already employed by previous studies in humans (Bremmer et al. 2001; Sereno and Huang 2006). The feLIP localizer experiment (Fig.1B) comprised 1 run of ∼10 min, and included blocks of 15 s of either saccadic eye movements, or central fixation with identical stimuli, interleaved by baseline periods of 5 s. During saccade blocks (indicated by a greenfixation cross), participants executed saccades toward a dot target stimulus that jumped on average every 750 ms ( jit-tered in 4 levels between 600 and 900 ms) between the left and right side offixation (average saccade target locations at 8° lateral of fixation with a random jitter of 2° in x and y coordinates). During fixation blocks (indicated by a redfixation cross), participants were presented with the identical target moving while they kept centralfixation.
The feVIP localizer experiment (Fig.1C,D) consisted of 3 runs of ∼9 min length during which participants were presented in random-ized order with blocks of 15 s length of either tactile stimulation of the face, expanding/receding dot motion, or baseline (static dots). For the tactile stimulation condition, a custom-built stimulation device deliv-ered air-puff stimulation in randomized order to 6 locations of the face: left and right forehead, cheeks, and chin. The order of stimulated locations was randomized within each block, and air-puff on- and offset were controlled manually by the experimenter according to a visual instruction on the computer screen (unseen by the participant) so that each location was stimulated for∼2 s with 0.5 s ISI in each block of 15 s. In the visual motion condition, each block comprised 6 trials of 2.5 s each of radially expanding and receding dot motion. Ran-domly distributed medium gray dots (diameter 4 pixels or 0.09° VA) covering 1% of the overall area within a circular area of∼16° VA width around centralfixation were moving with an average speed of 11°/s (1.25 s expanding and 1.25 s receding). In the control condition, static dots were presented for 15 s in the same circular area.
Image Processing and Data Analysis
The initial analysis of the functional imaging data used the statistical parametric mapping software (SPM5, http://www.fil.ion.ucl.ac.uk/ spm/software/spm5). EPI images were motion-corrected and co-registered to the subject’s T1image. Normalization parameters
de-termined on the basis of the anatomical image (using SPM’s function for combined segmentation and normalization) were then applied to the EPI data. The unsmoothed EPI images were entered into a general linear model, modeling separately the effects of the 16 sample stimulus conditions (4 numerosities × 2 sides × 2 stimulus lists), and 16 match stimulus conditions (4 numerosities × smaller versus larger match stimulus × 2 stimulus lists) as stick functions (using the default of 0 dur-ation for events) convolved with the standard hemodynamic response
function (without derivatives). Serial autocorrelation was accounted for with an AR(1) model and low-frequency drift terms removed by a high-pass filter with a cutoff of 128 s. Contrast images were then created for the 4 sample numerosities by 2 presentation sides, pooling the trials from the 2 stimulus lists. This was done to enhance the signal-to-noise ratio (number of trials per condition) for pattern recog-nition analysis. We nevertheless verified that in the current data classifi-cation of number did not significantly interact with stimulus list. For separate analyses of stimulus lists and classifier generalization between stimulus lists, see our previous work (Eger et al. 2009). The resulting 8 estimates of fMRI signal change for each sample condition (1 contrast of parameter estimate images per run and condition) were then entered into pattern recognition analysis.
We defined the relevant ROIs in parietal cortex based on random-effects group analyses across the 11 volunteers who had been available to participate in the localizer experiments, after an additional smoothing with a 6-mm FWHM Gaussian kernel. A group-based ROI definition was used because, at the individual subject level, activations were in many cases too weak to permit reliable ROI definition, especially for sensitivity to multisensory motion. For the saccade-sensitive ROI (feLIP), the contrast of saccades versusfixation with identical stimulation was calculated. In the case of the multisensory motion-sensitive ROI (feVIP), a conjunction between the contrasts of tactile stimulation versus baseline, and opticflow versus baseline was used (baseline being static dots in the 2 cases). Within an anatomically defined mask of superior and inferior parietal lobules (WFU-PickAtlas: http://www.fmri.wfubmc.edu/software/PickAtlas), these contrasts were custom-thresholded to select an equal number of 300 voxels in each hemisphere. The resulting respective thresholds weret = 4.99 and t = 4.88 for saccades (left and right hemisphere), tmin= 1.58 andtmin=
1.34 for the multisensory motion conjunction (left and right hemi-sphere). Any residual overlap between the 2 group ROIs (54 voxels in the left and 48 voxels in the right hemisphere) was then discarded by exclusive masking. Within each group-defined ROI and hemisphere, we selected the 150 voxels that responded most strongly to all numbers versus baseline in the main experiment within each subject for pattern recognition analysis. For display of these group ROIs, surface renderings to the PALS atlas of Caret 5.51 software (http://www.nitrc.org/projects/ caret/) were used. In addition, SPM Anatomy toolbox version 1.8 (http:// www.fz-juelich.de/SharedDocs/Downloads/INM/INM-1/DE/Toolbox/ Toolbox_18.html) was used to investigate the correspondence of the group activations obtained for feLIP and feVIP with a probabilistic atlas of cytoarchitectonics. Anatomy toolbox further provided an anatomical mask of area 17 used to define an early visual cortex ROI that was com-pared with parietal cortex regarding its capacity for number discrimi-nation (within this anatomical ROI the same number of voxels was chosen in each participant as in the combined parietal ROI, based on the same criterion of overall activation vs. baseline).
Pattern recognition analysis was based on linear support vector machines (SVMs) (Vapnik 1995;Christianini and Shawe-Taylor 2000). A multiclass SVM algorithm implementing a one-versus-all scheme provided by scikit-learn (Pedregosa et al. 2011) (http://www. scikit-learn.org) was used as a soft-margin classifier with a fixed regu-larization parameterC = 1. In the multiclass implementation, all poss-ible combinations of classification of one condition against all others are tested, and the combined output of these classifiers is used to assign the test data to one of the original conditions (e.g., 1 of 4 numbers in our case, for which the chance level would be 25%). The data entering classification were pattern vectors corresponding to the session-wise estimates of BOLD-signal change (contrast images) across all voxels in each ROI, with the mean across voxels subtracted from each vector. Classification analysis consisted in a leave-one-out predic-tion with 8-fold cross-validapredic-tion, implying that one contrast image per condition (corresponding to the data of 1 run) was held out at each cycle of the cross-validation loop while the classifier was trained on the remaining 7 images (7 runs) per condition and then tested on the data from the left-out run. After completion of the cross-validation cycle, percent correct on the test data was calculated across all rounds.
Classification of number proceeded by training the classifier to dis-criminate between data from the 4 numbers in one location, and sub-sequently testing it on left-out data (1 session) of either the same
numbers in the same location, or the same numbers in the different location. In an analogous fashion, position classification consisted in training on data from the 2 positions for a given number and then testing the left-out session for either the same or a different number, after which 2 averages were calculated, 1 for classification accuracy for pairs with test on the same number and 1 for accuracies with test on a different number. After obtaining the classification scores for each com-parison, permutations of the original condition labels (1000 cycles) were carried out to compute classification z-scores within each partici-pant. The averages of thesez-scores across the relevant comparisons for either number or location were used for statistical analyses across participants, employing either two-tailed one-samplet-tests to assess above-chance discrimination in individual comparisons/regions, or repeated-measures ANOVAs for comparisons between conditions and/ or regions.
For the analysis of effects of numerical distance on pattern discrimi-nation, we separately computed classification accuracies and sub-sequentlyz-scores for all the potential pairwise comparisons between numbers (collapsed across location), and then fitted a multiple regression model to the z-scores at the within-subject level. The regression model included as predictors a constant, the average size of the 2 compared numbers, and the ratio of the 2 compared numbers (a measure of their distance, appropriate for nonsymbolic numerosities (see, e.g.,Piazza et al. 2004). An across-subject statistics was calculated on the estimatedβ values, employing ANOVAs to test for differences between regions and one-samplet-tests for difference from zero. An additional analysis of distance effects was carried out at the level of individual voxels. After a preprocessing identical to the classification analysis (extraction of session-wise contrast images, and subtraction of the mean across voxels from each pattern), we selected in each subject and ROI the 50 voxels with the highestF-value for the main effect of number. Responses in these voxels were normalized so that the pre-ferred number was scaled to 1 and the least prepre-ferred number to 0, and averages were then computed as a function of distance from the pre-ferred number for each voxel and subsequently across voxels (similar to the procedure used for analysis of distance effects in neurophysiolo-gical data (see, e.g.,Nieder and Miller 2004). On these data, a repeated-measures ANOVA was conducted with the factors of region, hemisphere, and distance (1 vs. 2 steps).
Results
Regions of Interest
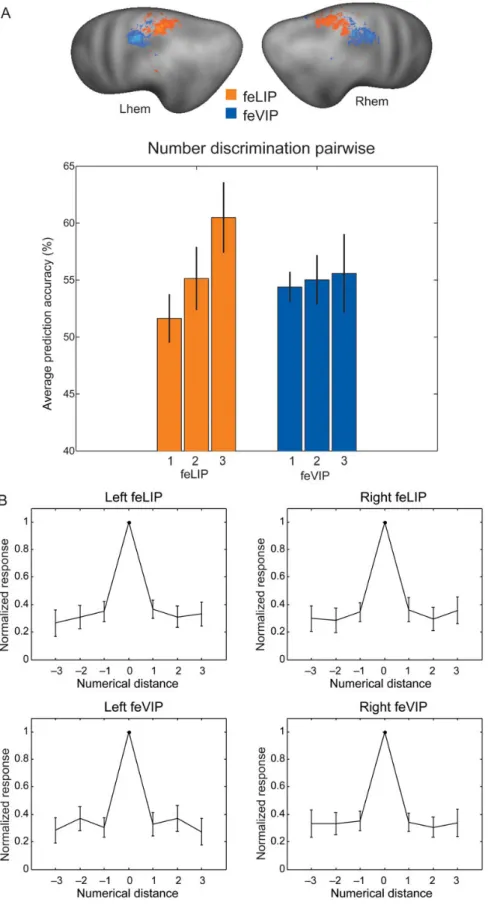
Mapping of the functional equivalents of LIP and VIP at the group level (see Materials and Methods) yielded 2 regions in the intraparietal sulcus/superior parietal lobule with feLIP being located somewhat more posterior than feVIP (see Fig.2). The average coordinates of the group ROIs were−27.7 –58.1 55.3 and 22.9 –61.0 54.2 for left and right feLIP, and – 33.0–49.0 57.4 and 29.1 –49.4 54.3 for left and right feVIP. Projecting our group ROIs onto a probabilistic cytoarchitec-tonic atlas (SPM Anatatomy toolbox) yielded the following as-signments: For left feLIP, 85% of the ROI could be assigned to defined cytoarchitectonic areas. The majority of voxels (128) was located in the SPL, with 93 voxels being assigned to area 7A and 33 voxels assigned to area 7PC. Thirty voxels were located in the intraparietal sulcus of which 25 were assigned to area HIP3. Nineteen voxels were assigned to inferior parietal cortex (IPC), of which 17 to area PF. In the case of right feLIP, 59% of the ROI could be assigned to defined cytoarchitectonic areas. One hundred twenty-five voxels were located in the SPL, of which 62 were assigned to area 7A, 42 to area 7PC, and 16 to area 5L. Only 9 and 6 voxels were assigned to areas HIP3 and IPC/PFt, respectively. For left feVIP, 94% of the ROI could be assigned. One hundred one voxels were assigned to area 2, 82 to the SPL (45 area 7PC and 34 to area 7A), and 31 to HIP3.
In the case of right feVIP, 87% of the ROI could be assigned. One hundred twenty-one voxels were assigned to area 2, and 17 voxels to area 3a. Fifty-three voxels were in the SPL, with the majority (38) being assigned to area 7PC. Twenty-three voxels were in the intraparietal sulcus, of which 21 in HIP3.
Number Discrimination in Parietal and Early Visual Cortex
In afirst step, we assessed number discrimination in parietal cortex in the current paradigm, and compared it with the level of decoding achievable from early visual cortex (a comparison which had not been done in our previous study due to restric-tion of the high-resolurestric-tion scans to parietal and frontal areas). We therefore concatenated the voxels from the parietal feLIP and feVIP ROIs in each hemisphere, and selected an equal number of voxels in left and right early visual cortex (within an anatomical mask of area 17, see Materials and Methods for details). Figure2A shows classification performance for early
visual cortex (left) and parietal cortex (right), where classi fi-cation performance appears to be better on average when training and testing in the visualfield contralateral to the stimu-lus in early visual cortex, while this was no longer the case in parietal cortex. A repeated-measures ANOVA with factors of region (early visual versus parietal), hemisphere, presentation side (left vs. right) and train-test-side congruency (test same vs. different side) confirmed a significant main effect of region (F1,13= 6.73,P < 0.05), indicating overall better number classifi-cation performance in parietal than early visual cortex, and train-test-side congruency (F1,13= 13.42, P < 0.01) indicating better performance when train and test side were congruent than incongruent. In addition, the three-way interaction of region, hemisphere, and stimulation side (F1,13= 9.66,P < 0.01) and the four-way interaction of all factors reached significance (F1,13= 5.590,P < 0.05).
To further understand the nature of the observed four-way interaction, we subsequently conducted separate ANOVAs per region. In early visual cortex, the three-way interaction of hemisphere, stimulation side and train-test-side congruency was significant (F1,13= 9.25, P < 0.01), as were the two-way interaction of hemisphere and stimulation side (F1,13= 9.25, P < 0.01), and the main effects of train-test-side congruency (F1,13= 14.15, P < 0.01) and stimulation side (F1,13= 6.12, P < 0.05). An interaction of hemisphere and stimulation side appeared when further restricting analysis to the data with congruent train and test side (F1,13= 14.86,P < 0.01), but not when restricting to the data with incongruent train and test side (F = 0.05). An equivalent ANOVA for parietal cortex did not reveal any significant main effects or interactions (all F < 1.2). Classification performance was significantly above chance for the averages of test on same side (t13= 3.73, P < 0.01) and test on different side (t13= 2.77,P < 0.05).
To summarize thisfirst part of the results, as expected from its retinotopic organization, early visual cortex preferentially discriminated between numbers in the contralateral hemifield when training and testing the classifier on data from the same location, compatible with a location-specific representation of the stimulus. In addition, unexpectedly, in early visual cortex, discrimination was better for numbers in the left than the right visualfield. In parietal cortex, no significant effects of spatial location or hemisphere were observed, indicating that numbers were coded differently and in a less location-specific manner.
Number- and Location Discrimination in Parietal Subregions (feLIP and feVIP)
Next, we investigated number discrimination more specifically in each of the 2 functionally defined parietal subregions.
An initial ANOVA with the full set of factors (region, hemi-sphere, stimulation side, and train-test-side congruency) did not reveal any significant main effects or interactions. Having ruled out effects of hemisphere, to enhance sensitivity for our Figure 2. (A) Classification performance for the left and right early visual cortex, and for the left and right parietal cortex (concatenating the voxels from feLIP and feVIP). (B) Classification performance for feLIP and feVIP, as well as the 2 regions combined, after concatenating the voxels from left and right hemispheres. Means across 14 subjects ± SEM are displayed. Chance performance is 25% for number classification and 50% for location classification. The group ROIs for feLIP and feVIP (RFX analysis based on 11 participants) are rendered onto the average surface of Caret PALS atlas (see Materials and Methods for details of ROI definition).
question of interest (the existence of location-specific or location-invariant number codes), we therefore concatenated the voxels from both hemispheres for each ROI, and ran classi fi-cation analyses on these data. The results in Figure 2B (left
panel) show that classification accuracies for training and testing on numbers presented in the same location were roughly comparable in saccade (feLIP), and multisensory motion-sensitive (feVIP) ROIs. Classification performance was signifi-cantly above chance in both cases:t13= 2.27,P < 0.05, t13= 2.63, P < 0.05, for feLIP, and feVIP, respectively). When training and testing on data from different locations, classification accuracies for number were on average slightly lower in both regions. While in the feLIP ROI, the comparison with test across location was still significantly above chance (t13= 2.86,P < 0.05), in the feVIP ROI, it only showed a nonsignificant trend (t13= 1.87,P = 0.08). However, this trend for a difference between ROIs was not significant, as an ANOVA with the factors of region and train-test-side congruency did not reveal any significant effects.
As neurophysiological studies suggested that LIP and VIP differ in the size of their receptive fields, we further tested whether location information itself could be decoded from the 2 parietal regions of interest. Location information (Fig. 2B,
right panel) was highly significantly above chance in the feLIP ROI (t13= 7.02,P < 0.0001 for test on the same number, and t13= 5.76,P < 0.0001 for test on a different number), and also significant in the feVIP ROI (t13= 3.83,P < 0.01 for test on the same number, andt13= 5.23,P < 0.001 for test on a different number). Location discrimination tended to decrease from the feLIP to the feVIP ROI, yet this trend remained nonsignificant (F1,13= 0.45,P = 0.09).
A previous study (Santens et al. 2010) has reported a para-metrically increasing fMRI signal for small numbers of dots in a region of posterior parietal cortex which, although not
functionally defined, may correspond to the human equivalent of LIP. Since such a broad difference in activation could also contribute to significant decoding of number, we considered the possibility that our classification accuracies were driven by differences in mean signal instead of response patterns, or did so to a different degree across our 2 regions of interest. However, unlike the findings for the mean-corrected pattern reported above, classification on the basis of the average signal across voxels did not reach significance except, at a modest level, in a single case: For numbers in the different location condition in feLIP (t13= 2.46,P < 0.05). The average responses across the different conditions are presented in Figure 3. Although there appear slight differences in mean activation across conditions in some regions, these changes were not monotonically increasing, and were not sufficient to drive sig-nificant classification performance in most cases as indicated by the above analyses.
Numerical Distance Effects
Our previous work (Eger et al. 2009) showed that pattern dis-crimination performance reflected the ordered nature of numbers: fMRI decoding was better when the 2 discriminated numbers were numerically distant than when they were close. This numerical distance effect is important because it suggests that the representations of nearby numbers overlap. However, we only observed this distance effect within small numbers of dots (2–8), perhaps because the larger numbers we used were all relatively distant (ratios were 2, 4, or 8). We therefore wanted to test whether such a distance effect might be found with the larger and closer numbers used here (ratios were ∼1.6, 2.5, and 4.8), and when focusing on our specific regions of interest. Therefore, we entered the subject-wise classification
Figure 3. (A) Classification performance based on the mean signal for feLIP and feVIP, displaying means across 14 subjects ± SEM. Chance performance is 25%. (B) Regional mean signal ( parameter estimates) for left and right early visual cortex (EV L and EV R), and left and right feLIP and feVIP (means across 14 subjects ± SEM).
z-scores for all possible pairwise comparisons between individ-ual numbers into a multiple regression model that included as predictors the ratio of each number pair (distance effect), its mean size, and a constant. To test to what extent the distance effect differed between regions or hemispheres, we performed ANOVAs on the subject- and region-wise β estimates with factors of region (feLIP vs. feVIP) and hemisphere (left vs. right). A significant effect of region was found for the estimates of the distance effect (F1,13= 12.8,P < 0.01), corresponding to a more pronounced effect of numerical distance in feLIP com-pared with feVIP (see Fig.4A), while the factor of hemisphere
(F1,13= 0.30), as well as the region by hemisphere interaction (F1,13= 0.10) remained nonsignificant. In post hoc one-sample t-tests, a significantly larger than zero distance effect was con-firmed in left (t13= 4.23,P < 0.01) and right (t13= 2.95,P < 0.05) feLIP, but absent in left (t13= 0.13) and right (t13= 0.07) feVIP. An equivalent analysis was carried out on the ROI mean signals in which case neither a significant effect of region (F1,13= 0.092) nor of hemisphere (F1,13= 0.009) nor interaction between the 2 (F1,13= 0.082) was found, and the distance effect was not signi fi-cantly larger than zero in any of the individual subregions. Thus, in our present study, the discriminability of activations patterns evoked by individual numbers was modulated by numerical distance beyond the small number range, and it was stronger in the feLIP than the feVIP ROI.
Monkey neurophysiology has shown that the responses of individual neurons decrease with distance from their preferred number. Can similar effects be observed for individual voxels? At the present spatial resolution, individual voxels do not show strong number selectivity. For instance, very few voxels showed a main effect of number in first level SPM models (average numbers of significant voxels across subjects were 15, 23, 15, and 11 for left feLIP, right feLIP, left feVIP, and right feVIP, respectively, at a threshold of P < 0.05, uncorrected). Nevertheless, we attempted an analysis of numerical distance effects at the level of individual voxels using a similar approach as the one used in previous neurophysiological work (see Materials and Methods for details). This examined responses to nonpreferred numbers with a distance of either 1 or 2 steps from the preferred number and further restricted the data within each region and subject to the 50 voxels with the highestF-values for the main effect of number. The average responses as a function of distance from the preferred number can be seen in Figure4B. An ANOVA with the factors region,
hemisphere, and distance level (distance 1 vs. 2) showed a significant interaction of region and distance level (F1,13= 7.76, P < 0.05), in addition to a trend for an interaction of hemisphere and distance level (F1,13= 4.56,P < 0.1). While feLIP showed a 5.5% decrease in response from distance 1 to distance 2, feVIP, on the other hand, showed a slight increase of 1.3% (the percen-tages being relative to the fMRI response to the preferred number). The left hemisphere showed on average an increase of 0.4%, and the right hemisphere a decrease of 4.6%. However, when testing each of the 4 regions individually for an effect of distance, effects remained nonsignificant (all F < 2.4). In summary, this analysis confirmed the difference in distance effects observed by classification between feLIP and feVIP when considering responses of individual voxels, and suggests that feLIP represents numerosity less precisely than feVIP, with an additional trend for a more precise representation in the left than the right hemisphere.
Discussion
The present work demonstrates that 2 different neurophysiolo-gically motivated and functionally defined subregions of human parietal cortex, feLIP and feVIP, represent individual numbers by their pattern of activation across voxels. Further-more, the coding of number in these parietal regions is par-tially location-invariant, but the 2 subregions studied differ in the precision of their numerical code.
In macaque monkeys, numerosity-responsive neurons have been observed by 2 independent groups in the lateral and ventral intraparietal areas (Nieder et al. 2006;Roitman et al. 2007). The exact correspondence of these regions with intra-parietal areas in humans remains a matter of ongoing research, although functional imaging and in particular studies using phase-encoded mapping of either saccadic eye movements or visual and tactile stimulation of the face have proposed some candidate human homolog areas (Sereno and Huang 2006;
Sereno et al. 2001). An increasing number of suchfield maps defined either by direct visual stimulation, attention or saccadic eye movements, are being discovered in human parietal cortex (Silver et al. 2005; Swisher et al. 2007; Konen and Kastner 2008a), and while substantial evidence suggests that more anteriorfield maps may be functionally equivalent the monkey VIP and more posterior ones to monkey LIP (see, e.g.,Silver and Kastner 2009), there is no one-to-one correspondence (the LIP and /or VIP homolog may include more than onefield map or some new areas without a clear counterpart in the monkey may have developed in humans). In this context, it is also of in-terest that the human IPS appears to be differentially expanded compared with the monkey IPS, in the sense that some areas located on the lower bank in macaques (as for example LIP) may have moved to the upper bank in humans (see, e.g.,
Grefkes and Fink 2005). For example, using an identical eye movement task in monkeys and humans to test for areas func-tionally equivalent with LIP, activations were located predomi-nantly on the lower bank of the IPS in monkeys, and on the upper bank in humans (Koyama et al. 2004). This hypothesis of differential expansion of the IPS was recently strengthened by the fact thatfield mapping in monkeys revealed 3 maps ap-pearing equivalent to thefirst 3 intraparietal maps in humans (Arcaro et al. 2011), which are located on the lower bank in monkeys, while, in humans, they are located predominantly on the upper bank (see, e.g.,Wandell et al. 2007).
Although some previous studies of number processing have proposed that activations to nonsymbolic numbers in the superior parietal lobule are likely to arise from regions hom-ologous to LIP (Holloway et al. 2009;Santens et al. 2010), our study is thefirst one to use localizers motivated by neurophy-siology to define human functional equivalents of LIP and VIP. The approach used here and in previous work (Hubbard et al. 2008, Hubbard et al. unpublished observations), is based on the identification of voxels responsive to contrasts for visually guided saccades versusfixation (feLIP), and a combination of visual motion stimulation and tactile stimulation of the face (feVIP). This approach is simpler and less costly than thefield mapping techniques reviewed above. For feLIP, our average coordinates are very close to those reported byKoyama et al. (2004), and slightly (∼1 cm) anterior to the ones reported by
Sereno et al. (2001). The average coordinates of our feVIP ROI show a particularly close correspondence with those reported bySereno and Huang (2006), which was thefirst study to have
Figure 4. (A) Illustration of pairwise classification accuracies for numbers (chance performance is corresponding to 50%) as a function of numerical distance, suggesting a stronger dependence of classification on numerical distance in area feLIP than feVIP. Means across 14 subjects ± SEM are displayed. Numbers either differed in 1 step (1: 8 vs. 13, 13 vs. 21, 21 vs. 34), 2 steps (2: 8 vs. 21, 13 vs. 34), or 3 steps (3: 8 vs. 34). An ANOVA on parameter estimates from a multiple regression revealed a significant difference between regions for the estimates of the distance effect (ratio between numbers). (B) Response profiles of individual voxels averaged as a function of numerical distance from the preferred number. Means across 14 subjects ± SEM are plotted. Note that the pronounced difference between preferred and nonpreferred numbers in the plots can be explained by a selection bias (averages were calculated as a function of preferred number), but this is not the case for differences between different nonpreferred numbers. An on average slightly higher response to the second than the third preferred number is visible mostly in LIP and the right hemisphere. An ANOVA on the data for second and third preferred numbers revealed a significant interaction of region and distance level, as well as a trend for an interaction of hemisphere and distance level.
demonstrated aligned head-centered visual and tactile maps in that area, thus establishing a very close correspondence with the neurophysiological characteristics of VIP. Our coordinates further appear very close but slightly superior to those re-ported for IPS5 byKonen and Kastner (2008a), and somewhat superior and medial by∼1 cm to the ones given byBremmer et al. (2001).
Using multivoxel pattern classification, we found that acti-vation patterns of the feLIP and feVIP ROIs both contain infor-mation about which, of 4 different numerosities, the participant had been seeing and holding in working memory. The classification performance obtained here is lower than in our previous study (Eger et al. 2009), which might be related to one or more of several factors: The larger numerosities used (our previous studies obtained the best decoding for small numbers within or close to the subitizing range), the smaller distance between numbers (ratio of 1.6 instead of 2 used pre-viously), the presentation of stimuli in the periphery of the visual field, and the smaller regions of interest. As only a limited number of neurons show tuning to number in the macaque monkey (<20% in the fundus of the IPS which is the parietal region with the highest concentration) (Nieder and Miller 2004), it seems rather unsurprising that fMRI decoding of individual numbers at a resolution of 2 mm isotropic as used here would have only modest accuracy, if it is indeed based on activity of the corresponding neuronal populations.
In spite of this low overall decoding performance, number discrimination trained on fMRI data evoked by stimuli pre-sented in a given hemifield generalized to test data from the other hemifield, at above-chance levels in feLIP (and showing a trend in feVIP). These 2 regions did not differ significantly in their decoding accuracy, nor did decoding accuracy interact with testing on data from the same versus different hemifields. Thus, our data suggest that the representation of numerosity in these parietal areas is at least partially, position invariant. Much work has explored invariance in the ventral visual stream and in relation to shape and object processing (e.g.,
Grill-Spector et al. 1999;Hung et al. 2005;Schwarzlose et al. 2008;Kravitz et al. 2010). Relatedfindings lend support to the idea that tolerance of the population response to location change increases along the cortical hierarchy, while at the same time not completely discarding position information (DiCarlo and Cox 2007). Comparable work in the dorsal stream is lacking: Although generalization of object adaptation across changes in size and viewpoint has been explored to some extent (Konen and Kastner 2008b), to our knowledge the present data are thefirst to demonstrate spatial invariance in human parietal cortex.
As far as numbers are concerned, our data do not support the idea that feLIP would contain a more spatially selective number code than feVIP. Interestingly, we found that discrimi-nation accuracy for position itself (irrespective of number) showed a tendency to decrease from feLIP to feVIP. This finding fits with the distinct receptive field sizes in equivalent regions of the macaque brain (Ben Hamed et al. 2001;
Bremmer et al. 2002). However, this was not accompanied by a similar increase of position-invariant numerical information. We cannot completely rule out that a lack of overall sensitivity underpins the absence of a region-by-condition interaction for number discrimination. Nonetheless, our result seems plaus-ible given that monkey LIP neurons have been shown to selec-tively respond even to stimuli outside of their receptivefield,
in the context of nonspatial stimuli and tasks as for example categorization (Freedman and Assad 2009).
Our study further allowed us to compare number infor-mation in parietal cortex ( pooled across feLIP and feVIP) with that in early visual cortex. In early visual cortex, number dis-crimination was found for stimuli presented in the contralateral hemifield when training and testing the classifier on data from the same location, consistent with the known receptive field properties in early visual cortex. A previous study had suggested a position-coding stage for numerosity in early visual cortex (Roggeman et al. 2011). However, unlike in this earlier work, here the positions of individual dots in our stimuli were randomly drawn on each trial. The fact that dis-crimination remained possible could suggest that the classi fi-cation algorithm uses information in the signal that may be related to some higher order property of the dot patterns such as spatial frequency or density. Indeed, these factors have been suggested by some authors to be crucial for the representation of numerosity (Dakin et al. 2011). Alternatively, number dis-crimination in early visual cortex could arise as a result of feed-back (Williams et al. 2008) from higher order areas such as parietal cortex. Regardless of which interpretation is correct, the crucial finding is that decoding of number in parietal cortex differed from that in early visual cortex, as it was overall more accurate, and did no longer show signs of position specificity.
Although we did not observe a difference between our 2 par-ietal subregions in the amount of decodable number infor-mation and its position invariance, we didfind such a difference in the expression of the effect of numerical distance. While in feLIP the discrimination of a given number pair improved as the distance (ratio) of the 2 numbers increased, this was not the case in VIP. We thus replicated a distance effect, which was only observed for small numbers of dots in our previous study. We now show that this effect holds with larger numbers, and that it is preferentially supported by the feLIP subregion. The fact that numerical distance has a stronger effect in feLIP than feVIP could have 2 potential origins: First, for tuned neurons distance effects should arise from the sharpness of the neurons’ tuning curves (and saturate when these do no longer overlap), thus, ourfindings could imply that while tuning to number may exist in both areas, neurons in feLIP are more coarsely tuned than neurons in feVIP. Alternatively, monkey neurophysiological studies suggested that LIP neurons exhibit monotonically in-creasing or dein-creasing responses to number (Roitman et al. 2007). Such a summation code also leads to numerical distance effects (Stoianov and Zorzi 2012) and, under some conditions, this effect can be stronger than for tuned cells: For Gaussian tuned cells, the differences infiring rates should become vanish-ingly small as soon as numerical distance exceeds twice the stan-dard deviation of the tuning curves (also called the neuron’s Weber fraction). On the other hand, monotonic cells would seem less likely to saturate with greater separation between the compared numbers.
A previous related fMRI study (not using multivariate pattern recognition) has described a parametric increase in fMRI response with numerosity within the range of small num-bers of dots in posterior superior parietal cortex, and has sug-gested that this could be a potential correlate of summation coding (Santens et al. 2010). For larger numbers of dots (above 8), the same group has shown that responses do no longer in-crease with number (Roggeman et al. 2010). This is replicated
by ourfindings, which in addition show that number is never-theless decodable, meaning that number representation is to some extent orthogonal to the region’s overall activation. Given the fact that approximately half of the neurons stud-ied in monkeys (Roitman et al. 2007) show increases and the other half decreases, it is not necessarily clear that the average fMRI signal resulting from summation coding should be af-fected in the direction of a homogeneous increase. Pattern rec-ognition methods do not allow us to directly disambiguate the underlying neuronal coding scheme, and the responses of indi-vidual voxels in our study did not have sufficiently reliable signals to decide between tuned versus monotonic responses. In the future, imaging at higher field, with better signal-to-noise and spatial precision, may provide the possibility to test the coding scheme for number directly at the level of individ-ual voxels.
In summary, our study is thefirst one to test for discrimi-nation of individual numbers in neurophysiologically motiv-ated subregions of human parietal cortex. Wefind that both the functional equivalents of areas LIP and VIP contribute to the representation of numerosity, thus extending to human the findings obtained by 2 different groups in corresponding regions of the macaque brain. Our study, furthermore, is the first to report some degree of location invariance of the rep-resentation of number. This result suggests that just as position information is not absent from higher level areas in the ventral visual pathway (e.g.,Hung et al. 2005;Schwarzlose et al. 2008;
Kravitz et al. 2010), some degree of position tolerance can be found in the dorsal pathway. It remains to be seen how far the position tolerance obtained with number here will be repli-cated with other classes of stimuli and in other task contexts. Further work will also be needed to understand which types of decodable information in the 2 visual pathways reflect behav-iorally relevant representations.
Funding
This work was supported by Institut National de la Santé et de la Recherche Medicale et Agence Nationale de la Recherche. A.K. is funded by the Jeantet Foundation.
Notes
We thank Oana Tudusciuc for sharing the Matlab code used for cre-ation of the opticflow stimuli, Gael Varoquaux for help in the analysis with Scikit-learn, and the NeuroSpin platform staff for their assistance in scanning volunteers.Conflict of Interest: None declared.
References
Ansari D. 2008. Effects of development and enculturation on number representation in the human brain. Nat Rev Neurosci. 9:278–291. Arcaro MJ, Pinsk MA, Li X, Kastner S. 2011. Visuotopic organization of
macaque posterior parietal cortex: a functional magnetic resonance imaging study. J Neurosci. 31:2064–2078.
Avillac M, Deneve S, Olivier E, Pouget A, Duhamel J-R. 2005. Reference frames for representing visual and tactile locations in parietal cortex. Nat Neurosci. 8:941–949.
Ben Hamed S, Duhamel JR, Bremmer F, Graf W. 2001. Representation of the visual field in the lateral intraparietal area of macaque monkeys: a quantitative receptivefield analysis. Exp Brain Res. 140:127–144.
Bremmer F, Duhamel J-R, Ben Hamed S, Graf W. 2002. Heading encod-ing in the macaque ventral intraparietal area (VIP). Eur J Neurosci. 16:1554–1568.
Bremmer F, Schlack A, Shah NJ, Zafiris O, Kubischik M, Hoffmann K, Zilles K, Fink GR. 2001. Polymodal motion processing in posterior parietal and premotor cortex: a human fMRI study strongly implies equivalencies between humans and monkeys. Neuron. 29:287–296. Burr D, Ross J. 2008. A visual sense of number. Curr Biol. 18:425–428. Cantlon JF, Brannon EM. 2006. Shared system for ordering small and
large numbers in monkeys and humans. Psychol Sci. 17:401–406. Cantlon JF, Platt ML, Brannon EM. 2009. Beyond the number domain.
Trends Cogn Sci. 13:83–91.
Castelli F, Glaser DE, Butterworth B. 2006. Discrete and analogue quantity processing in the parietal lobe: a functional MRI study. Proc Natl Acad Sci USA. 103:4693–4698.
Christianini N, Shawe-Taylor J. 2000. An introduction to support vector machines and other kernel-based learning methods. Cambridge: Cambridge University Press.
Cipolotti L, Butterworth B, Denes G. 1991. A specific deficit for numbers in a case of dense acalculia. Brain. 114:2619–2637. Dakin SC, Tibber MS, Greenwood JA, Kingdom FAA, Morgan MJ. 2011.
A common visual metric for approximate number and density. Proc Natl Acad Sci USA. 108:19552–19557.
Dehaene S. 1997. The number sense. New York: Oxford University Press. Dehaene S, Changeux P. 1993. Development of elementary numerical
abilities: a neuronal model. J Cogn Neurosci. 5:390–407.
DiCarlo JJ, Cox DD. 2007. Untangling invariant object recognition. Trends Cogn Sci. 11:333–341.
Eger E, Michel V, Thirion B, Amadon A, Dehaene S, Kleinschmidt A. 2009. Deciphering cortical number coding from human brain activity patterns. Curr Biol. 19:1608–1615.
Feigenson L, Dehaene S, Spelke S. 2004. Core systems of number. Trends Cogn Sci. 8:307–314.
Freedman DJ, Assad JA. 2009. Distinct encoding of spatial and nonspa-tial visual information in parietal cortex. J Neurosci. 29:5671–5680. Grefkes C, Fink GR. 2005. The functional organization of the
intrapar-ietal sulcus in humans and monkeys. J Anat. 207:3–17.
Grill-Spector K, Kushnir T, Edelman S, Avidan G, Itzchak Y, Malach R. 1999. Differential processing of objects under various viewing con-ditions in the human lateral occipital complex. Neuron. 24:187–203. Halberda J, Mazzocco M, Feigenson L. 2008. Individual differences in
non-verbal number acuity correlate with maths achievement. Nature. 455:665–668.
Haynes J-D, Rees G. 2006. Decoding mental states from brain activity in humans. Nat Rev Neurosci. 7:523–534.
Holloway ID, Price GR, Ansari D. 2009. Common and segregated neural pathways for the processing of symbolic and nonsymbolic numerical magnitude: an fMRI study. Neuroimage. 49:1006–1017. Hubbard EM, Diester I, Cantlon JF, Ansari D, Opstal Fv, Troiani V.
2008. The evolution of numerical cognition: from number neurons to linguistic quantifiers. J Neurosci. 28:11819–11824.
Hung CP, Kreiman G, Poggio T, DiCarlo JJ. 2005. Fast readout of object identity from macaque inferior temporal cortex. Science. 310:863–866. Konen CS, Kastner S. 2008a. Representation of eye movements and
stimulus motion in topographically organized areas of human pos-terior parietal cortex. J Neurosci. 28:8361–8375.
Konen CS, Kastner S. 2008b. Two hierarchically organized neural systems for object information in human visual cortex. Nat Neuro-sci. 11:224–231.
Koyama M, Hasegawa I, Osada T, Adachi Y, Nakahara K, Miyashita Y. 2004. Functional magnetic resonance imaging of macaque monkeys performing visually guided saccade tasks: comparison of cortical eyefields with humans. Neuron. 41:795–807.
Kravitz DJ, Kriegeskorte N, Baker CI. 2010. High-level visual object rep-resentations are constrained by position. Cereb Cortex. 20:2916–2925. Kriegeskorte N, Goebel R, Bandettini P. 2006. Information-based
func-tional brain mapping. Proc Natl Acad Sci USA. 103:3863–3868. Moyer RS, Landauer TK. 1967. Time required for judgements of
numerical inequality. Nature. 215:1519–1520.
Nieder A, Diester I, Tudusciuc O. 2006. Temporal and spatial enumer-ation processes in the primate parietal cortex. Science. 313:1431–1435.
Nieder A, Miller EK. 2004. A parieto-frontal network for visual numerical information in the monkey. Proc Natl Acad Sci USA. 101:7457–7462. Norman KA, Polyn SM, Detre GJ, Haxby JV. 2006. Beyond mind
reading: multi-voxel pattern analysis of fMRI data. Trends Cogn Sci. 10:424–430.
Pedregosa F, Varoquaux G, Michel V, Thirion B, Grisel O, Blondel M, Pre-ttenhofer P, Weiss R, Dubourg V, Vanderplas J et al. 2011. Scikit-learn: machine learning in Python. J Mach Learn Res. 12:2825–2830. Piazza M, Izard V, Pinel P, Le Bihan D, Dehaene S. 2004. Tuning curves
for approximate numerosity in the human intraparietal sulcus. Neuron. 44:547–555.
Pinel P, Dehaene S, Rivière D, Le Bihan D. 2001. Modulation of parietal activation by semantic distance in a number comparison task. Neu-roimage. 14:1013–1026.
Roggeman C, Fias W, Verguts T. 2010. Salience maps in parietal cortex: imaging and computational modeling. Neuroimage. 52:1005–1014. Roggeman C, Santens S, Fias W, Verguts T. 2011. Stages of nonsym-bolic number processing in occipitoparietal cortex disentangled by fMRI adaptation. J Neurosci. 31:7168–7173.
Roitman JD, Brannon EM, Platt ML. 2007. Monotonic coding of numerosity in macaque lateral intraparietal area. PLOS Biol. 5:1672–1682.
Santens S, Roggeman C, Fias W, Verguts T. 2010. Number processing pathways in human parietal cortex. Cereb Cortex. 20:77–88. Schwarzlose RF, Swisher JD, Dang S, Kanwisher N. 2008. The
distribution of category and location information across object-selective regions in human visual cortex. Proc Natl Acad Sci USA. 105:4447–4452.
Sereno MI, Huang RS. 2006. A human parietal face area contains aligned head-centered visual and tactile maps. Nat Neurosci. 9:1337–1343.
Sereno MI, Pitzalis S, Martinez A. 2001. Mapping of contralateral space in retinotopic coordinates by a parietal cortical area in humans. Science. 294:1350–1354.
Silver MA, Kastner S. 2009. Topographic maps in human frontal and parietal cortex. Trends Cogn Sci. 13:488–495.
Silver MA, Ress D, Heeger DJ. 2005. Topographic maps of visual spatial attention in human parietal cortex. J Neurophysiol. 94:1358–1371.
Stoianov I, Zorzi M. 2012. Emergence of a‘visual number sense’ in hierarchical generative models. Nat Neurosci. 15:194–196. Swisher JD, Halko MA, Merabet LB, McMains SA, Somers DC. 2007.
Visual topography of human intraparietal sulcus. J Neurosci. 27:5326–5337.
Van Opstal F, Gevers W, De Moor W, Verguts T. 2008. Dissecting the sym-bolic distance effect: comparison and priming effects in numerical and nonnumerical orders. Psychonom Bull Rev. 15:419–425. Vapnik V. 1995. The nature of statistical learning theory. Berlin:
Springer .
Verguts T, Fias W. 2004. Representation of number in animals and humans: a neural model. J Cogn Neurosci. 16:1493–1504.
Wandell BA, Dumoulin SO, Brewer AA. 2007. Visualfield maps in human cortex. Neuron. 56:366–383.
Williams MA, Baker CI, Op de Beeck HP, Shim WM, Dang S, Triantafyl-lou C, Kanwisher N. 2008. Feedback of visual object information to foveal retinotopic cortex. Nat Neurosci. 11:1439–1445.