GJI
Geomagnetism,
ro
ck
magnetism
and
palaeomagnetism
EPR evidence for maghemitization of magnetite in a tropical soil
H. Fischer,
1J. Luster
2and A. U. Gehring
11Institute of Geophysics, ETH Zurich, 8093 Z¨urich, Switzerland. E-mail: [email protected] 2Swiss Federal Institute for Forest, Snow and Landscape Research WSL, CH-8903 Birmensdorf, Switzerland
Accepted 2006 November 21. Received 2006 November 8; in original form 2006 May 30
S U M M A R Y
Electron paramagnetic spectroscopy (EPR) was used in combination with standard rock mag-netic methods to study magmag-netic minerals in a tropical soil. The susceptibility and hysteresis measurements showed magnetite grains with a Curie temperature near 850 K as the domi-nant magnetic remanence carriers in the soil. A minor Ti content in the magnetite was found by energy dispersive X-ray analysis. In order to get insight into the weathering status of the magnetite, different chemical treatments, including oxalate and citrate–bicarbonate–dithionite (CBD) extraction, were applied to the soil samples. The hysteretic properties exhibited no sig-nificant differences between the untreated and the CBD or oxalate treated samples. By contrast, the comparison of the EPR spectra revealed a significant broadening of the linewidth (δB) and a shift of the g-values (geff) to lower fields after the CBD treatment. Furthermore, the spectral parameters geffandδB exhibited an angular dependence. At low temperature, the CBD treated samples showed a jump inδB between 120 and 100 K, the temperature range characteristic for the Verwey transition in magnetite. The changes in the spectral properties after the CBD treatment, which dissolves ferric oxides, were attributed to the removal of maghemite formed by the oxidation of magnetite, that is, during the maghemitization of the magnetite grains. Key words: EPR spectroscopy, FMR, magnetite, maghemitization, weathering.
1 I N T R O D U C T I O N
Lithogenic magnetite is widespread in soils and often dominates their magnetic properties. During weathering, magnetite becomes oxidized, whereas under reducing conditions, as in waterlogged soils, it can undergo reductive dissolution (e.g. Henshaw & Merrill 1980). The identification of such processes is important to deduce pedogenesis. Oxidation of magnetite can lead to the formation of maghemite or less crystallized ferric phases. Using XRD and mi-croscopic analysis, Gallagher et al. (1968) could show on a well defined synthetic magnetite sample a topotactical conversion into maghemite. The conversion is known as maghemitization, and has been described also in natural systems such as pelagic sediments (Smirnov & Tarduno 2000) and loess (Chen et al. 2005). In the first study, maghemite was detected by thermal demagnetization, while in the second one it was observed under the transmission electron mi-croscope. Under reducing conditions, magnetite is slowly dissolved. The rate is grain size dependant and is generally much slower than for ferric oxides.
The aforementioned redox processes are surface controlled (Stumm & Morgan 1996). The detection of the surface products with rock magnetic methods is difficult, because the magnetic signals are generally dominated by the bulk properties. Furthermore, magnetite and its oxidation product maghemite have similar magnetic proper-ties (Dunlop & ¨Ozdemir 1997). In the rock magnetic literature, there are several experimental approaches to detect maghemitization. Van
Velzen & Dekkers (1999) proposed that heating to 150◦C could be used to distinguish between maghemite and partially oxidized magnetite because such a treatment would selectively change the magnetic coercivity of the latter. Low temperature magnetic exper-iments offer another approach, in which the oxidation of magnetite is detected via the suppression of the so-called Verwey transition ( ¨Ozdemir et al. 1993). This transition, however, is also suppressed in magnetite with Ti substitution (Kakol et al. 1992); therefore, am-biguity can remain when using such an approach.
Electron paramagnetic resonance (EPR) spectroscopy is a pow-erful tool for studying paramagnetic cations such as Fe(III)in diluted
systems (e.g. Meads & Malden 1975; Angel & Vincent 1978). A detailed description of the technique is given by Wertz & Bolton (1972). The method, however, has rarely been used to study phases carrying a remanent magnetization. In such systems, strong dipole– dipole interactions or magnetic coupling can lead to intense and broad signals at room temperature (RT) that cannot be assigned un-ambiguously to a specific magnetic phase (Griscom 1980; Gehring & Karthein 1990). Such broad signals are produced by ferromag-netic resonance (FMR). The basic principles of this phenomenon were described by several authors (Kittel 1948; Bickford 1950). Experimental studies on magnetite revealed that apart from the dif-ferent anisotropies (e.g. magnetocrystalline) the skin effect can in-fluence the FMR (Kittel 1946). Such an effect is produced in elec-trical conductors where eddy currents limit the penetration depth of the electromagnetic radiation. For magnetite at RT, this depth is
in theµm range, and, therefore, is expected for multidomain (MD) and larger pseudo-single domain (PSD) particles. By contrast, in single-domain (SD) particles, the electromagnetic radiation is uni-form across the whole grain. Hence, for MD and larger PSD grains, the surface and the near-surface region contribute more strongly to FMR spectra.
With this in mind, it is conceivable that FMR properties of larger magnetite grains can be influenced by surface modifications caused by oxidation. In order to test this hypothesis, we applied EPR spec-troscopy in concert with rock magnetic methods to lithogenic mag-netite in a tropical soil which was subjected to different chemical treatments to selectively remove certain minerals or surface layers formed during weathering.
2 M E T H O D O L O G Y 2.1 Sample preparation
The soil samples were collected from the top layer of an alluvial Vertisol in the Savanna woodland of southern Mali near the ham-let Kabogora (Gehring et al. 1997). The lithogenic magnetite is dispersed in the soil matrix which mainly consists of quartz and montmorillonite. For the chemical and magnetic analyses, the sam-ples were dried at 60◦C and passed through a 2-mm sieve in order to remove larger grains and components such as plant residues.
Three different chemical extraction procedures were performed on the untreated sample (KA). Oxalate treatment following the recipe by Schwertmann (1964) was used to remove amorphous and poorly crystallized ferric oxides from the soil samples. The citrate–bicarbonate–dithionite (CBD) extraction was performed us-ing a protocol modified from Mehra & Jackson (1960). Briefly, 2 g of sieved soil, 2 g of sodium dithionite, 10 ml of 1 M sodium hydro-gen carbonate, and 150 ml 0.3 M sodium citrate were equilibrated at RT for 24 h in dark bottles using an end-over-end shaker. The liquid phase was removed by filtration and the residue washed sev-eral times with doubly deionized water. The acid treatment involved boiling the sample in a concentrated acid solution with a 19:1 ratio of HCl to H2SO4followed by magnetic separation (Goulart et al.
1994). The treated samples are referred to as KA ox, KA dith and KA acid, respectively.
2.2 Experimental methods
The morphology of magnetic separates was investigated under the scanning electron microscope (SEM), which for semi-quantitative chemical analyses was connected to an energy dispersive system (EDX). The magnetic susceptibilities (χ) of the untreated and chem-ically treated specimens were determined on an AGICO KLY-2 Kap-pabridge. In order to determine inhomogeneity effects, the suscepti-bility was measured on ten specimens. For sample KA, the temper-ature dependence ofχ between RT and 973 K was recorded with a heating rate of approximately 11◦C min−1. The hysteretic properties of all samples were analysed at RT by magnetization versus applied field experiments using a Vibrating Sample Magnetometer (VSM) from Princeton Corporation. Coercivity force (Bc), remanent
mag-netization (Mr) and saturation magnetization (Ms) were determined
from the hysteresis loops, after they were corrected for paramag-netic contribution with a factor of 0.7. In addition, first-order rever-sal curves (FORC) were measured with the same instrument, and the data were analysed with a Matlab code by Winkelhofer (personal communication 2006).
The EPR spectra of the untreated and chemically treated samples (about 300 mg) were obtained at RT on a Bruker EMX 300 spectrom-eter. The X-band spectra were recorded at a microwave frequency of 9.77 GHz with a power of 0.2 mW, a modulation frequency of 100 kHz, and an amplitude modulation of 0.1 mT. The field strength was controlled by a Bruker NMR Gaussmeter ER 035M. In order to avoid movement of the magnetic particles due to alignment with the external field, the bulk sample in the glass tube was moulded in paraffin. The angular dependence of the FMR spectra was deter-mined by rotating the glass tube in the EPR cavity with the help of a goniometer installed at the top of the cavity. The axis of rotation was perpendicular to the applied magnetic field. For each sample, the an-gular dependence was measured four times. The low temperature measurements were carried out on a Bruker Elesys spectrometer at a frequency of 9.5 GHz in a temperature range between 10 and 150 K. Prior to inserting the tubes into the spectrometer cavity, they were cooled in liquid nitrogen. The experimental parameters were the same as for the RT measurements.
2.3 FMR
Since FMR experiments have not often been used in geophysical research, the basics are summarized in the following paragraph. A detailed description can be found elsewhere (Kittel 1948; Vonsovskii 1966). In the presence of a magnetic field, the magnetic moments precess around the field direction with a frequency of ˙ω. The fre-quency increases with the field, according to Larmor’s law:
˙
ω = γ B (1)
withγ being the gyromagnetic ratio, and B the applied field. Absorp-tion occurs when this frequency is equal to the one of the microwave radiation (ν). The resulting resonance condition can be written as
hν = gµBB (2)
assuming no anisotropy fields (h is Planck’s constant, g the splitting factor,µBBohr’s magneton). Since anisotropies in FM phases create
internal fields which add to the external one, the effective field (Beff)
is the sum of applied field and internal fields. The g-value calculated from eq. (2) will, therefore, be modified to geff. Eq. (2) becomes then
hν = geffµBBeff (3)
Griscom (1980) describes four major anisotropy energies which can influence Beff. The magnetocrystalline anisotropy results from
the crystallographic structure, whereas the shape anisotropy is caused by the interaction of the magnetization vector with the de-magnetizing field of the grain. For magnetite, shape anisotropy is dominant in small (<20 µm) non-spherical particles, whereas for larger particles, magnetocrystalline anisotropy is prevailing (Dunlop & Ozdemir 1997). Furthermore, domain structure¨ anisotropy considers the relative orientation of the microwave field to the domain walls. Finally, exchange anisotropy arises from the interaction between magnetic particles.
For large magnetite grains at RT, the microwave radiation pene-trates generally to a certain depth only, because of its relatively high electrical conductivity. The depth at which the intensity of the mi-crowave radiation is reduced by 37 per cent is denominated the skin depth. The skin depth is frequency-dependent and it is about 5µm for pure magnetite at the X -band frequency (Griscom 1974). Crys-tal defects or cation substitutions (e.g. TiIVfor FeIII) often found in
conductivity, and, therefore, increase the skin depth. Hence, spec-troscopic information stems from both near-surface regions and the bulk of the larger magnetite grains.
The absorption spectra are generally presented as their first derivative. For the description of the FMR spectra of magnetite, two empirical parameters have been put forward: geff value
(g-value at zero-crossing), and the peak to peak linewidthδB. For non-interacting SD grains, these parameters can be used to char-acterize the anisotropy field. For systems with MD and PSD parti-cles, however, these parameters can only be understood in a general sense.
3 R E S U L T S
3.1 Magnetic and microscopic properties
The mean susceptibility of KA was 69× 10−8m3kg−1with a
stan-dard deviation (σ ) of 4 × 10⁻⁸ m3 kg−1. A meanχ of 77 (σ =
6)× 10−8 m3 kg−1was found for KA ox, while that of KA dith
was 54 (σ = 2) × 10−8 m3 kg−1. Upon heating KA to 973 K,
χ remained relatively constant up to 510 K followed by a bump at
575 K and a decrease up to 775 K. A more pronounced decay was found between 793 and 850 K (Fig. 1). At higher temperatureχ did not significantly change any more. Upon reversed cooling,χ increased drastically down to about 520 K followed by a slight de-crease. The end value at RT was three times higher than the starting value.
The magnetization versus applied field plot (Fig. 2) revealed an open hysteresis loop for KA, KA ox and KA dith. By contrast, no significant hysteretic properties were found for KA acid (Fig. 2). The coercivity field (Bc) was 10 mT for KA and KA dith, and 9 mT
for KA ox. The hysteresis loops for KA, KA ox and KA dith closed between 250 and 300 mT. The ratio of the remanent magnetization (Mr) to the saturation magnetization (Ms) was 0.15 for KA, 0.18
for KA ox, and 0.17 for KA dith.
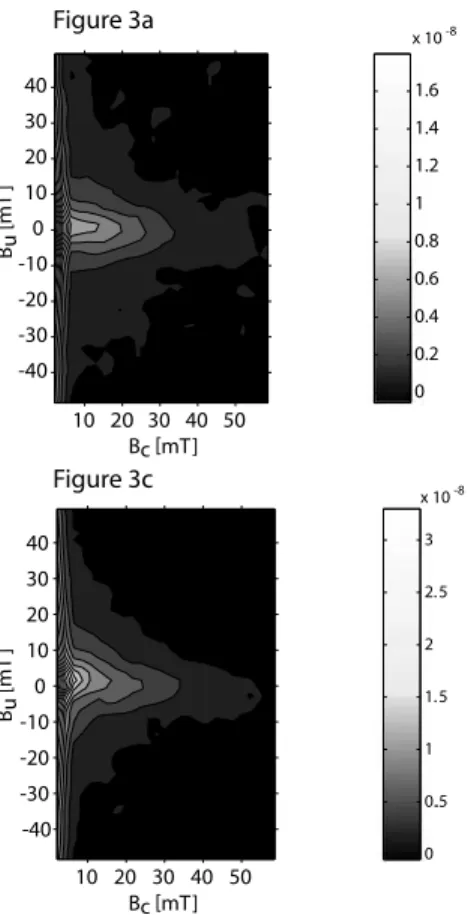
The FORC diagram of KA revealed two features. The distribution along the Bcaxis extended up to 50 mT with weakly diverging open
contours (Fig. 3a); a maximum was observed at Bc≈ 10 mT. The
second feature consisted of a distribution along the Buaxis for values
of Bc< 5 mT. Chemical treatment did not significantly change the
diagrams and both KA ox and KA dith displayed the same features as KA (Figs 3b and c).
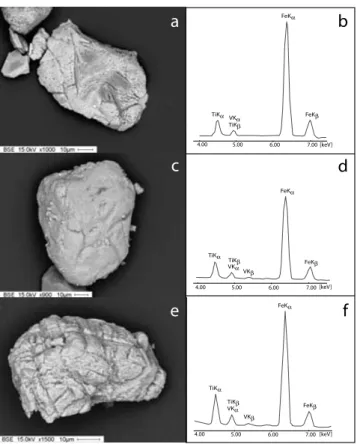
Under the SEM, the magnetite grains were generally larger than 20µm and exhibited variable morphologies. No significant change in the morphology was observed after chemical treatment (Fig. 4).
0 40 80 120 160 200 373 473 573 673 773 873 973 Temperature [K] 850 K χ [a.u]
Figure 1. Changes inχ upon heating and subsequent cooling of sample
KA. -2 2 4 M [memu] -400 -200 200 400 B [mT] KA_acid KA -4
Figure 2. Magnetization versus applied field plot of KA and KA acid.
Semi-quantitative EDX analysis revealed varying substitution by minor amounts of cations, mainly Ti. A few magnetite grains con-tained an amount of substitution which was below the detection limit of the EDX analyses.
3.2 EPR measurements
The EPR spectra of the untreated, oxalate and the CBD treated sam-ples recorded at RT were dominated by a broad signal (Fig. 5). This signal was missing in the KA acid sample. All samples exhibited two additional signals, one at low field with g= 4.3 and the other at high field with g= 2. The resonance at low field could be assigned to Fe(III)in distorted octahedral coordination sites, whereas the sharp
signal at g= 2 is characteristic for a free radical (e.g. Meads & Malden 1975). For the KA, the KA ox and the KA dith samples the broad signal was different with respect to its spectroscopic param-eters, geffandδB. The untreated sample revealed a geffof 2.119. A
shift to higher value, that is, to lower applied field, was observed in chemically treated samples. For KA ox, geff = 2.145 and for
KA dith, geff= 2.29 were determined. For KA and KA ox, δB was
similar with values of 122 and 119 mT, respectively. In contrast, a higherδB of 161 mT was found for KA dith. Replicate measure-ments with removal of the samples from the spectrometer cavity between the runs led to slight changes in the FMR parameters. The variation was most pronounced in KA dith.
A similar effect was found when rotating the sample in the cavity. Fig. 6 shows the measured geffversus rotation angle for one replicate
run of each sample. The replicates for each sample differed slightly, but the relative differences between the samples were the same in all cases. The geff-values revealed for all the three samples an angular
dependence with no overlapping values between the samples. Sam-ple KA dith exhibited the most pronounced angular dependence. In this sample, geffwas characterized by a mean value of 2.27 and
σ = 0.05. A periodicity of 180◦was found (Fig. 6). In the two other
samples, the angular dependence was weak. For KA ox the mean value for geffwas 2.142 withσ = 0.004, whereas in KA, the mean
value for geffwas 2.119 withσ = 0.008. Furthermore, an angular
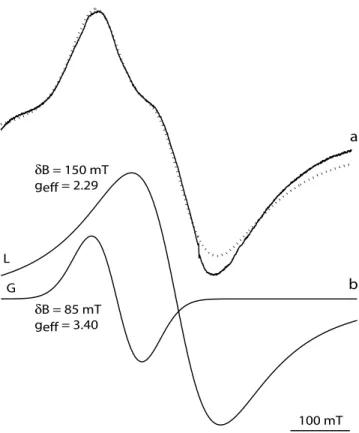
dependence was also found forδB (Fig. 7). In KA the mean δB was 122 mT withσ of 4.6 mT, while in KA ox, δB was 121 mT with σ of 2.2 mT. For KA dithδB had a mean value of 164 mT with σ of 20 mT. Upon rotation theδB was characterized by broad maxima and minima and the occurrence of a shoulder as additional feature in the EPR spectra, indicating a superimposed signal (Fig. 7b). This fea-ture appeared simultaneously with the increase of the linewidth and was most pronounced where theδB reached its maximum (Fig. 7). The KA spectra could be reasonably fitted with a single Lorentzian line, whereas the best fitting for chemically treated sam-ples was obtained by the linear combination of Lorentzian and Gaussian lines. Sample KA ox could be fitted well by using two
10 20 30 40 50 -40 -30 -10 0 10 20 30 40 0 0. 5 1 1. 5 2 2. 5 x 10⁻⁸ 10 20 30 40 50 -40 -30 -20 -10 0 10 20 30 40 0 0..5 1 1. 5 2 2. 5 3 x 10⁻⁸ 10 20 30 40 50 -40 -30 -20 -10 0 10 20 30 40 0 0.2 0.4 0.6 0.8 1 1.2 1.4 1.6 Bc [mT] Bu [mT ] x 10-8 Figure 3a Figure 3b Figure 3c Bc [mT] Bc [mT] Bu [mT ] Bu [mT ] -20
Figure 3. FORC diagrams (smoothing factor 3) of (a) KA (b) KA ox and (c) KA dith.
components with the same geffand similarδB. For the spectra of
KA dith revealing the additional shoulder, the best fit was achieved by the combination of the components with differentδB as well as
geff(Fig. 8).
The EPR spectra at low temperature exhibited the expected in-crease in intensity for the paramagnetic signal and a slight dein-crease for the broad FMR (Fig. 9). The lineshape of KA and KA ox showed no significant change whereasδB increased at T < 100 K (Fig. 9). Between 50 and 10 K theδB of KA and KA ox revealed a pro-nounced increase of about 60 and 30 per cent, respectively (Fig. 10). TheδB of KA dith exhibited a different behaviour. It increased slightly upon cooling to 120 K, thenδB almost doubled between 120 and 100 K, followed by a steady increase down to 10 K. Due to the superimposed paramagnetic signal, gefffor the FMR at low
temperatures could not be determined exactly from the spectra.
4 D I S C U S S I O N
The hysteresis loop of the untreated sample shows that the rema-nent magnetic properties are dominated by a low coercivity phase. Theχ versus temperature measurement shows that this phase has a Tcof about 850 K, which is indicative of magnetite. The
semi-quantitative EDX analysis shows the presence of minor amounts of Ti in the magnetite grains. The Ti content, however, has to be rela-tively low, because it is not documented in a significant lowering of
Tc(e.g. Dunlop & ¨Ozdemir 1997). The bump inχ at about 570 K
is probably due to the conversion of ferric hydroxides into an oxide, most likely hematite. The lack of clear evidence for a N´eel tempera-ture of hematite inχ at T > 870 K points to a very low concentration of this ferric oxide in the heated sample. Upon cooling the increase
inχ indicates the generation of additional magnetite as a conversion product most likely of clay minerals.
The magnetite particles in the soil samples resist chemical treat-ment with oxalate and CBD as indicated by the hysteretic properties. This is supported by the similar morphologies of the grains under the SEM (Fig. 4). Gehring et al. (1997) showed that oxalate ex-tracts about 10 per cent of the total Fe in the sample. The oxalate extractable Fe can be attributed to poorly crystallized ferric oxides which do not significantly contribute to the magnetic remanence of the sample. The difference inχ between KA and KA ox is smaller than the variability ofχ in the original topsoil material ranging be-tween 74 and 86× 10−8m3kg−1(Gehring et al. 1997). With this in
mind it is postulated that KA and KA ox are similar with respect to theirχ. The CBD treatment is known to dissolve ferric oxides such as hematite and maghemite. Furthermore, CBD can also dissolve superparamagnetic (SP) and SD magnetite (Hunt et al. 1995; Van Oorschoot & Dekkers 1999). In our soil sample, CBD extracts 25 per cent of the total Fe (Gehring et al. 1997). The fact, that CBD extracts more Fe than oxalate, indicates a significant content of crys-talline ferric oxides that contribute to the remanence of the sample. This agrees well with the decrease inχ in the CBD treated sam-ple, which is most likely due to the removal of maghemite, since no clear indication for hematite has been found in the soil samples. The
χ values are low compared to the bulk susceptibility of magnetite
and titanomagnetite found in the literature (e.g. Peters & Dekkers 2003). These authors reported averageχ values of 67 × 10−5m3
kg−1for magnetite, 42× 10−5m3kg−1for titanomagnetite and 63×
10−5m3kg−1for maghemite, which are about three orders of
mag-nitude higher than the susceptibility of our soil sample. Therefore, assuming that susceptibility arises only from ferrimagnetic phases,
a
c
e
b
d
f
TiKα TiKβ VKα VKβ FeKβ FeKα TiKα TiKβ VKα FeKβ FeKα TiKα TiKβ VKαVKβ FeKβ FeKα 4.00 5.00 6.00 7.00 4.00 5.00 6.00 7.00 4.00 5.00 6.00 7.00 [keV] [keV] [keV]Figure 4. SEM micrograph and semi-quantitative EDX analysis of a larger
magnetite particle in (a, b) KA, (c, d) KA ox and (e, f) KA dith.
100mT KA KA_ox KA_dith g = 4.3 geff geff geff geff geff geff geff geff geff g = 2 KA_acid
Figure 5. EPR spectra of KA, KA ox, KA dith and KA acid.
a concentration of magnetite/maghemite of approximately 0.1 wt per cent can be deduced for it.
The hysteretic properties (i.e. Bcand Mr/Ms) of KA, KA ox, and
KA dith give clues to PSD magnetite, which is characterized by grain sizes in the range from 0.3 to approximately 20µm (Dunlop & ¨Ozdemir 1997). Parameters indicative of PSD grains are often found in soils and sediments and can also be produced by a mixture of particles with a wide variation of grain sizes (Roberts et al. 2000).
0 90 180 270 360 2.10 2.15 2.20 2.25 2.30 2.35 2.40 Angle (degrees) geff KA KA_ox KA_dith
Figure 6. Angular dependence of gefffor KA, KA ox and KA dith with the
minimum in geffset at 0◦.
0 90 180 270 360 130 150 170 190 210 1 2 δB [mT] Angle [degrees] 100 mT 1 2 a b
Figure 7. (a) Angular dependence ofδB for KA dith corresponding to the
one of geffin Fig. 6 and (b) two spectra whenδB is in (1) the maximum
range (at 110◦) and (2) in the minimum range (at 235◦).
Weakly diverging open contours in the FORC diagram as found for KA, KA ox and KA dith (Fig. 3) have been described for magnetite in PSD state (Carvallo et al. 2005). The spread along Buin the FORC diagram has been denoted as reversal ridge and can be generated by SP phases (Roberts et al. 2000) or by MD particles (Pike et al. 2001). Since SP magnetite is ruled out (Gehring et al. 1997), the reversal ridge is most likely caused by MD particles. It follows that the magnetite grains in the soil can be considered as PSD to MD. This is in good agreement with the SEM observations which revealed magnetite grains of a size generally larger than 20µm. The similarity of the FORC diagrams, however, provides clear evidence that the grain size distribution of magnetite has not changed during the chemical treatments.
The EPR spectra of all samples except KA-acid are dominated by a broad signal characteristic for FMR, but they differ in their EPR parameters geffandδB. It is well known that magnetite and
maghemite can produce strong FMR signals (e.g. Griscom 1984; Gehring & Karthein 1990). Other ferric oxides such as goethite and hematite can also cause a broad resonance (Angel & Vincent 1978; Gehring & Karthein 1989). Because the absorption intensity is proportional to the susceptibility, the EPR signal of these ferric oxides will be weak and hidden by the signal arising from mag-netite/maghemite. Therefore, the removal of goethite and hematite cannot account for the observed spectral changes upon CBD
δB = 150 mT geff = 2.29 δB = 85 mT geff = 3.40 100 mT L G
a
b
Figure 8. (a) Comparison of the measured (solid line) and the fitted (dotted
line) spectrum of KA dith. (b) The fitting consists of a broad Lorentzian (L) and a narrow Gaussian (G) component with different spectral parameters
geffandδB.
treatment. The observed changes could result from the dissolution of SD magnetite and maghemite or by partial chemical modifica-tion of MD or PSD magnetite. The similarity of the FORC diagrams before and after CBD treatment argues against significant changes of the magnetite properties, and thus in favour of the dissolution of the maghemite. The occurrence of a shoulder in the KA dith FMR spectrum upon rotation suggests an additional directionally dependent absorption in the sample where maghemite has been re-moved. Schl¨omann & Zeender (1958) describe additional subsidiary peaks in polycrystalline ferrites occurring on the low-field side of the main resonance and explain them by strong magnetocrystalline
KA KA_ox KA_dith 100 mT 150K 100K 80K 30K
Figure 9. Low-temperature EPR spectra of KA, KA ox and KA dith.
30 60 90 120 150 160 200 240 280 320 360 Temperature [K] δB [m T] KA_dith KA_ox KA 0
Figure 10. δB versus temperature for KA, KA ox and KA dith at low
tem-perature.
anisotropy. Therefore, it is assumed that the shoulder found in the KA dith spectra is caused by the magnetocrystalline anisotropy. With this in mind, a likely reason why the secondary absorption de-scribed above is clearly visible in the KA dith only, is that maghemi-tization reduces or masks the magnetocrystalline anisotropy. With other words, there is a link between CBD treatment and the increase of the magnetocrystalline anisotropy. Considering the maghemiti-zation as a topotactical transformation (Gallagher et al. 1968), the dissolution of maghemite increases the Fe(II)/Fe(III)ratio in the crystal
structure. It is known that magnetocrystalline anisotropy energy in magnetite arises mainly from Fe(II)(e.g. Dunlop & ¨Ozdemir 1997),
and, therefore, the maghemitization, that is, oxidation of Fe(II),
re-duces it, suppressesing the secondary EPR absorption in KA and KA ox. The angular dependence of this absorption, which is clearly visible for KA dith, was not considered by Schl¨omann & Zeender (1958). Despite this fact, the behaviour of the secondary peak can be explained based on their findings. These authors showed for ho-mogeneous polycrystalline systems a dependence of the intensity of the subsidiary absorption from the magnitude of the anisotropy and its influence on the effective field. In such a system, one can as-sume a randomized distribution of the anisotropies of the individual grains, and thus, of the corresponding easy axes. In natural samples, however, the magnetite grains are highly diluted in the soil matrix. In our experimental design, these magnetite grains in untreated and chemically treated samples are fixed relative to each other. As a con-sequence, the distribution of the easy axes has a given preferential
orientation which leads to the angular dependence of the secondary EPR absorption indicated by geff(Fig. 6). The angles where geffhas
its maxima can be assigned to the configuration where most of the easy axes have the lowest angular departure relative to the applied field (e.g. Bickford 1950).
The low temperature EPR data provide further evidence for the maghemitization of magnetite in our tropical soil. The jump inδB for KA dith between 100 and 120 K occurs in the same temperature range where the Verwey transition of magnetite has been observed. At this transition, the crystallographic structure changes from cu-bic to monoclinic (e.g. Muxworthy & McClelland 2000). Only a few low-temperature EPR data are available on natural magnetite (Gehring & Karthein 1989; Weiss et al. 2004; Ananou et al. 2005; Kopp et al. 2006). Weiss et al. (2004) used the increase inδB of 30 per cent between RT and 77 K as an indication for a Verwey transi-tion. The samples KA and KA ox, which show no jump between 120 and 100 K exhibit an increase between RT and 80 K by about 50 per cent. Hence, the broadening in such a temperature range cannot be taken as an unambiguous evidence for a Verwey transition. Ananou
et al. (2005) published a sequence of low temperature EPR data of
a tephra containing magnetite/maghemite and another ferric oxide, in which no spectral changes between 120 and 100 K were found. The EPR data on synthetic magnetite reported in the literature show also no uniform picture of the Verwey transition. Different phenom-ena such as line broadening, loss of absorption or the appearance of new signals have been described associated with this transition (e.g. Bickford 1950; Kale et al. 2001; Stankowski et al. 2006). A jump in linewidth as found for KA dith was observed in a zero field cooled Fe3O4crystalline film (Kale et al. 2001). These authors
ex-plained this phenomenon by an increase in possible easy axes caused by the crystallographic changes from cubic to monoclinic. With this in mind, we assume that the observed jump inδB indicates a Verwey transition in KA dith. The absence of this jump in the spectra of the KA and KA ox samples indicates a suppression of the Verwey tran-sition. Such a suppression can be caused by either oxidation, that is, maghemitization, defect structures ( ¨Ozdemir et al. 1993), or by an increased Ti content (Kakol et al. 1992). The CBD treatment is known to dissolve maghemite (Van Oorschoot & Dekkers 1999), but leaves larger magnetite grains (>20 µm) mainly unaffected (Hunt
et al. 1995). Therefore, the visibility of the Verwey transition in
KA dith is most likely due to the removal of maghemite associated with the magnetite surface. Finally, such oxidation of the magnetite surfaces fits well in the depositional environment of a subtropical alluvial Vertisol which is characterized by relative fast weathering dynamics.
5 C O N C L U S I O N
The combination of EPR spectroscopy and rock magnetic methods applied to untreated and chemically treated soil samples allowed to detect the maghemitization of magnetite. The rock magnetic meth-ods identified magnetite as the only carrier of the remanent magne-tization at RT. The FORC diagrams showed that the different chem-ical treatments did not change significantly the magnetic properties of the magnetite grains. The EPR spectral properties of the CBD treated sample, from which maghemite was extracted, provided an indirect proof for the maghemitization of the magnetite surface. The elimination of the surface oxidation by removing the oxidation prod-uct increased the magnetocrystalline anisotropy of the magnetite at RT as indicated by the angular dependence of geffandδB. At low
temperature, the jump inδB between 100 and 120 K indicating a Verwey transition in the magnetite is also visible after the removal of
maghemite. The presented experimental approach clearly demon-strates that EPR spectroscopy can be an additional tool to detect maghemitization in natural samples.
A C K N O W L E D G M E N T S
The authors thank K. Kunze for the SEM work; Igor Gromov for his help during the low temperature EPR measurement, and Bill Lowrie and two anonymous reviewers to improve the manuscript. This research was supported by the ETH research grant TH02296, contribution n◦1495, Institute of Geophysics, ETH Zurich.
R E F E R E N C E S
Ananou, B., Baronnet, A., Ksari, Y., Marfaing, J., Regnier, S., Rochette, P., Sulpice, A. & Stepanov, A., 2005. Magnetic properties of marine tertiary tephra investigated over a wide temperature range, J. Magn. Magn. Mater.,
293, 816–825.
Angel, B.R. & Vincent, W.E.J., 1978. Electron spin resonance studies of iron oxides associated with the surface of Kaolinite, Clays Clay Miner.,
26, 263–272.
Bickford, L.R., 1950. Ferromagnetic resonance absorption in magnetite sin-gle crystals, Phys. Rev., 78(4), 449–457.
Carvallo, C., Dunlop, D.J. & ¨Ozdemir, ¨O., 2005. Experimental comparison
of FORC and remanent Preisach diagrams, Geophys. J. Int., 162, 747– 754.
Chen, T., Xu, H., Xie, Q., Chen, J., Ji, J. & Lu, H., 2005. Characteristics and genesis of maghemite in Chinese Loess and paleosols: mechanism for magnetic susceptibility enhancement in paleosols, Earth planet. Sci.
Lett., 240, 790–802.
Dunlop, D. & ¨Ozdemir, ¨O., 1997, Rock magnetism: fundamentals and
fron-tiers, Cambridge University Press, Cambridge, UK.
Gallagher, K.J., Feitknecht, W. & Mannweiler, U., 1968. Mechanism of ox-idation of magnetite to gamma-Fe2O3, Nature, 217, 1118–1121. Gehring, A.U. & Karthein, R., 1989. ESR Study of Fe(III) and Cr(III)
Hy-droxides, Naturwissenschaften, 76, 172–173.
Gehring, A.U. & Karthein, R., 1990. An ESR and calorimetric study of iron oolitic samples from the Northampton Ironstone, Clay Miner., 25, 303–311.
Gehring, A.U., Guggenberger, G. & Luster, J., 1997. Combined magnetic, spectroscopic, and analytical-chemical approach to infer genetic informa-tion for a vertisol, Soil Sci. Soc. Am. J., 61(1), 78–85.
Goulart, A.T., Dejesus, M.F., Fabris, J.D. & Coey, J.M.D., 1994. Charac-terization of a soil ilmenite developed from basalt, Hyperfine Inter., 91, 771–775.
Griscom, D.L., 1974. Ferromagnetic resonance spectra of lunar fines: some implications of line shape analysis, Geochim. Cosmochim. Acta, 38, 1509– 1519.
Griscom D.L., 1980. Ferromagnetic resonance of fine grained precipitates in glass: a thumbnail review, J. Non-Cryst. Solids, 42, 287–296. Griscom, D.L., 1984. Ferromagnetic resonance of precipitated phases in
natural glasses, J. Non-Cryst. Solids, 67, 81–118.
Henshaw, P.C. & Merrill, R.T., 1980. Magnetic and chemical changes in marine sediments, Rev. Geophys. Space Phys. 18(2), 483–504. Hunt, C.P., Singer, M.J., Kletetschka, G., Ten Pas, J. & Verosub, K.L., 1995.
Effect of citrate-bicarbonate-dithionite treatment on fine-grained mag-netite and maghemite, Earth planet. Sci. Lett., 130, 87–94.
Kale, S. et al., 2001. Film thickness and temperature dependance of the
magnetic properties of pulsed-laser-deposited Fe3O4 films on different
substrates, Phys. Rev. B, 64, 2054 131–2054 139.
Kakol, Z., Sabol, J., Stickler, J. & Honig, J.M., 1992. Effect of low-level tita-nium(IV) doping on the resistivity of magnetite near the Verwey transition,
Phys. Rev. B, 46, 1975–1978.
Kittel, C., 1946. Theory of the dispersion of magnetic permeability in fer-romagnetic materials at microwave frequencies, Phys. Rev., 70, 281–290.
Kittel, C., 1948. On the theory of ferromagnetic resonance absorption. Phys.
Rev., 73(2), 155–161.
Kopp, R.E., Weiss, B.P., Maloof, A.C, Vali, H., Nash, C.Z., Kirschvink, J.L., 2006. Chains, clumps, and strings: Magnetofossil taphonomy with ferromagnetic resonance spectroscopy, Earth planet. Sci. Lett., 247(1–2), 10–25.
Meads, R.E. & Malden, P.J., 1975. Electron spin resonance in natural
KAolinites containing Fe(III) and other transition metal ions, Clay Miner.,
10, 313–345.
Mehra, O.P. & Jackson, M.L., 1960. Iron oxide removal from soils and clays by a dithionite-citrate system buffered with sodium bicarbonate. Clays
Clay Miner., 9, 317–327.
Muxworthy, A.R. & McClelland, E., 2000. Review of the low-temperature magnetic properties of magnetite from rock magnetic perspective,
Geo-phys. J. Int., 140, 101–114.
¨
Ozdemir, D., Dunlop, D.J. & Moskowitz, B.M., 1993. The effect of oxidation on the Verwey transition in magnetite, Geophys. Res. Lett., 20, 1671– 1674.
Peters, C. & Dekkers, M.J., 2003. Selected room temperature magnetic pa-rameters as a function of mineralogy, concentration and grain size. Phys.
Chem. Earth., 28, 659–667.
Pike, C.R, Roberts, A.P., Dekkers, M.J. & Verosub, K.L., 2001. An investi-gation of multi-domain hysteresis mechanisms using FORC diagramms.
Phys. Earth Planet. Inter., 126, 11–25.
Roberts, A.P., Pike, C.R. & Verosub, K.L., 2000. First-order reversal curve diagrams: A new tool for characterizing the magnetic properties of natural samples, J. geophys. Res., 105, 28 461–28 475.
Schl¨omann, E. & Zeender, J.R., 1958. Ferromagnetic resonance in polycrys-talline nickel ferrite aluminate, J. appl. Phys., 29, 341–343.
Schwertmann, U., 1964. Differenzierung der Eisenoxide des Bodens durch Extraction mit Ammoniumoxalat-L¨osung, Z. Pflanzenern¨ahrung,
D¨ungung Bodenkunde, 105, 194–202.
Smirnov, A.V. & Tarduno, J.A., 2000. Low-temperature magnetic properties of pelagic sediments (Ocean Drilling Program Site 805 C): Tracers of maghemitization and magnetic mineral reduction, J. geophys. Res., 105, 16 457–16 471.
Stankowski, J., Kempinski, W., Los, S., Bednarski, W., Waplak, S. & Micnas, R., 2006. Two paramagnetic iron states at the Verwey phase transition in magnetite, J. Magn. Magn. Mater., 301, 88–93.
Stumm, W. & Morgan, J.J., 1996. Aquatic chemistry, Wiley, New York. Van Oorschoot, I.H.M. & Dekkers, M.J., 1999. Dissolution behaviour of fine
grained magnetite and maghemite in the citrate-bicarbonate-dithionite extraction method, Earth planet. Sci. Lett., 167, 283–295.
Van Velzen, A.J. & Dekkers, M.J., 1999. Low-temperature oxidation of mag-netite in loess-paleosol sequences: a correction of rock magnetic param-eters, Stud. Geophys. Geod., 43, 357–375.
Vonsovskii, S.V. (ed.) 1966. Ferromagnetic resonance, Pergamon Press, Ox-ford.
Weiss, B.P., Kim, S.S., Kirschvink, J.L., Kopp, R.E., Sankaran, M., Kobayashi, A. & Komeili, A., 2004. Ferromagnetic resonance and low-temperature magnetic tests for biogenic magnetite, Earth planet. Sci. Lett.,
224, 73–89.
Wertz, J.E. & Bolton, J.R., 1972, Electron spin resonance, McGraw-Hill, New York.
![Figure 1. Changes in χ upon heating and subsequent cooling of sample KA. -224 M [memu]-400-200 200 400 B [mT]KA_acidKA-4](https://thumb-eu.123doks.com/thumbv2/123doknet/14901211.653727/3.918.508.831.81.253/figure-changes-heating-subsequent-cooling-sample-memu-acidka.webp)