Urinary Analysis of Four Testosterone Metabolites and
Pregnanediol by Gas Chromatography-Combustion-
Isotope Ratio Mass Spectrometry after Oral
Administrations of Testosterone
Arnaud Maitre, Christophe Saudan*, Patrice Mangin, and Martial SaugyLaboratoire Suisse d'Analyse du Dopage, Institut Universitaire de M~decine L~gale, Rue du Bugnon 2 I, 1005 Lausanne, Switzerland
Abstract
The most frequently used method to demonstrate testosterone abuse is the determination of the testosterone and epitestosterone concentration ratio (T/E ratio) in urine. Nevertheless, it is known that factors other than testosterone administration may increase the T/E ralio. In the last years, the determination of the carbon isotope ratio has proven to be the most promising method to help discriminate between naturally elevated T/E ratios and those reflecting T use. In this paper, an excretion study following oral administration of 40 mg testosterone undecanoate initially and 13 h later is presented. Four testosterone metabolites (androsterone, etiocholanolone, 5o~-androstanediol, and 5[~-androstanediol) together with an endogenous reference (5[3-pregnanediol) were extracted from the urines and the ~t3C/12C ratio of each compound was analyzed by gas chromatography-combustion-isotope ratio mass spectrometry. The results show similar maximum 613C-value variations (parts per thousand difference of 813C/12C ratio from the isotope ratio standard) for the T metabolites and concomitant changes of the T/E ratios after administration of the first and the second dose of T. Whereas the T/E ratios as well as the androsterone, etiocholanolone and 5u.-androstanediol 813C-values returned to the baseline 15 h after the second T administration, a decrease of the 5~-androstanediol ~-values could be detected for over 40 h. This suggests that measurements of 5~-androstanediol 8-values allow lhe detection of a testosterone ingestion over a longer post-administration period than other T metabolites 813C-values or than the usual T/E ratio approach.
Introduction
The detection of doping with testosterone is mainly based on the concentration measurement of the testosterone (T) to
* Author to whom correspondence should be addressed; Laboratoire Suisse d'Analyse du Dopage, Institul Universitaire de M~k:lecine L~.gale, Rut' du Bugnon 21, 1005 Lausanne, Swilzerland, E-maih csaudan@hospvd.ch.
epitestosterone (E) ratio (T/E ratio). If this T/E ratio is greater than 6 in the urine of a competitor, it is mandatory that addi- tional investigations should be conducted. Isotope ratio mass spectrometry (IRMS) may be used in this context as an addi- tional analysis to help in deciding whether an elevated T/E ratio can be explained by a misuse of testosterone (1-4) or testosterone precursors (4,5). Indeed, it is known that other fac- tors than testosterone administration may lead to T/E ratio exceeding 6 (6,7).
IRMS allows measurements of slight differences in the carbon isotope ratio (13C/12C) of the exogenous and endogenous testos- terone. Synthetic testosterone is produced from precursors de- rived from plants with low 13C content, whereas the 13C and 12C content in the natural endogenous form depends on the iso- topic carbon composition of the food diet and is influenced by additional effects of human biological processing (8). Such dif- ferentiation between synthetic and endogenous origins has also been reported for other hormones such as epitestosterone (9), nandrolone (10), and corticosteroids (11).
Very few time profile IRMS studies with the chronological de- termination of T/E ratio after oral testosterone administration are reported in the literature (2,3,12). Chronological measure- ment of the carbon isotopic ratio of T metabolites was able to detect T administration in cases in which the T/E ratio re- mained below 6 (2). It must be noted that in this latter study the five volunteers were of Chinese ethnicity, and therefore, the cutoff limit of a T/E ratio of 6 that is suited for the caucasian race is questionable when used on a Chinese subject population. It is also worth mentioning that the excretion studies on two caucasian volunteers after one oral ingestion of T undecanoate (3). These excretion studies report the detection of exogenous T by gas chromatography-combustion-isotope ratio mass spec- trometry (GC-C-IRMS) after the T/E ratio had returned to below 6. The determination of exogenous T with GC-C-IRMS was possible for more than twice as long as with application of T/E ratio limits.
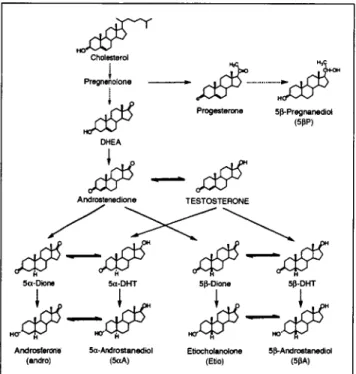
This paper describes the time courses of isotopic ratio values in urine of androsterone (Andro), etiocholanolone (Etio), 5(x- androstanediol (5aA), 513-androstanediol (513A), and the en- dogenous reference 5[~-pregnanediol (513P) in the frame of an excretion study following oral ingestion of testosterone ini- tially and 13 h later by a healthy, male, caucasian volunteer (Figure 1). The profile of the T/E ratio is also compared with the results obtained by IRMS. These excretion studies are funda- mental in understanding how the time profile of IRMS values is affected after multiple oral ingestions of testosterone. To our knowledge, there is no report of chronological application of the isotope ratio technology and the T/E ratio to monitor an ex- cretion study with multiple oral testosterone ingestions.
Experimental
Chemicals
All solvents and reagents of analytical grade purity were pur- chased from Fluka (Buchs, Switzerland). 5c~-Androstan-3[3-ol acetate, 5~-androstane-3(~,1713-diol, 513-androstane-3(~,17[~- diol, 5[3-pregnane-3(x,20c~-diol, etiocholanolone, and andros- terone with a purity of at least 99.5% were obtained either from Steraloids Inc. (Newport, RI) or Sigma Chemical Co. (St. Louis, MO). Bakerbond spe TM 500-rag or 1000-mg octadecyl
C18
disposable extraction columns were obtained from J.T. Baker (Phillipsburg, N J). ~-Glucuronidase fromEscherichia coli in a 50% glycerol solution (pH 6.5, 140 U/mL at 37~ was supplied by Roche Diagnostics GmbH (Mannheim, Germany). The ref- erence carbon dioxide gas was purchased from Carbagaz (Dom- didier, Switzerland). The mixture of three alkanes, C15 (n-pentadecane), C20 (n-eicosane), and C25 (n-pentacosane), was supplied by Chiron AS (Trondheim, Norway).
Cholesterol Pregnenolone ~. ... [ S Progesterone 5~-Pregnanediot (5pP) DHEA Androstenedione TESTOSTERONE
S - -.S
5~-Dione 5a-DHT 5~-Dione 5~-DHT
Andros~er0n~ 5a-Androstanediol EtJocho[anolone 5~-Androstanediol
(andro) (5r (EtJo) (5pA)
Figure
1. Metabolic pathways of testosterone.Dosage and collection of urine samples
A 40-mg testosterone undecanoate capsule (Panteston | Organon SA, France) were self-administered orally initially and 13 h later by a healthy, male, caucasian volunteer. Baseline urine samples were obtained before initial administration, and 39 subsequent spot urine samples were collected over a period of 100 h after the first capsule administration. Reference urine samples were collected from 40 caucasian male subjects. In this excretion study, the spot urine with the T/E ratio of 36 at t = 2.3 h was selected to be the positive quality control urine (QC-pos). The negative quality control urine (QC-neg) was ob- tained from a healthy subject. Each urine was aliquoted into 15- mL cryogenic tubes and stored without additives at-20~ until analysis.
Sample preparation
The urine sample (10 mL) was centrifuged in glass tubes at 2500 rpm for 5 min and was applied onto a C18 column (500 rag). The conjugated steroids were eluted with methanol (8 mL) and the eluate evaporated to dryness. To hydrolyze the con- jugated steroids, the residue was dissolved in 1 mL of 0.2M phosphate buffer (pH 7.0) and 50 pL of [3-glucuronidase was added as supplied. After incubation at 50~ during I h (or at 37~ overnight) in a thermostated water bath, the deconjugated steroids were extracted on C18 column (500 rag) by washing with 6 mL acetonitrile/H~O (20:80, v/v) and subsequently by 6 mL acetonitrile/H20 (35:65, v/v) and finally eluted with 12 mL acetonitrile. The eluate was evaporated to dryness under a ni- trogen stream (Turbo Vap LV evaporator, Zymark, Hopkinton, MA), and then the residue was dried over phosphorus pen- toxide for 20 min. Acetylation of the extract was carried out in 50 pL of pyridine and 50 pL of acetic anhydride at 60~ for 1 h incubation. The reaction medium was evaporated to dryness and subsequently the residue was redissolved in 3 mL of ace- tonitrile/H20 (50:50, v/v). The solution was applied onto a C18 column (1000 rag). The fraction F1 containing androsterone and etiocholanolone was obtained by elution with 15 mL ace- tonitrile/H20 (75:25, v/v) after washing with 12 mL of acetoni- trile/H20 (50:50, v/v). Finally, the fraction F2 with the androstandiols and the pregnanediol was obtained by eluting with 12 mL of acetonitrile. The derivatized steroids of frac- tions F1 and F2 were spiked with 40 I~L and 10 I~L of an internal standard (IS, 5(~-androstan-3[3-ol acetate, 0.20 mg/mL in methanol), respectively. Then both fractions F1 and F2 were evaporated to dryness and finally dissolved in 500 pL and 40 pL of cyclohexane, respectively.
GC-C-IRMS analysis
The carbon isotope measurements were performed on a Delta Plus IRMS system (Thermo Finnigan MAT, Bremen, Ger- many) coupled to an Agilent 6890A GC (HP Analytical Division, Waldbronn, Germany) via a Finnigan GC Combustion III in- terface (Thermo Finnigan MAT, Bremen, Germany) and a CTC Analytics CombiPal autosampler (CTC Analytics AG, Zwingen, Switzerland). Chromatographic separations were achieved on an HP cross-linked 50% phenylmethylsiloxane fused silica cap- illary column (J&W Scientific, 30 m x 0.25-ram i.d., 0.15-pro film thickness). The injector temperature was set to 280~
The combustion and reduction oven temperatures were set to 940~ and 600~ respectively. Reference carbon dioxide gas pulses (20-s durations) were introduced at four different times during the course of the chromatographic separation. For the calibration of the reference gas with the alkane mixture of known 813C-values, the oven temperature was increased from 80~ (1 rain) to 270~ (7.0 min) at 15~ For the analysis of the androsterone and etiocholanolone acetates (fraction F1), the oven temperature was increased from 80~ (1 min) to 270~ (8.3 min) at 15~ then to 300~ at 35~ and maintained at the final temperature for 3 rain. For the analysis of the fraction F2 containing the androstandiols and the preg- nanediol acetates, the oven temperature was increased from 80~ (1 rain) to 270~ (11.5 min) at 15~ then to 300~ at 35~ and maintained at the final temperature for 3 min. The volume of injection was 1-2 pL, depending on the estimated concentrations of the compounds of interest as eval- uated in the frame of the T/E ratio determination. The extracts were injected twice in the splitless mode, and the replicate measurements were averaged.
The symbol 8 is the standard notation for expressing carbon isotope ratios. It is defined as parts per thousand deviation of isotopic compositions from that of Pee Dee Belemnite (PDB), and is calculated according to:
813C/%_ (13C/12C)sample - (13C/12C)standard
(13C/12C)standard
Negative shifts of the 813C-value due to the formation of an acetate were corrected as follows:
DOH =
DoAc
+ 2m (D~ - DAc) nWhere Dou is (31:lC-value for the underivatized steroids, DOA c
is the 81:~C-value for the acetylated steroids, DAc is the 813C - value for the acetylating reagent, n is the number of carbon atom in a molecule, and m is the number of hydroxyl groups to be acetylated.
All subsequent 813C-values have been corrected for this neg- ative shift. The DAC value of our acetylating reagent was deter- mined to be -48.8%o according to a published procedure (13).
Determination of steroid concentration and T/E ratio
Urinary testosterone and epitestosterone were quantified in all the samples and the concentration of the steroids of in- terest were quantified according to the method of Nolteernsting et al (14).
Results and Discussion
Isotope measurements, accuracy, and reproducibility of the method
The reference carbon dioxide gas, which is pulsed several times during the course of the chromatographic separation, is calibrated by a mixture of three alkanes, CI5 (n-pentadecane),
C20 (n-eicosane), and C25 (n-pentacosane), from Chiron AS with 813C-values of-30.22, -33.06, and-28.21%o, respectively. The internal standard (5or acetate) was mea- sured together with this alkane mixture and the 813C value was -31.9%o (n = 50, SD = 0.2%o).
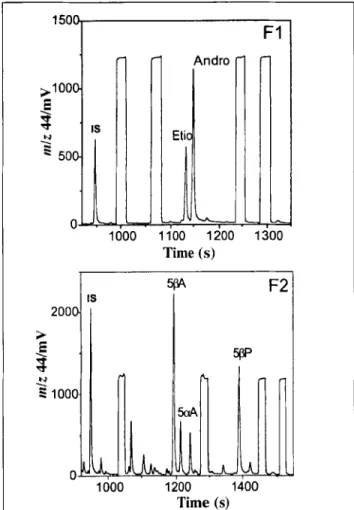
The extraction method allows the separation of androsterone (Andro) and etiocholanolone (Etio) acetates from the 5cr drostanediol (5(zA), 5[3-androstanediol (5~A), and pregnane- diol (513P) acetates on the C18 column by eluting with different ratio mixture of acetonitrile/H20 (15). Before the GC-C-IRMS analysis, an internal standard (5or acetate) with a known 813C-value is spiked in both fractions. Figure 2 shows an example of GC-C-IRMS chromatograms ofm/z 44 for fractions F1 and F2. The chromatograms show symmetrical peaks for the compounds of interest, no tailing, and no evidence of co-eluting compounds.
Each batch includes positive (QC-Pos) and negative (QC- Neg) quality controls and the measurements are performed for all metabolites in the linear range of the IRMS. The purpose of the quality controls is to verify the reproducibility of the ex- traction procedure and the GC--C-IRMS measurements. The two incubation procedures given in the experimental part have been verified with the positive and negative quality controls to
1500 >1000 E ~" ' IS ~ 50 1000 Andro 1100 1200 Time (s) F1
LL
1:300 5~ F2 IS > 2001 O r , . , . 1000 1200 1400 Time (s)Figure 2. Typical GC-C-IRMS m/z 44 mass chromatograms of fractions
F1 (androsterone and etiocholanolone acetates)and F2 (5cr
diol, 5[~-androstanediol, and 5[3-pregnanediol acetates) spiked with an internal standard (IS, 5mandrostan-3~-ol acetate). The square-topped peaks represent pulses of CO2 reference gas.
give comparable results. The within-assay precision was deter- mined by extracting six aliquots of QC-Pos and QC-Neg and in- jecting each once within the same day. For the determination of the between-assay precision, 20 aliquots of QC-Pos and QC- Neg were extracted by 4 different technicians over a period of 18 months, and injected once each. For the within-assay precision the overall means and SD for etiocholanolone, androsterone, 5[~-androstanediol, 5@-androstanediol, and 5[3-pregnanediol in
-2o ~o" ,~o " ,;o " 18 "1oo
Time (h) -30 9 -30 40 .-28 ~ 30. 9 -26 ~[ ~ 20. [,,. ~ 10, 4 3 1 -20 --28 --26 ~=
1.2,==
--22 20 40 60 80 180 Time (11) -30 9 -28 ( ~ b 9 Qrr % J ; ~, 9 -20 28 4O 60 80 100 Time (h) 40 30.~o
k
-28 0 o 28 40 60 Time (h) -30 , -28 ~ | ~ y i--2 =the QC-neg were -24.6 (+ 0.1), -24.2 (+ 0.2), -23.9 (+ 0.1), -23.6 (+ 0.3), and -23.2 (+ 0.2) %0, respectively, whereas in the QC-pos, -27.9 (+ 0.3),-27.7 (• 0.2), -28.2 (• 0.2), -28.0 (+ 0.2), and -23.2 (• 0.2) %owere obtained. For the between-assay precision, the overall means and SD for etiocholanolone, an- drosterone, 5[3-androstanediol, 5~-androstanediol, and 5~-preg- nanediol in the QC-neg were -24.4 (• 0.4), -24.0 (• 0.4), -24.3 (• 0.3), -24.3 (• 0.4), and -23.7 (• 0.4) %0, respectively. For the QC-pos, means and SDs of-27.8 (_+ 0.4), -27.9 -30 (+ 0.4),-27.8 (• 0.4),-28.4 (• 0.5), and -23.2 ~ (• 0.3) %owere obtained. These results indicate -28 ; that the SDs for each compound measured b
-" with QC-neg and QC-pos are slightly higher in the case of the between-assay precision com- pared to the within-assay precision. Although this method allows for the 813C-value deter- mination of five steroids, the SDs are compa- 80 10o rable to existing IRMS methods used for two T
metabolites (12,16).
,0J
/
-2o ~ "'2'o ' ;o " ~o" ~o "1~o
Time (h)
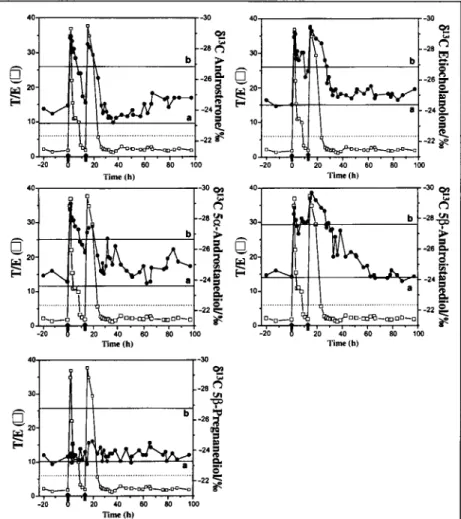
Figure 3. 813C-Values of androsterone, etiocholanolone, 50~-androstanediol, 5~-androstane- diol, and 5[~-pregnanediol together with the T/E ratio throughout the study period. Testosterone was administered at t = 0 and 13 h later (t = 13). The dotted line displays T/F ratio = 6. The hor- izontal lines a and b represent the 8UC-values for the mean and the mean - 3SD, respectively.
Table I. Absolute 813C-Values of Androsterone, Etiocholanolone, 5ffA, 5~A, and 5~P of a Healthy, Caucasian, Male Population*
Mean SD Range Median
This This This this
813C-value/%0 study ref 5 study Ref 5 study Ref 5 study Androsterone -23.2 - 1.23 - -21.2 to -25.3 - -23.2 Etiocholanolone -24.4 - 0.83 - -22.1 to-25.8 - -24.6 5cr -23,6 -17.5 1.00 3.53 -21.8 to-25.9 -10.5 to-24.6 -23.8 5r -24.2 -20.0 1.15 2.75 -22.0to-26.3 -15.2 to-24.6 -24.3 5~P -23,3 -21.0 1.17 1,65 -20.7to-25.6 -17.2 to-23.8 -23.2
* (n = 40)9 Data obtained by Ueki and Okano (5) for an athlete population of males and females of various ethnicities (n > 350).
~13C Values following oral testosterone administration
The GC-C-IRMS and the T/E ratio results from the excretion study following oral ad- ministration of 40 mg testosterone unde- canoate initially and 13 h later is shown in Figure 3. Figure 3 also shows the mean and the mean-3SD 813C-values for androsterone, etio- cholanolone, 5 ~ , 5~A, and 513P obtained after analysis of a reference population of healthy caucasian males (n = 40). Table I lists also the mean 813C-values, the median 813C-values, the SDs, the 813C range values of androsterone, etiocholanolone, 5r 5I~A, and 513P, together with the results obtained by Ueki and Okano (5) for 5~A, 5[3A, and 5[3P from a population of 450 athletes who had participated to the XVII Olympic Winter Games in Nagano (Japan). This population with a majority of Caucasian subjects may be compared to our data because a correction factor was used to convert all mea- sured 813C-values of the acetylated compounds to give values for underivatized steroids. A cor- rection factor was not applied for the popula- tion studies obtained by Shakelton et al. (2) and Aguilera et al. (16). As listed in Table I, only 5or 513A, and 513P may be compared with the data of Ueki and Okano (5). There are striking differences between the ranges found in the two laboratories with mean differences of 6.1, 4.2, and 2.3%o for 5r 5[3A, and 5[~P, re- spectively. Moreover, our SDs are much lower to those obtained by Ueki and Okano (5). These results may be explained by a difference of the analytical method or from the diet hetero- geneity of the population. Indeed, the diet of subjects from Europe is different from that of America and Japan and before the XVII
Olympic Winter Games in Nagano (Japan), the athletes did not eat the local diet for a sufficient time to have a measurable change of the steroids 813C-values in urine. Differences to eth- nicity may not explain the ranges of the 813C-values for 5 ~ , 513A, and 513P in a population (2,16).
As reported in previous studies (2,8), the r for 5bP should not be affected by the administration of testosterone since it has to be produced from cholesterol via several inter- mediates (Figure 1). A change of the 813C-value for 513P and for T metabolites could be expected if the individual modify dras- tically the diet during the study period. In the 41 urines col- lected during the excretion study, we determined a mean 813C-value of -23.7%o with SD = • 0.4%0, range: -22.6 to -24.6%0 and median -- -23.7%0 for 513P. The SD value is similar to what obtained with the between-assay of QC-neg and QC-pos and shows that the 813C-values for 513P remain constant during the time course of the excretion. These findings reveal no di- etary modification during the excretion study and are in agree- ment with previous investigations (2,8).
Interestingly, T/E ratio reach a maximum of 36 after both ad- ministrations and this value is higher than what has been re- ported (3) after an oral dose of 40 mg testosterone undecanoate for two caucasian individuals (T/E ratio = 22). These differ- ences may be rationalized as an interindividual variability in metabolism (17), such as genetic differences in the cytochrome P450 system (7) and preferential biotransformation of the steroids. Differences in volume distribution and body weights may also explain these results.
It is noteworthy that the T/E ratio increased rapidly following testosterone administration but returned below 6 after 10 and 15 h for the first and second T administrations, respectively (Figure 3). Therefore only the urines collected during this pe- riod would be considered as suspect and subject to further pro- cedures (6). Carbon isotope ratio measurements are also used for that purpose in detecting testosterone abuse. Similarly to the T/E ratio, the 51:~C-values of the four T metabolites de- crease rapidly after T administration with a difference of about 5%o with respect to the endogenous reference 513P. These find- ings together with the fact that the values are out of the range as defined by the population mean - 3SD for all T metabolites would be strong indicators of testosterone abuse. Indeed, a dif- ference superior to 4%o with respect to the endogenous refer- ence 5~P is indicative of an exogenous T ingestion (8,16). This difference of 4%o is slightly higher to 3SD for all T metabolites of the reference population (Table I).
The results show similar maximum 8t:3C-value variations for the T metabolites and concomitant changes of the T/E ratios after administration of the first and the second dose of T. Whereas androsterone, etiocholanolone, and 5c~-androstane- diol 8-values returned to the baseline 15 h after the second T ad- ministration, a decline in the 5c~-androstanediol 8-values could be detected over 40 h. This finding may be related to different metabolic pathways with different kinetics from testosterone to T metabolites. For instance, it is known that urinary 5~-an- drostanediol arise from both hepatic and peripheral metabolism whereas urinary 5[3-androstanediol is considered to arise only from hepatic metabolism (16). One should also consider the wash out period between the administration of the first and the
430
second dose. About 10.3 h after the second T dose, it may be ob- served on the T/E ratio profile that there is likely no residual ef- fect on this parameter from the first dose, whereas it may not be excluded from the 5[3-androstanediol and ethiocholanolone 813C-values. Other excretion studies on different subjects with multiple T ingestions are variable dose schedules would be needed to test this effect.
It may be also emphasized that after ingestion of the second dose of T, there is a spot urine with a T/E ratio below 6 (T/E = 5.6 at t = 23.3 h) that shows for androsterone, etiocholanolone, 5r and 5[3-androstanediol a difference of 2.3, 4.6, 1.8, and 4.9960, respectively, with the 813C-value of the en- dogenous reference 5[~P. For the subsequent spot urine at t = 26 h, a T/E ratio of 2.7 was obtained with a ~13C-value superior to 4%0 for 5[3-androstanediol. From these results and other studies (3,12), it may be asked in routine procedure: 1. If the T/E ratio at 6 is still a valid cutoff and 2. What are the IRMS criteria to de- clare an exogenous T ingestion, that is, does all the measured T metabolite 813C-values or does only one have to be superior to 4%0. Further excretion studies with multiple T ingestions should help in the future in deciding which criteria should be unilaterally adopted.
In conclusion, our results suggest that measurements of 5[3- androstanediol 8-values allow the detection of a testosterone in- gestion over a longer postadministration period than other T metabolites 813Covalues or than the usual T/E ratio approach. A difference of 4%o with respect to the endogenous reference 513P should be used as indicative of an exogenous T ingestion. As dis- cussed previously, the use of a reference population to report positive samples is questionable.
Acknowledgment
This study was supported by a grant from the Swiss Olympic Association. We thank C. Schweizer for fruitful discussions and S. Cruchon for technical assistance.
References
1. R. Aguilera, M. Becchi, H. Casabianca, C.K. Hatton, D.H. Catlin, B. Starcevic, and H.G. Pope. Improved method of detection of testosterone abuse by gas chromatography/combustion/isotope ratio mass spectrometry analysis of urinary steroids. J. Mass Spec- trom. 31:169-176 (1996).
2. C.H. Shackleton, A. Phillips, T. Chang, and Y. Li. Confirming testosterone administration by isotope ratio mass spectrometric analysis of urinary androstandiols. Steroids 62:379-387 (1997). 3. S. Hornig, H. Geyer, M. Machnik, W. Sch~inzer, A. Hilkert, and
J. Oebelmann. Detection of exogenous testosterone by 13C/12C analysis. In Recent advances in Doping Analysis (4), M. Donike, H. Geyer, A. Gotzmann, and U. Mareck-Engelke, Eds. Sport und Buch Strauss, K~ln, Germany, 1996, pp 275-284.
4. U. Flenker, S. Hornig, E. Nolteernsting, H. Geyer, and W. Sch~inzer. Measurement of 13C/12C-ratios to confirm misuse of endogenous steroids. In Recent Advances in Doping Analysis (6), W. Sch~nzer, H. Geyer, A. Gotzmann, and U. Mareck-Engelke, Eds. Sport und Buch Strauss, Edition Sport: Cologne, Germany, 1998, pp 243-256. 5. M. Ueki, M. Okano. Analysis of exogenous dehydroepiandros-
terone excretion in urine by gas chromatography/combustion/iso- tope ratio mass spectrometry. Rapid Commun. Spectrom. 13: 2237-2243 (1999).
6. D.H. Catlin, C.K. Hatton, and S. Starcevic. Issues in detecting abuse of xenobiotic anabolic steroids and testosterone by analysis of athletes urine. Olin. Chem. 43:1280-1288 (1997).
7. D.H. van de Kerkhof, D. de Boer, J.H.H. Thijssen, and R.A.A. Maes. Evaluation of testosterone/epitestosterone ratio influential factors as determined in doping analysis. J. Anal. Toxicol. 24: 102-115 (2000).
8. R. Aguilera, D.H. Catlin, M. Becchi, A. Phillips, C. Wang, R.S. Swerdloff, H.G. Pope, and C.K. Hatton. Screening urine for ex- ogenous testosterone by isotope ratio mass spectrometric anal- ysis of one pregnanediol and two androstanediols. J. Chromatogr. B 727:95-105 (1999).
9. R. Aguilera, C.K. Hatton, and D.H. Catlin. Detection of epitestos- terone doping by isotope ratio mass spectrometry. Clin. Chem. 48" 629~636 (2002).
10. J.-C. Mathurin, V. Herrou, E. Bourgogne, L. Pascaud, and J. de Ceaurriz. Gas chromatography-combustion-isotope ratio mass spectrometry analysis of 19-norsteroids: application to the detec- tion of a nandrolone metabolite in urine. J. Chromatogr. B 759: 267-275 (2001).
11. E. Bourgogne, V. Herrou, J.-C. Mathurin, M. Becchi, and J. de Ceaurriz. Detection of exogenous intake of natural corticosteroids by gas chromatography/combustion/isotope ratio mass spec- trometry: application to misuse in sport. Rapid Commun. Spec- trom. 14:2342-2347 (2000).
12. R. Aguilera, T.E. Chapman, and D.H. Catlin. A rapid screening assay for measuring urinary androsterone and etiocholanolone ~313C (%o) values by gas chromatography/combustion/isotope ratio mass spectrometry. Rapid Commun. Spectrom. 14:2294-2299 (2000).
13. D.M. Jones, J.F. Carter, G. Eglinton, E.J. Jumeau, and C.S. Fen- wick. Determination of ~313C values of sedimentary straight chain and cyclic alcohols by gas chromatography/isotope ratio mass spectrometry. BioL Mass. Spec. 20" 641-646 (1991 ).
14. E. Nolteernsting, H. Geyer, U. Mareck-Engelke, W. Sch~nzer, and M. Donike. Standardization of the T/E determination by deuterated internal standards. In Recent advances in Doping Analysis (2), M. Donike, H. Geyer, A. Gotzmann, and U. Mareck-Engelke, Eds. Sport und Buch Strauss, KOln, Germany, 1994, pp 113-120. 15. M. Ferry, J.-C. Mathurin, M. Becchi, and J. de Ceaurriz. Influence
of pregnenolone administration on IRMS analysis. In Recent ad- vances in Doping Analysis (8), M. Donike, H. Geyer, A. Gotzmann, and U. Mareck-Engelke, Eds. Sport und Buch Strauss, K~ln, Ger- many, 2000, pp 209-213.
16. R. Aguilera, T.E. Chapman, B. Starcevic, C.K. Hatton, and D.H. Catlin. Performance characteristics of a carbon isotope ratio method for detecting doping with testosterone based on urine diols: controls and athletes with elevated testosterone/epitestos- terone ratios. Clin. Chem. 47:292-300 (2001).
17. N. Baume, L. Avois, C. Schweizer, C. Cadis, J. Dvorak, M. Caud- era,/, P. Mangin, and M. Saugy. [13C]Nandrolone excretion in trained athletes: interindividual variability in metabolism. Clin. Chem. 50:355-364 (2004).