Compensatory growth feeding strategy does not overcome
negative effects on growth and carcass composition of low birth
weight pigs
J. G. Madsen and G. Bee
†Agroscope, Institute for Livestock Sciences ILS, Posieux 1725, Switzerland
(Received 17 March 2014; Accepted 28 August 2014; First published online 11 November 2014)
The aim of this study was to evaluate whether the compensatory growth feeding strategy could be a suitable solution for overcoming the negative effects on growth, carcass composition and meat quality of low birth weight pigs. Forty-two Swiss Large White barrows from 21 litters were selected at weaning and categorized into either being light (L;> 0.8 and < 1.3 kg) or heavy (H;> 1.7 kg) birth weight pigs. From 27.8 kg BW, pigs were assigned within birth weight group to one of three feeding groups: AA:ad libitumaccess to the grower andfinisher diet, RR: restricted access to the grower and finisher diet or RA: restricted access to the grower diet andad libitumaccess to thefinisher diet. At slaughter, thelongissimus(LM) and semitendinosus(STM) muscles were removed from the right side of the carcass. Weight, girth and length of the STM and the LM area were determined after muscle excision. Carcass characteristics and meat quality traits were assessed. Using mATPase histochemistry, myofibre size and myofibre type distribution were determined in the LM and STM. Because of longer days on feed, total feed intake was greater (P< 0.01) and feed efficiency was lower (P< 0.01) in L than H barrows. Regardless of the birth weight group, AA and RA barrows
grew faster (P< 0.05) than RR barrows. During the compensatory growth period, RA barrows grew faster (P< 0.05) than AA or
RR barrows. Growth efficiency did not differ between RA and RR barrows but was greater (P< 0.05) compared with AA
barrows. Carcasses of L barrows were fatter as indicated by the lower (P⩽ ≤ 0.05) lean meat and greater (P⩽ 0.02) omental and
subcutaneous fat percentage. Lean meat percentage was lower (P⩽ 0.05) in AA and RA than RR barrows. These differences caused
byad libitumfeed access tended to be greater (feeding regime× birth weight group interaction;P< 0.08) in L than H barrows.
In L barrows, slow oxidative, fast oxidative glycolytic and overall average myofibre size of the LM and the fast glycolytic myofibres and overall average myofibre size of the dark portion of the STM were larger (P⩽ 0.03) than in H barrows. The study revealed that
the compensatory growth feeding strategy was inadequate in overcoming the disadvantages of low birth weight.
Keywords: birth weight, carcass quality, compensatory growth, growth efficiency, pig
Implications
Increased litter size has led to a decrease in average litter birth weight, consequently resulting in greater numbers of low birth weight piglets. Compared with their heavier littermates, low birth weight pigs display impaired growth efficiency and greater adipose tissue deposition. Because these traits are of primordial economic importance, low birth weight jeopardize a successful and efficient commercial pig production. The results of the present study revealed that, in order to overcome excessive adipose tissue deposition in the finisher period, low birth weight pigs should have only restricted access to feed.
Introduction
Over the last decade sow’s prolificacy markedly increased and as a consequence average birth weight decreased and displayed greater variability within litter (Quesnel et al., 2008; Campos et al., 2012). Responsible for this outcome are gestational factors such as intrauterine crowding and impaired placental development resulting in insufficient nutrient supply and therefore impaired foetuses development (Foxcroft et al., 2006; Wu et al., 2006). Because piglet’s survival rate during lactation is closely related to their birth weight (Quiniouet al., 2002) and the percentage of piglets weighing< 1 kg increases with increasing litter size (Bérard
et al., 2008; Campos et al., 2012), overall reproduction efficiency in terms of number of weaned piglets and total
†E-mail: [email protected]
weaning weight might be compromised in high prolific sows. In case that low birth weight pigs survive the lactation period and reach the weaning age, there is compelling evidence that impaired foetal development negatively affects postnatal development (Bérard et al., 2008; Beaulieu et al., 2010). Unanimously the results of the aforementioned studies showed that pigs born with a lower birth weight grew slower. In addition, negative relationships between birth weight and carcass fatness (Rehfeldtet al., 2004; Gondret et al., 2006), drip loss (Rehfeldt and Kuhn, 2006) and tenderness (Gondret
et al., 2006; Bérardet al., 2008) were reported.
Compensatory growth, a phenomenon of accelerated growth observed after a period of restricted feed supply has been known for decades. From a meat quality point of view the compensatory response is interesting, because it is believed that this process is mediated through an elevated protein turn over (Oksbjerg and Therkildsen, 2007). An inseparable part of the latter is proteolysis, which is partly regulated by the calpain system (Gollet al., 2008). As reviewed by Huff Lonerganet al.
(2010),µ-calpain and its inhibitor calpastatin play an important role earlypostmortemand by that affect pork quality traits such as drip loss and tenderness. Because low birth weight has been associated with impaired water holding capacity (Rehfeldt and Kuhn, 2006) and tenderness (Gondretet al., 2006; Bérardet al., 2008), the objective of this study was to evaluate whether accelerated growth before slaughter caused by a compensatory growth response could be a suitable feeding strategy to alle-viate the negative impact of low birth weight on pork quality. Material and methods
Experimental design, animals and feeding
The Swiss Federal Committee for Animal Care and Use approved all procedures involving animals. From 21 litters, the lightest (L) and heaviest (H) barrows (Swiss Large White;
n= 42) were selected at weaning. A total of four successive
farrowings, each 3 weeks apart, were needed to obtain the required number of pigs. In three farrowing groups six L and six H offspring and in one farrowing group only three L and three H barrows were selected from six and three sows, respectively. To be included in the study, the birth weight had to be in the range of>0.8 and <1.3 kg and >1.7 kg for L and H barrows, respectively. From weaning (mean ± s.e.; 11.3 ± 1.1 kg BW; 33 ± 6 days of age) to the start of the grower period at 80 ± 4 days of age, barrows were group penned (four to six pigs/pen) and givenad libitumaccess to the starter diet (Table 1). At the start of the grower period, H and L barrows of each farrowing group were moved to the grower–finisher stable and randomly assigned within birth weight group to one of three feeding regimes: AA:ad libitum
access to the grower andfinisher diet, RR: restricted access to the grower andfinisher diet or RA: restricted access to the grower diet and ad libitum access to the finisher diet. In the grower and finisher period, pigs received the same grower andfinisher diet (Table 1). Feed restriction, defined by the amount of feed, was designed to allow an average daily gain of 650 g/day from 27.8 ± 0.7 to 102.1 ± 1.1 kg BW.
As outlined in the Swiss feeding recommendation for pigs (Agroscope Liebefeld Posieux Research Station (ALP), 2012) daily digestible energy (DE) intake was calculated based on the following equation: DE (MJ/day)= −0.37 + 65.23 × (BW/100) −42.89 × (BW/100)2+ 9.43 × (BW/100)4. In the grower andfinisher period, 18 and 24 barrows of the far-rowing group one, two and three, four, respectively, were reared in two group pens (2.9 m2/pig). Each pen was equip-ped with two automatic feeders and individual pig recogni-tion system (Schauer Agrotronic GmbH, Prambachkirchen, Austria) as described previously (Beeet al., 2004). Individual daily feed allowance as well as individual feed intake was monitored and recorded by the control software (MLP; SCHAUER) linked to each feeder. Because estimated DE content of the grower and finisher diet differed, daily and total intake of DE as well as DE energy intake per kg weight
Table 1Composition of the experimental diets, as-fed basis Ingredients (%) Starter diet Grower diet Finisher diet
Barley 28.740 30.000 30.000 Wheat 6.000 20.000 20.000 Oat 5.900 2.300 Corn 47.400 8.400 1.900 Wheat protein 8.300 17.800 Potato protein 8.500 5.900 1.100
Dried sugar beet pulp 1.600 10.000 10.000
Soya meal 0.400 9.300 14.500 Rape meal 2.400 Latibon®Plus ME1 1.424 NaCl 0.432 0.294 0.266 Dicalcium phosphate 1.548 0.482 0.500 Calcium carbonate 1.424 0.526 0.800 L-lysine-HCl (98.5%) 0.528 0.194 0.134 DL-methionine (99.0%) 0.110 0.004 L-threonine (98.5%) 0.148 L-tryptophan (98.0%) 0.070 Pellan2 0.300 0.300 0.300
Vitamin–mineral premix3 0.400 0.400 0.400
Analysed nutrient composition (g/100 g diet (as fed))
DM 89.83 88.98 88.47 CP 15.96 18.87 15.75 Lysine 1.35 1.10 0.90 Methionine 0.39 0.30 0.24 Threonine 0.80 0.68 0.54 Tryptophan 0.25 0.23 0.19 Crude fat 4.38 3.17 2.84 Crudefibre 2.59 4.59 1.38
Calculated energy content
DE (MJ/kg)4 13.14 12.45 12.16
DM= dry matter; DE = digestible energy.
1A multi-acid mixture used to improve acidity and promote antibacterial actions
from foregut to hindgut.
2Binder that aids in pellet formation. 3
Supplied the following nutrients per kg of diet: 20 000 IU vitamin A, 200 IU vita-min D3, 39 IU vitamin E, 2.9 mg riboflavin, 2.4 mg vitamin B6, 0.010 mg vitamin
B12, 0.2 mg vitamin K3, 10 mg pantothenic acid, 1.4 mg niacin, 0.48 mg folic acid,
199 g choline, 0.052 mg biotin, 52 mg Fe as FeSO4, 0.16 mg I as Ca(IO)3, 0.15 mg
Se as Na2Se, 5.5 mg Cu as CuSO4, 81 mg Zn as ZnO2, 15 mg Mn as MnO2. 4
DE content (MJ/kg) calculated from nutrient content (expressed in g/g DM) according to Agroscope Liebefeld Posieux Research Station (ALP) (2012).
of each individual barrow was calculated by multiplying individual feed intake and DE content of the grower and finisher diet, respectively. Barrows were weighed weekly in the morning at 0700 h. Animals were not fasted before weighing. For those with restricted feed access, total daily feed allowance was adjusted weekly based on their indivi-dual BW. The week barrows reached⩾60 kg BW, they were offered thefinisher diet. This was done by using one of the two automatic feeders in the pen for thefinisher diet and limiting the access only to thefinisher pigs. Thus, until all barrows in the pen reached⩾60 kg BW, one feeder was used for the grower and one for thefinisher diet. The day after barrows reached 102 kg BW they were slaughtered. Before slaughter, barrows were fasted for 12 h. Slaughter and carcass dissection were carried out as described previously (Beeet al., 2004).
Tissue sampling and preparation the day of slaughter
Within 30 min after exsanguination, the longissimus (LM) andsemitendinosus(STM) muscles were removed from the right side of each carcass. Weight, girth and length of the STM and the LM area were determined after muscle excision. Muscle samples for histochemical analyses were excised from the centre of the dark portion of the STM (STMdark) and anterior to the 10th rib location of the LM. One piece (1× 1 × 3 cm) of each muscle was immediately fixed on a labelled flat stick, rolled in talcum powder, immediately frozen in liquid nitrogen and stored at –80°C until histo-chemical analyses.
Meat quality traits
One day after slaughter, from the left carcass side two 1.5-cm thick LM chops were cut at the 12thrib level and two slices (∼70 g each) were obtained from the STMdark. From the muscle samples, pH and drip loss percentages were determined. At 30 min (from the right carcass side) and 24-h
postmortem pH of the LM and STM was measured using a WTW pH meter (pH196-S; WTW, Weilheim, Germany) equipped with a WTW electrode (WTW Eb4; WTW) and a temperature probe. Drip loss percentage was measured as the amount of purge formed during storage of chops at 2°C for 24 and 48 h as a percentage of the initial chop weight (Honikel, 1998). After drip loss measurements were assessed, samples were vacuum-packed and stored at − 20°C until Warner–Bratzler shear force was determined. Frozen samples were thawed for 24 h at 2°C, kept at room temperature for 1 h and then weighed. Cooking loss were measured as the amount of purge lost after cooking the chops on a grill plate (190 to 195°C; Beer Grill AG, Zurich, Switzerland) to an internal temperature of 69°C. Shear force was determined on the cooked samples previously cooled to ambient temperature using the original Warner–Bratzler device (model 3000; G-R Electric MFG Co., Manhattan, KS, USA). In the two LM chops, a total of eight cores of 1.27 cm diameter were obtained, whereas the STMdarkwere cut into eight strips of 10× 10 × 50 mm. The maximum shear force
for eight cores or strips per muscle sample, sheared across the fibre direction, was recorded and averaged for each sample.
Histochemical analysis
Histochemical procedures and determination of myofibre size and myofibre type distribution were carried out as described previously (Beeet al., 2004). Briefly, frozen LM and STMdark samples were equilibrated to−25°C, cut from the stick, and trimmed to facilitate transverse sectioning. In order to cut 10-µm-thick sections using a Cryotome (Shandon Inc., Pittsburgh, PA, USA), muscle samples were mounted on a cryostat chuck with a few drops of tissue-freezing medium (Tissue-Tek, Sakura Finetek Europe, Zoeterwoude, The Neth-erlands). Three sections, which were obtained within the muscle samples 30µm apart, were mounted on glass micro-scopic slides and allowed to air-dry for 30 min. Subsequently, sections were treated with a combination of succinic
dehy-drogenase and acid myofibrillar ATPase, according
to the multiple-staining procedure of Solomon and Mon-tgomery (1988). Stained sections were observed under trans-mitted light at a total magnification of 125 × with an Olympus BX50 microscope (Olympus Optical Co., Hamburg, Germany) equipped with a high-resolution digital camera (ColorView12, Soft Imaging System GmbH, Munster, Germany). Based on the staining reaction, myofibres were classified into slow glycoly-tic (SO= dark staining), fast oxidative-glycolytic (FOG = intermediate staining) and fast glycolytic (FG= light stain-ing). One randomfield within each of the three cryo-sections of a slide of each muscle sample was captured with the high-resolution digital camera, and a minimum of 250 myofibres per field (total per muscle sample: >750 myofibres) were analysed with the analySIS 3.0 image analysis software (Soft Imaging System GmbH). To minimize the incidence of mea-suring intrafasicular terminations of myofibres in the LM and STMdark, only myofibres larger than 700 µm2 were included in calculations. Myofibre type distribution was calculated as the percentage of each myofibre type to the total of all myofibres measured.
Myosin heavy chain isoform distribution in the LM muscle
Quantitative real-time PCR (RT-PCR) was performed on seven porcine genes: MyHC embryonic, MyHC perinatal, MyHC slow/ I, MyHC IIA, MyHC IIX, MyHC IIB and β-actin. Each cDNA template for RT-PCR was prepared from mRNA extracted from 50 mg of LM tissue collected within 30 min after exsanguina-tion (Trifast, Peqlab Biotechnologie GmbH, Erlangen, Gemany), byfirst-strand reverse transcription using 0.50 μg of oligo-d(T) (Improm-II reverse transcriptase, Promega, Mannheim, Germany) in a final volume of 20 µl. All used primers and taqman probes (Supplementary Table S1) are published by da Costa et al.(2002). The TaqMan PCR assays for each target gene were performed in triplicate on cDNA templates with a Rotor-Gene 6500 QRT-PCR thermocycler analyser (Corbett Life Science, Sydney, Australia) according to the manufacturer’s recommendations. For each cDNA sample, diluted 1 : 100, an amplification plot was generated, displaying an increase in the reporterfluorescence dye (ΔRn) with each PCR cycle. EachCt
value (threshold cycle) was determined from the mean of three separate RT-PCR experiments. Relative standard curves for each gene were plotted showingCt(y-axis)v.log (initial cDNA) diluted 10-fold sequentially (x-axis). The cDNA used to gen-erate the relative standard curves was from the ST muscle of a barrow not included in the study and slaughtered at a similar age and BW as the experimental animals. When PCR ampli fi-cation is maximally efficient, resulting in a doubling of product in every cycle, the slope will be−3.3 (Medhurstet al., 2000). In the present study, the mean slope of the six genes was − 3.37 ± 0.25.
The relative standard curve method was used to quantify the relative gene expression of embryonic, perinatal, slow/I, IIA, IIX, IIB MyHC isoforms and ofβ-actin as described by da Costaet al.(2002). To correct for variations in the quality and quantity of cDNA templates, all MyHC isoform expres-sion results were normalized to corresponding endogenous β-actin mRNA levels, which within each muscle were not affected by treatment (P⩾ 0.42).
DNA and RNA concentration in the LM and STMdark Muscle samples of the LM and STMdark collected within 30 min after exsanguination were assayed for DNA and RNA concentration as described by Oksbjerg et al. (2000). The DNA content was measuredfluorometrically by a picogreen dsDNA quantitation reagent kit (Quant-iT™ PicoGreen® dsDNA Assay Kit, P7589, Life Technologies Europe B.V., Zug, Switzerland). The RNA was determined fluorometrically using a SybrGreen gel staining kit (SYBR®Green II RNA Gel Stain, S7568, Life Technologies Europe B.V.). The average RNA : DNA ratio within feeding strategy and birth weight group was calculated from the RNA : DNA ratios obtained from each individual muscle sample.
Statistical analysis
Data were analysed with PROC MIXED of SAS (Version 9.1, SAS Institute Inc., Cary, NC, USA) with the individual pig as the experimental unit. The model used for the data analyses of growth performance, carcass characteristics, meat quality traits, histological and RT-PCR data included feeding regime, birth weight group and the feeding regime× birth weight group interaction asfixed effects, and litter of origin as the random effect. For the variables average daily gain, daily and total intake of DE as well as DE energy intake per kg daily gain, pen and initial BW at the start of the grower period was included as fixed factor and covariate, respectively, in the statistical model. Least square means were calculated and the PDIFF option of SAS was used to determine differences between dietary treat-ment groups. Differences were considered as significant if
P< 0.05 and as tending to be significant ifP< 0.10.
Results
Growth performance, carcass characteristics and muscle morphometry
At birth, L barrows were 0.83 kg lighter (P< 0.01) than H
barrows (Table 2). Regardless of the applied feeding strategy
(feeding strategy× birth weight group interaction;P> 0.05), average daily weight gain in the grower–finisher period did not (P= 0.34) differ but total DE intake and, therefore DE
intake per kg weight gain, was greater (P⩽ 0.05) in L than H
barrows. The aforementioned differences resulted from a greater (P⩽ 0.04) daily and total DE intake and impaired
(P< 0.01) DE efficiency in the finisher but not grower period.
Compared with H, daily weight gain from birth to slaughter was lower (P= 0.05) in L barrows and consequently these
pigs were on average 13 days older (P= 0.01) at slaughter.
From the start of the grower period to slaughter, barrows of the AA and RA group grew faster (P< 0.05) than RR
barrows. Because average daily weight gain and average daily intake of DE differed to a similar extent in AA and RA compared with RR barrows, DE efficiency was similar (P> 0.10) in the three feeding groups. During the
compen-satory growth period when feed allowance was switched from restricted to ad libitum, RA barrows grew faster (P< 0.05) than AA or RR barrows despite daily DE intake was
similar (P> 0.10) for barrows withad libitumfeed allowance but greater (P< 0.05) than for RR barrows. In contrast, DE
intake per kg weight gain did not differ between RA and RR barrows but was lower (P< 0.05) than for AA barrows. As
expected, growth rate from birth to slaughter was lower (P< 0.05) in RR compared with AA and RA barrows. The AA
and RA barrows tended (P< 0.10) to be 12 and 9 days
younger at slaughter than RR barrows.
Compared with H barrows, the carcass yield was greater (P< 0.01) in L barrows at the similar (P= 0.14) carcass weight (Table 3). However, their carcasses were fatter as indicated by the lower (P⩽ 0.05) percentage lean meat
including all primal cuts and greater (P⩽ 0.02) percentage
omental and subcutaneous fat. The percentage lean meat and that of the ham and shoulder were lower (P⩽ 0.05) in
AA and RA than RR barrows. These differences tended to be greater (feeding regime× birth weight group interaction;
P⩽ 0.08) in L than H barrows. Regardless of the birth weight,
the STM of RR barrows tended (P< 0.10) to be heavier than
the STM of AA and RA barrows. By contrast, the girth of the STM and the LM area were neither affected by the feeding regimen (P⩾ 0.32) nor the birth weight (P⩾ 0.33).
Meat quality
The impact of birth weight on meat quality traits was limited to the greater (P= 0.05) LM temperature at 30-min post-mortemand greater (P= 0.03; higherb* values) yellowness of the LM of L barrows (Table 4). In addition, 30 min pH tended (P< 0.10) to be greater in the STMdarkof RA com-pared with AA barrows, with intermediate values for RR barrows. Regarding the effect of feeding strategy on pork quality, the LM of RA barrows was lighter (P< 0.05; greater L* value) and more yellow (P= 0.05) than the LM of AA and
RR barrows. Shear force values tended (P< 0.10) to be
greater in both muscles of RR barrows compared with the LM of RA and the STM of AA barrows, respectively. None of the interactions for the pork quality traits were statistically significant.
DNA and RNA concentrations, myofibre characteristics and gene expression of MyHC isoforms in the LM and STMdark The DNA concentration in the LD but not the STMdarktended (P= 0.10) to be lower in L than H barrows (Table 5). The
RNA level and the RNA/DNA ratio in both muscles did not differ between the H and L birth weight group. In the STMdark, but not the LM, barrows of the RR treatment tended (P= 0.07) to have lower RNA levels compared with AA and RA barrows. The DNA concentration and the RNA/DNA ratio in both muscles were similar for AA, RA and RR barrows. In L barrows, the SO, FOG and overall mean size of myofibres of the LM and the FG and overall mean size of myofibres of the STMdarkwere larger (P⩽ 0.03) than in H barrows (Table 6), whereas birth weight had no (P⩾ 0.18) effect on myofibre
type distribution. The feeding regime did neither (P⩾ 0.11)
affect myofibre size nor myofibre distribution, except for the FOG myofibres. The FOG myofibres of the STMdarktended (P< 0.10) to be larger and the percentage of FOG fibres in
the LM tended (P< 0.10) to be greater in RA than in AA and
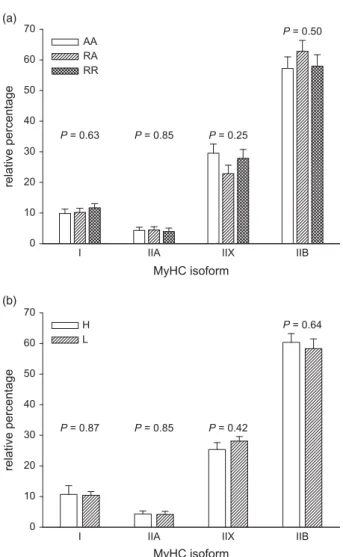
RR barrows, respectively. RT-PCR showed that the highest
mRNA levels were of MyHC IIB followed by IIX, I and IIA (Figure 1a and b). Neither, birth weight group (P⩾ 0.42) nor
feeding regime (P⩾ 0.25) had an impact on relative levels of
MyHC I, IIA, IIX and IIB transcripts. Discussion
Worldwide there is strong economic incentive to increase litter size as well as number of yearly weaned piglets per sow. Improvement of the reproductive performance can only be realized with highly prolific sow lines. The consequence of increased litter size is reduced intrauterine space per foetus, also known as intrauterine crowding, resulting in intrauterine growth retardation and ultimately low birth weight (Bérard
et al., 2010b). Lower birth weight of piglets is not only asso-ciated with reduced likelihood of pre-weaning and nursery survival (Fixet al., 2010) but also impaired growth efficiency and unfavourable carcass characteristics (Rehfeldtet al., 2004; Gondret et al., 2006; Bérardet al., 2008). Because the per-centage of piglets with rather low birth weight increases with
Table 2Effects of three feeding strategies on growth performance of low and high BtW barrows
Feeding strategy1 BtW2 P-values3
AA RA RR L H Pooled s.e. F BtW F× BtW
BtW (kg) 1.50 1.48 1.48 1.07 1.90 0.06 0.95 <0.01 0.92
BW (kg)
Start of the grower period 27.72 27.65 28.00 27.23 28.35 0.72 0.86 0.05 0.06
Start of thefinisher period 64.30 62.42 63.06 63.24 63.28 0.79 0.06 0.95 0.08
The day of slaughter 101.95 102.18 102.31 102.22 102.07 1.15 0.94 0.87 0.90
Daily weight gain (g/day)
Grower period 727b 613a 615a 655 649 27 <0.01 0.74 0.27
Finisher period 836b 967c 715a 871 808 69 <0.01 0.16 0.84
Grower–finisher period 779b 749b 659a 719 739 36 <0.01 0.34 0.51
DE intake( MJ/day)
Grower period 20.6b 18.4a 18.1a 19.1 18.9 0.4 <0.01 0.62 0.55
Finisher period 31.9a 33.4a 25.5b 30.1 30.4 1.8 <0.01 0.80 0.92
Grower–finisher period 49.6b 43.6b 42.6a 46.6 43.9 1.5 <0.01 0.04 0.67
Total DE intake (MJ)
Grower period 1034.4 1042.3 1027.2 1027.8 1041.5 44.9 0.93 0.67 0.54
Finisher period 1447.2 1401.5 1374.7 1458.9 1356.7 47.7 0.22 <0.01 0.74
Grower–finisher period 2482.3 2445.9 2410.4 2493.2 2399.1 67.8 0.41 0.05 0.53
DE intake to gain ratio (MJ/kg)
Grower period 28.3 29.8 29.2 29.1 29.2 0.9 0.12 0.85 0.61
Finisher period 38.3b 35.0a 35.6a 37.5 35.1 1.2 <0.01 <0.01 0.14
Grower–finisher period 33.4 32.8 32.6 33.5 32.3 0.8 0.36 0.01 0.35
Day on feed (day)
Grower period 51a 57b 57b 54 55 3 <0.01 0.60 0.32
Finisher period 46a 43a 54b 50 46 3 <0.01 0.05 0.94
Grower–finisher period 97a 100a 112b 105 101 4 <0.01 0.24 0.43
Overall weight gain (kg/day)4 569b 563b 529a 539 568 20 0.04 0.05 0.62
Age at slaughter (day) 178 181 190 190 177 5 0.07 0.01 0.48
DE= digestible energy.
a,bValues within a row are different if superscript differs (P< 0.05).
1AA=ad libitumaccess to the diet during the growth andfinishing period (n= 14); RA = restricted andad libitumaccess to the diet during the growth and
finishing period, respectively (n= 14); and RR = restricted access to the diet during the growth and finishing period (n= 14).
2H= high BtW (n= 21); L = low BtW (n= 21).
3Probability values for feeding strategies (F), birth weight (BtW) and F× BtW interaction. 4
increasing litter size, overall efficiency of pig production might therefore be lowered. In light of these facts, it seems relevant to evaluate whether alternative feeding strategies might alleviate the reduced production efficiency. The major finding of the present study is that the prenatally imprinted negative characteristics of low birth weight barrows cannot be over-come during postnatal growth by using the compensatory growth strategy in thefinisher period.
Effects of birth weight
In the present study and in line with earlier results (Gondret
et al., 2006; Rehfeldt and Kuhn, 2006; Bérardet al., 2008), impaired growth efficiency in the grower–finisher period became manifested in the greater amount of ingested DE, impaired DE efficiency and more days on feed of L compared with H barrows. As observed by Bérardet al.(2010a), daily weight gain was lower from birth to slaughter but not in the grower–finisher period. This implies that growth rate and consequently age differences at slaughter between the two birth weight groups resulted primarily from the pre- and post-weaning period. During the lactation period, increased milk intake, due to the greater ability of heavier littermates to reach, occupy, stimulate and drain the best performing teats of the dam, results in greater growth and ultimately greater weaning weights (Quiniou et al., 2002). As shown
previously by Bérard et al. (2010a), in the post-weaning period weight gain difference seems to stand because, when placed in collective pens and feed was offered
ad libitum, heavier piglets ingested more DE than lighter piglets. However, interestingly the current results suggested that regardless of the applied feeding strategy, the impact of birth weight decreased with increasing age. However, Gon-dret et al. (2006) reported greater growth rates of high compared with low birth weight pigs not only in the suckling and post-weaning but also in the grower–finisher period. Possible reasons for this discrepancy might be the nutrient composition of thefinisher diet and the rearing conditions. Gondretet al.(2006) used in their experiment afinisher diet, which was richer in CP, crude fat and energy. Furthermore, in their study barrows were reared in individual and not in group pens resulting in an overall greater daily energy intake due to lack of animal to animal interaction. Both factors might have limited full expression of growth potential of the H barrows in the present study.
A consequence of the lower feed efficiency, adipose tissue deposition was greater in L compared with H barrows, which matches results of previous studies (Gondret et al., 2005). Gondret et al. (2006) found elevated lipogenic enzyme activities, greater lipid content and larger adipocytes in the adipose tissue of low compared with high birth weight
Table 3Effects of three feeding strategies on carcass characteristics and morphometric muscle measurements of low and high BtW barrows
Feeding strategy1 BtW2 P-values3
AA RA RR L H Pooled s.e. F BtW F× BtW
Carcass yield (%) 80.5 80.8 79.5 80.8 79.7 0.6 0.09 <0.01 0.87
Hot carcass weight (kg) 82.0 82.5 81.4 82.6 81.3 1.0 0.53 0.14 0.79
Cold loss (%)4 2.1 2.6 2.3 2.3 2.3 0.4 0.39 0.96 0.72 Lean percentage (%)5 54.9a 55.4a 56.7b 54.9 56.5 0.7 0.01 <0.01 0.07 Loin (%) 24.9 25.4 25.8 25.0 25.8 0.5 0.15 0.05 0.18 Ham (%) 17.7ab 17.6a 18.1b 17.6 18.0 0.2 0.05 0.02 0.08 Shoulder (%) 12.3a 12.3a 12.7b 12.2 12.6 0.2 0.04 0.02 0.05 Belly (%) 16.7 16.6 16.3 16.7 16.4 0.6 0.65 0.39 0.45 Omental fat (%)6 1.8b 1.8b 1.5a 1.8 1.6 0.1 0.02 0.02 0.07 Subcutaneous fat (%)7 14.3ab 14.8b 13.7a 14.9 13.7 0.5 0.04 <0.01 0.15 Backfat (mm)8 20b 21b 17a 20 18 2 0.01 0.09 0.80 Belly (mm)9 18b 18b 16a 18 16 2 0.04 0.02 0.30 Morphometric measurements
Longissimus muscle area (cm2) 53.9 52.6 54.3 54.5 52.7 2.8 0.73 0.33 0.68
Semitendinosus muscle
Weight (g) 416 397 428 414 414 13 0.07 0.96 0.11
Length (mm) 199 219 212 209 211 14 0.32 0.82 0.47
Girth (mm) 203 205 208 205 206 4 0.45 0.70 0.82
a,bValues within a row are different if superscript differs (P< 0.05). 1
AA=ad libitumaccess to the diet during the growth andfinishing period (n= 14); RA = restricted andad libitumaccess to the diet during the growth andfinishing period, respectively (n= 14); and RR = restricted access to the diet during the growth and finishing period (n= 14).
2H= high BtW (1.94 kg;n= 21); L = low BtW (1.07 kg;n= 21).
3Probability values for feeding strategies (F), birth weight (BtW) and F× BtW interaction. 4Weight loss of the hot carcass during cooling at 2°C for 24 h.
5Sum of denuded shoulder, back and ham weights as percentage of cold carcass weight. 6Omental fat weight expressed as percentage of cold carcass weight.
7
Sum of external fat from the shoulder, back and ham expressed as percentage of cold carcass weight.
8Backfat thickness determined at the 10thrib location. 9
female pigs slaughtered at the same weight. Interestingly, at day 75 of gestation it appears that differentiation of adipose tissue and maintenance of preadipocyte state depends on foetal development as mRNA levels of preadipocyte-related
genes were greater in the subcutaneous backfat of small compared with large foetuses (Gondretet al., 2011). In line with these observations, small piglets did possess more adipocytes than their normal-sized and large siblings on
Table 4Effects of three feeding strategies on meat quality traits of the longissimus muscle and dark portion of the semitendinosus muscle of low and high BtW barrows
Feeding strategy1 BtW2 P-values3
AA RA RR L H Pooled s.e. F BtW F× BtW Longissimus muscle pH (30 min) 6.2 6.1 6.1 6.1 6.1 0.1 0.40 0.56 0.58 pH (24 h) 5.5 5.5 5.5 5.5 5.5 0.1 0.60 0.53 0.57 Temperature (30 min) 37.1 37.8 37.6 37.8 37.2 0.4 0.18 0.05 0.40 L*4 50.7a 52.7b 50.5a 51.4 51.2 0.8 0.02 0.70 0.47 a*4 6.5 6.2 5.9 6.4 6.0 0.4 0.33 0.18 0.82 b*4 3.1ab 3.3b 2.6a 3.2 2.8 0.3 0.05 0.03 0.97 Drip loss (24 h, % ) 4.5 4.4 4.4 4.3 4.5 1.1 0.99 0.81 0.53 Drip loss (48 h, %) 5.5 5.6 5.6 5.3 5.8 1.2 0.99 0.54 0.27 Cooking loss (%) 20.3 19.9 20.0 19.7 20.5 0.8 0.91 0.18 0.42 Shear force (kg) 4.1 3.9 4.3 4.0 4.2 0.2 0.08 0.30 0.70
Dark portion of thesemitendinosus
pH (30 min) 6.0 6.2 6.1 6.1 6.1 0.1 0.06 0.23 0.07 Temperature (30 min) 37.7 37.9 38.5 38.0 38.1 0.4 0.17 0.62 0.25 pH (24 h) 5.7 5.7 5.7 5.7 5.7 0.1 0.60 0.90 0.64 L*4 41.8 42.6 43.3 42.2 42.9 0.8 0.19 0.33 0.78 a*4 15.6 14.4 14.8 14.7 15.1 0.8 0.26 0.56 0.67 b*4 5.8 6.0 5.7 5.8 5.8 0.3 0.58 0.97 0.40 Drip loss (24 h, %) 3.8 4.3 4.1 4.0 4.2 0.5 0.62 0.58 0.33 Drip loss (48 h, %) 4.8 5.6 5.1 5.0 5.3 0.8 0.53 0.50 0.55 Cooking loss (%) 19.9 19.6 20.6 19.8 20.2 0.9 0.55 0.55 0.93 Shear force (kg) 4.0 4.5 4.7 4.2 1.6 0.3 0.09 0.13 0.21
a,bValues within a row are different if superscript differs (P< 0.05). 1
AA=ad libitumaccess to the diet during the growth andfinishing period (n= 14); RA = restricted and ad libitum access to the diet during the growth and finishing
period, respectively (n= 14); and RR = restricted access to the diet during the growth and finishing period (n= 14).
2
H= high BtW (1.94 kg;n= 21); L = low BtW (1.07 kg;n= 21).
3Probability values for feeding strategies (F), birth weight (BtW) and F× BtW interaction. 4L
*= a measure of darkness to lightness (higherL* values indicates a lighter colour);a*= a measure of redness (highera* value indicates a redder colour); andb*= a measure of yellowness (higherb* value indicates a more yellow colour).
Table 5Effect of three feeding strategies on the DNA and RNA concentration as well as RNA : DNA ratio determined in the longissimus muscle and dark portion of the semitendinosus muscle of low and high BtW barrows
Feeding strategy1 BtW2 P-values3
AA RA RR L H Pooled s.e. F BtW F× BtW
Longissimus muscle
DNA (ng/mg) 34.3 33.8 32.0 30.2 36.5 5.8 0.86 0.10 0.84
RNA (ng/mg) 83.1 90.7 79.3 76.9 91.9 14.6 0.65 0.14 0.53
RNA : DNA ratio4 2.94 3.01 3.02 3.02 2.96 0.64 0.99 0.90 0.50
Dark portion of thesemitendinosus muscle
DNA (ng/mg) 47.9 48.7 42.8 45.8 47.2 5.4 0.43 0.73 0.99
RNA (ng/mg) 105.8 90.8 79.1 88.5 95.3 11.3 0.07 0.47 0.11
RNA : DNA ratio4 2.61 1.97 2.07 2.17 2.26 0.54 0.37 0.81 0.27
1AA=ad libitumaccess to the diet during the growth andfinishing period (n= 14); RA = restricted andad libitumaccess to the diet during the growth andfinishing
period, respectively (n= 14); and RR = restricted access to the diet during the growth and finishing period (n= 14).
2H= high BtW (1.94 kg;n= 21); L = low BtW (1.07 kg;n= 21).
3Probability values for feeding strategies (F), birth weight (BtW) and F× BtW interaction. 4
postnatal day 7 (Williamset al., 2009), and a greater density of small-sized adipocytes on postnatal day 14 when com-pared with controls (Attiget al., 2008). The latter indicates greater proliferation of fat cells in low birth weight pigs as an adaptive phenomenon designed to improve long-term capacity for lipid storage, for example, during the lactation period, where feed supply is restricted. However, after weaning feed was availablead libitumand previous fat cell hyperplasia promoted excess adiposity. In the current study, fat cell number was not assessed but the observed greater adiposity of the L barrows might be explained by the afore-mentioned mechanism.
The greater percentage of adipose tissue in low compared with high birth weight pigs might also be due to differences in pre- and postnatal muscle development (Rehfeldt and Kuhn, 2006). Ward and Stickland (1991) concluded that in pigs myofibre hyperplasia is completed by day 90 of gestation, whereas recent data suggest that naturally or due to dietary interventions a certain increase in myofibre number occur within thefirst weeks of life (Löselet al., 2009; Bérardet al., 2011). Nevertheless, the available data unequivocally show that at birth low birth weight pigs have fewer myofibres but of greater size compared with their higher birth weight littermates (Pardoet al., 2013). In this study, mean myofibre size was 15 and 10% greater in the LM and STMdark, respectively, in L barrows but no morphometric changes in muscle characteristics
were observed. This leads to the assumption that the two muscles of L barrows contained fewer myofibres at slaughter. Thesefindings confirm previous observations suggesting that differences at least in myofibre number and size at birth persist until the day of slaughter (Gondretet al., 2006). Thus, during postnatal growth maximal myofibre hypertrophy might be attained earlier in low compared with high birth weight pigs and therefore, as suggested by Rehfeldt and Kuhn (2006), dietary energy cannot longer be used for muscle protein accretion but will be diverted to adipose tissue accretion. In accordance, indicators of satellite cell proliferation and of pro-tein synthesis capacity were lower in the LD (by trend for DNA and numerically for RNA) in L than H pigs.
Meat quality traits were only marginally affected by birth weight, which confirms results of other experiments (Bérard
et al., 2008 and 2010a; Beaulieu et al., 2010). However, others observed greater drip loss (Rehfeldt and Kuhn, 2006) and lower sensory scores for tenderness (Gondret et al., 2006) in meat from low birth weight pigs. Using crossbred (Large White× Landrace) sows and pure Piétrain boars, Gondret et al. (2006) reported a negative relationship (−0.338) between average myofibre size of the LM and tenderness scores, whereas in the present study in both muscles no significant relationships were detected between shear force values and the SO, FOG, FG and overall mean myofibre size. A possible explanation for the contradictory
Table 6Effects of three feeding strategies on myofibre area and myofibre type distribution in the longissimus muscle and dark portion of the semitendinosusmuscle of low and high BtW barrows
Muscle and myofibre type
Feeding strategy1 BtW2 P-values3
AA RA RR L H Pooled s.e. F BtW F× BtW
Myofibre area (m2)
Longissimus dorsi muscle
SO 2665 2921 2693 2958 2561 168 0.22 < 0.01 0.55
FOG 2475 2522 2352 2672 2227 256 0.75 0.03 0.20
FG 4076 4206 3919 4281 3853 378 0.70 0.14 0.36
Overall mean 3104 3269 3059 3361 2927 212 0.56 0.01 0.30
Dark portion of thesemitendinosus muscle
SO 4683 4937 4752 4975 4605 343 0.79 0.23 0.43
FOG 3949 4525 4346 4393 4154 207 0.06 0.22 0.33
FG 4858 5762 5319 5730 4896 364 0.12 0.02 0.13
Overall mean 4501 5057 4793 5018 4549 243 0.16 0.05 0.17
Myofibre type distribution4
Longissimus dorsi muscle
SO 8.84 6.88 6.71 8.22 6.74 1.60 0.22 0.18 0.46
FOG 16.51 18.76 15.00 16.17 17.35 1.99 0.06 0.35 0.46
FG 74.05 74.22 77.67 75.11 75.52 2.12 0.11 0.80 0.30
Dark portion of thesemitendinosus muscle
SO 43.25 41.34 42.01 43.11 41.30 3.24 0.87 0.55 0.20
FOG 28.36 30.45 27.55 29.04 28.53 2.05 0.49 0.79 0.36
FG 28.39 28.21 30.44 27.85 30.17 2.14 0.58 0.25 0.05
SO= slow oxidative; FOG = fast oxidative-glycolytic; FG = fast glycolytic.
1AA=ad libitumaccess to the diet during the growth andfinishing period (n= 14); RA = restricted andad libitumaccess to the diet during the growth andfinishing
period, respectively (n= 14); and RR = restricted access to the diet during the growth and finishing period (n= 14).
2
H= high BtW (1.90 kg;n= 21); L = low BtW (1.07 kg;n= 21).
3Probability values for feeding strategies (F), birth weight (BtW) and F× BtW interaction.
findings could be that regardless of birth weight, average myofibre size was 53% smaller in the current compared with the study of Gondretet al.(2006) (6643v.3144µm2). Thus, the impact of birth weight might differ depending on myo-fibre size, the latter being markedly different among breeds.
Effects of compensatory growth feeding strategy
As expected, in thefinisher period fastest growth rate was observed in RA barrows. When compared with RR barrows, compensatory growth of RA barrows appeared to be linked to greater muscle protein synthesis because RNA levels were greater in the STMdarkby trend and were numerically greater in the LD. Despite lacking statistical significance, the present data are in agreement with results reported by
Oksbjerget al. (2002). Interestingly, for the growth perfor-mance traits there was no feeding strategy× birth weight category interaction indicating that the compensatory growth effect was similar for L and H pigs. In thefinishing phase, a period known to exhibit increased fat deposition rate especially in barrows, lower feed efficiency corroborates with the lower carcass lean meat percentage of RA and AA pigs. The fact that low birth weight pigs have fewer adipo-cytes present for lipid filling (Attig et al., 2008; Williams
et al., 2009) might explain that ad libitum feed access exhibited to a greater extent the full expression of lipogenic potential and ultimately fat growth in low compared with high birth weight littermates. On the other hand, restricted feed access and consequently lower dietary energy intake prevented excessive adipose tissue accumulation as carcass composition of low and high birth weight littermates displayed a comparable percentage of lean and adipose tissue. Therefore, as far as body composition and feed effi-ciency are considered, one could conclude that restricting dietary energy intake is the feeding strategy of choice for low birth weight pigs.
Acknowledgements
The authors would like to thank Bernard Dougoud and Guy Maikoff for their excellent technical assistance.
Supplementary material
To view supplementary material for this article, please visit http://dx.doi.org/10.1017/S1751731114002663
References
Agroscope Liebefeld Posieux Research Station (ALP) 2012. Fütter-ungsempfehlungen und Nährwerttabellen für Schweine 3 Lehrmittel Zentrale, Zollikofen, Switzerland.
Attig L, Djiane J, Gertler A, Rampin O, Larcher T, Boukthir S, Anton PM, Madec JY, Gourdou I and Abdennebi-Najar L 2008. Study of hypothalamic leptin receptor expression in low-birth-weight piglets and effects of leptin supple-mentation on neonatal growth and development. American Journal of Physiol-ogy– Endocrinology and Metabolism 295, E1117–E1125.
Beaulieu AD, Aalhus JL, Williams NH and Patience JF 2010. Impact of piglet birth weight, birth order, and litter size on subsequent growth performance, carcass quality, muscle composition, and eating quality of pork. Journal of Animal Sci-ence 88, 2767–2778.
Bee G, Guex G and Herzog W 2004. Free-range rearing of pigs during the winter: adaptations in musclefiber characteristics and effects on adipose tissue com-position and meat quality traits. Journal of Animal Science 82, 1206–1218. Bérard J, Kreuzer M and Bee G 2008. Effect of litter size and birth weight on growth, carcass and pork quality, and their relationship to postmortem proteolysis. Journal of Animal Science 86, 2357–2368.
Bérard J, Kreuzer M and Bee G 2010a. In large litters birth weight and gender is decisive for growth performance but less for carcass and pork quality traits. Meat Science 86, 845–851.
Bérard J, Pardo CE, Bethaz S, Kreuzer M and Bee G 2010b. Intra-uterine crowding decreases average birth weight and affects musclefiber hyperplasia in piglets. Journal of Animal Science 88, 3242–3250.
Bérard J, Kalbe C, Lösel D, Tuchscherer A and Rehfeldt C 2011. Potential sources of early-postnatal increase in myofibre number in pig skeletal muscle. Histochemistry and Cell Biology 136, 217–225.
Campos P, Silva B, Donzele J, Oliveira R and Knol E 2012. Effects of sow nutrition during gestation on within-litter birth weight variation: a review. Animal 6, 797–806.
MyHC isoform
I IIA IIX IIB
relative percentage 0 10 20 30 40 50 60 70 AA RA RR P = 0.63 P = 0.85 P = 0.25 P = 0.50 (a) MyHC isoform
I IIA IIX IIB
relative percentage 0 10 20 30 40 50 60 70 H L P = 0.87 P = 0.85 P = 0.42 P = 0.64 (b)
Figure 1 Relative mRNA expression of myosin heavy chain (MyHC) isoform I, IIA, IIX and IIB determined in thelongissimus dorsi muscles. Panel a depicts the results of the three feeding strategies (AA= ad libitum access to the diet during the grower–finisher period (n = 14); RA= restricted and ad libitum access to the diet during the grower and finisher period, respectively (n = 14); and RR = restricted access to the diet during the grower–finisher period (n = 14)) and panel b depicts the results of the high (H= 1.94 kg BW; n = 21) and low (L = 1.07 kg BW; n= 21) birth weight group. Columns and error bars represent least squares means and s.e. TheP-values reported for each isoform represent the effect of feeding strategy (a) and birth weight (b). Feeding× birth weight interaction was not significant.
da Costa N, Blackley R, Alzuherri H and Chang KC 2002. Quantifying the tem-porospatial expression of postnatal porcine skeletal myosin heavy chain genes. Journal of Histochemistry & Cytochemistry 50, 353–364.
Fix JS, Cassady JP, Holl JW, Herring WO, Culbertson MS and See MT 2010. Effect of piglet birth weight on survival and quality of commercial market swine. Livestock Science 132, 98–106.
Foxcroft GR, Dixon WT, Novak S, Putman CT, Town SC and Vinsky MDA 2006. The biological basis for prenatal programming of postnatal performance in pigs. Journal of Animal Science 84, E105–E112.
Goll DE, Neti G, Mares SW and Thompson VF 2008. Myofibrillar protein turn-over: the proteasome and the calpains. Journal of Animal Science 86, E19–E35. Gondret F, Lefaucheur L, Juin H, Louveau I and Lebret B 2006. Low birth weight is associated with enlarged musclefiber area and impaired meat tenderness of the longissimus muscle in pigs. Journal of Animal Science 84, 93–103. Gondret F, Perruchot MH, Tacher S, Bérard J and Bee G 2011. Differential gene expressions in subcutaneous adipose tissue pointed to a delayed adipocytic differentiation in small pig fetuses compared to their heavier siblings. Differ-entiation 81, 253–260.
Gondret F, Lefaucheur L, Louveau I, Lebret B, Pichodo X and Le Cozler Y 2005. Influence of piglet birth weight on postnatal growth performance, tissue lipogenic capacity and muscle histological traits at market weight. Livestock Production Science 93, 137–146.
Honikel KO 1998. Reference methods for the assessment of physical characteri-stics of meat. Meat Science 49, 447–457.
Huff Lonergan E, Zhang W and Lonergan SM 2010. Biochemistry of postmortem muscle– lessons on mechanisms of meat tenderization. Meat Science 86, 184–195.
Lösel D, Kalbe C and Rehfeldt C 2009.L-Carnitine supplementation during
suckling intensifies the early postnatal skeletal myofiber formation in piglets of low birth weight. Journal of Animal Science 87, 2216–2226.
Medhurst AD, Harrison DC, Read SJ, Campbell CA, Robbins MJ and Pangalos MN 2000. The use of TaqMan RT-PCR assays for semiquantitative analysis of gene expression in CNS tissues and disease models. Journal of Neuroscience Methods 98, 9–20.
Oksbjerg N and Therkildsen M 2007. Compensatory growth in pigs: effects on performance, protein turnover and meat quality. In Paradigms in pig science (ed. J Wiseman, MA Varley, S McOrist and B Kemp), pp. 417–426. Nottingham University Press.
Oksbjerg N, Sorensen MT and Vestergaard M 2002. Compensatory growth and its effect on muscularity and technological meat quality in growing pigs. Acta Agriculturae Scandinavica Section A-Animal Science 52, 85–90.
Oksbjerg N, Petersen JS, Sorensen IL, Henckel P, Vestergaard M, Ertbjerg P, Moller AJ, Bejerholm C and Stoier S 2000. Long-term changes in performance and meat quality of Danish Landrace pigs: a study on a current compared with an unimproved genotype. Animal Science 71, 81–92.
Pardo CE, Bérard J, Kreuzer M and Bee G 2013. Intrauterine crowding in pigs impairs formation and growth of secondary myofibers. Animal 7, 430–438. Quesnel H, Brossard L, Valancogne A and Quiniou N 2008. Influence of some sow characteristics on within-litter variation of piglet birth weight. Animal 2, 1842–1849. Quiniou N, Dagorn J and Gaudré D 2002. Variation of piglets' birth weight and consequences on subsequent performance. Livestock Production Science 78, 63–70. Rehfeldt C and Kuhn G 2006. Consequences of birth weight for postnatal growth performance and carcass quality in pigs as related to myogenesis. Journal of Animal Science 84, E113–E123.
Rehfeldt C, Kuhn G, Fiedler I and Ender K 2004. Musclefiber characteristics are important in the relationship between birth weight and carcass quality. Journal of Animal Science 82 (suppl.1), 250.
Solomon MB and Montgomery AR 1988. Comparison of methods for quantifying fiber types in skeletal muscle tissue. Journal of Food Science 53, 973–974. Ward SS and Stickland NC 1991. Why are slow and fast muscles differentially affected during prenatal undernutrition? Muscle Nerve 14, 259–267. Williams PJ, Marten N, Wilson V, Litten-Brown JC, Corson AM, Clarke L, Symonds ME and Mostyn A 2009. Influence of birth weight on gene regulators of lipid metabolism and utilization in subcutaneous adipose tissue and skeletal muscle of neonatal pigs. Reproduction 138, 609–617.
Wu G, Bazer FW, Wallace JM and Spencer TE 2006. Board-invited review: intrauterine growth retardation: implications for the animal sciences. Journal of Animal Science 84, 2316–2337.