Journal of Antimicrobial Chemotherapy (1989) 24, 797-803
Long term accuracy of fluorescence polarization
immunoassays for gentamidn, tobramydn, netilmidn
and vancomydn
Beda Joos, Roedi Lfithy and Jflrg Blaser
Division of Infectious Diseases, Department of Medicine, University Hospital, CH-8091 Zurich, Switzerland
External quality control was performed during six years to determine the accuracy over time of the Abbott TDx fluorescence polarization system for assaying anti-biotics. Unknown spiked serum samples of gentamicin, tobramytin, netilmicin and vancomycin were provided monthly by the British national external quality assess-ment scheme. Comparison of the 209 assay results with the target concentrations showed good correlations in all four assays. No significant deviations from linearity, from slope 10, and from intercept 00 were detected by regression analysis. Relative deviations were < 10% and < 15% for 78% and 90% of all specimens, respect-ively. On an average the same calibration curves could be used over a period of 19 weeks . Fluorescence polarization immunoassays provided rapid and reliable results over the entire study period.
Introduction
The aminoglycosides and vancomycin are the most frequently assayed antibiotics in clinical practice (Wenk, Vozeh & Follath, 1984). Monitoring is mandatory due to their low therapeutic index and poor predictability of serum concentrations. Thus reliable determinations of serum levels are essential to optimize individual dosage regimens. Fluorescence polarization immunoassays are widely used to analyse clinical specimens. The principle of these competitive binding immunoassays (Jolley etaJ., 1981a) and of the automated fluorescence polarization analyser (Popelka etal., 1981) as well as performance in comparison with other assay methods (Jolley etal., 1981fc) have been previously described.
An external quality control was performed over a six year period, to determine the accuracy of the Abbott TDx fluorescence polarization system for assaying antibiotics, supplement internal quality control procedures, study possible changes in the quality of performance over time, and to recognize and minimize systematic errors.
Materials and methods Specimens
Human serum samples, each spiked with one antibiotic, were obtained monthly from the British national external quality assessment scheme (NEQAS), antibiotic assays section (Department of Medical Microbiology, Southmead Hospital, Bristol, UK).
797
798 B. Joos et al
Specimens were available for the following antibiotics and time periods: gentamicin (number of samples, n = 62) and tobramycin (n = 61), November 1982 to October 1988; netilmicin (n = 38), since February 1985; vancomycin (n = 48), since February 1984. The total number of analyses of patient samples for all four antibiotics increased from 5000 to 15,000 per year during the study period.
Assays
The unknown specimens were treated in exactly the same manner as routine samples. No replicate analyses were performed. Results were reported immediately to the Antibiotic Assay Quality Control Section, Southmead Hospital. Target values were not known before receipt of the subsequent specimen distribution. Assays were done on an Abbott TDx analyser using reagent kits obtained from Abbott, Switzerland. Assays were calibrated using standard solutions, also supplied by Abbott, according to kit protocols. Three control sera containing 1, 4, and 8 mg/1 of an aminoglycoside or 7, 35, and 75 mg/1 of vancomycin were run periodically to validate the actual calibration curve. Deviations of 10% from the intermediate and high, and of 15% from the low concentration were permitted in this internal control. Reagents, calibrators, and controls were stored in accordance with the manufacturers recommendations.
Statistical evaluation
The sets of data were evaluated by least squares linear regression, by standardized principal component analysis (Feldmann etal., 1981), and by the distribution indepen-dent regression procedure of Passing & Bablok (1983, 1984). Outliers were not eliminated. Linearity was tested by using the cusum-test and the run-test (test for randomness) after sorting projections of the data points along the regression line (Passing & Bablok, 1983). The same two tests were used to assess whether the deviations were randomly distributed over time.
Results Regression analysis
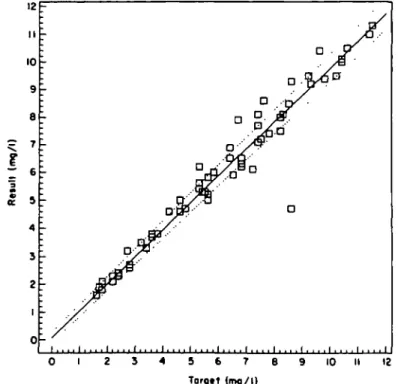
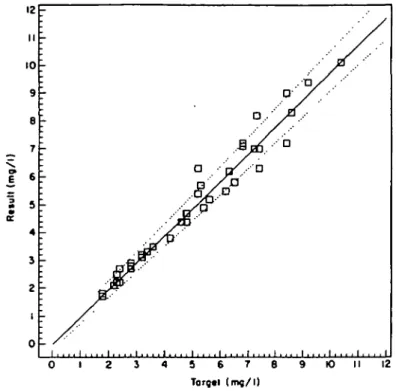
Figures 1 to 4 show concentrations of the four antibiotics measured by fluorescence polarization immunoassays plotted against the corresponding target values and the estimated regression parameters by the method of Passing & Bablok (1983). No significant deviations from slope = 1-0 and intercept = OK) and no significant devia-tion from linear reladevia-tionship were detected for each drug. Ninety-five percent confi-dence intervals of slopes were from 0-978 to 1-061 for gentamicin, 0-940 to 1-000 for tobramycin, 0-929 to 1-033 for netilmicin, 0-959 to 1-078 for vancomycin, and 0-995 to 1-024 for the joined data. For the intercepts the 95% confidence limits were within -0-21 and 0-28 mg/1 for the aminoglycosides and from —1-08 to 1-38 mg/1 for vanco-mycin.
All slopes and intercepts estimated by the standardized principal component analyses (slopes from 0-979 to 1-024) and by linear least squares regressions (slopes 0-950 to 1-004) ranged within the 95% confidence limits obtained from the corresponding Passing & Bablok regression. Coefficients of correlation were > 0-97 in each evalu-ation.
Accnracy of antibiotic assays 799
5 6 7 S Torgat (mg/l)
10
Figure 1. Gentamidri results plotted against tbe respective target values in 62 spiked serum samples during a six year period. Correlation coefficient - O98; , y = 0200+ 1-OOOJT, , 95% confidence limits.
4 5 6 7 8 9 10 II 12
Torgtt (mg/l)
Figure 2. Tobramydn results of 61 specimens obtained over a six year period. Correlation coeffident -097; , y «. O067 + 0972* . . . 95% confidence limits.
800 B. Joos et aL 12 II 10 9 8 7 (mg/ l
i s
IT 4 3 2 1 0 - '-~r ' -1 j-: f\ J
i . . , . i . . . . i .•-0'
. . i . . , . i . . . . i . . . . i . . . . i . , . . i . . . . i . . . . i . . . . i . . . . i 5 6 7 6 Target (mg/l) K) II 12Figure 3. Netihnkin results of 38 specimens obtained over a four year period. Correlation coefficient
O982; , y = -(M)33 + (W78;r, 95% confidence limits.
7 0 6 0 5 0 5 40
r
I 30 a. 2 0 10 0-: sgT
i . . . . i . . . . i . . . . i . . . . i . . . . i . . , . i . . . . i 10 20 30 40 50 6 0 70 Targtt (mg/l)Fignre 4. Vancomydn results of 48 specimens obtained over a five year period Correlation coefficient (W82; , y - - 0 - 1 3 6 + 1-019JT, . . . 95V. confidence limits.
Accuracy of antibiotic assays 801 g. c 5
1
$
jla l 100 90 eo 70 60 50 40 3 0 20 10 0 -— -_ #•" . i y //'^ " it' / --V ,' / ' ' / / ' i i" .-•' / . • ' (' •if
• i11 -; . . . i . . . . i . ^....f V !.«.-:==SS. . . . 1 , , . . 1 . . . . 1 . . • . 1 10 IS 20 |R«loli»« dtviationj (%) 25 30Ftgntc 5. Accuracy of the fluorescence polarization tmmunoassays plotted as cumulative frequency of
positive or negative deviations given in percent of the target concentrations. , Gentamicin; , tobramycin; —. — .—, netihnicin; . . . vancomyem.
Absolute deviations
Differences between individual assay results and the corresponding target values ranged from —0-6 to + 2-4 mg/1 with gentamicin, — 3-9 to +1-2 mg/1 with tobramycin, —1-2 to
+ 1-1 mg/1 with netilmicin, and —8-3 to +6-8 mg/1 with vancomycin. For each of the aminoglycosides 50% of the absolute deviations did not exceed 0-2 mg/1 and 90% of the differences were 0-7 mg/1 or less, while 50% and 90% of the vancomycin results deviated at most by 1-2 and 41 mg/1, respectively.
Relative deviations
Positive or negative deviations of less than 10% were observed in 79%, 85%, 82%, and 63% of all gentamicin, tobramycin, netilmicin, and vancomycin results, respectively (Figure 5). Deviations from target concentrations were less than 15% in 90%, 90%, 97%, and 81% of the respective results. In 206 of the 209 samples (98-6%) relative differences ranged from - 1 5 % to +21%. Deviations of +32%, +36%, and - 4 5 % were obtained in the other three samples. Retrospective reanalyses of these three samples were close to the target values (—6% to +11% deviations), despite two to three years storage at — 20°C.
Time series
Deviations were arranged consecutively in each data set and subjected to cusum- and run-tests. The runs up and down of increasing or decreasing relative differences were
802 B. Joos et aL
randomly distributed over time for each antibiotic. Testing for the sequence of observations above and below the target values showed no systematic deviation from randomness for tobramycin and netilmicin. A lack of randomness was detected by this evaluation for gcntamicin and vancomycin, because the gentamicin results contained 12 consecutive values above the target and vancomycin had series of eight values on either side.
Standard curve
The stability of the calibration curves was analysed over the last two years of the study period. Three spiked sera were analyzed per drug and week as internal controls. On an average, recalibrations were needed every 17, 21, 26, and 13 weeks for gentamicin, tobramycin, netilmicin, and vancomycin, respectively.
Discussion
External quality control is the most stringent way of testing the accuracy of an assay procedure. Blind analysis and immediate reporting of the results truly reflects the everyday situation in a clinical laboratory. The present study covered all potential laboratory errors which might possibly occur during handling and analysing of specimens and reporting of the results.
Comparison of fluorescence polarization immunoassay results with the corres-ponding target concentrations snowed good agreement for gentamicin, tobramycin, netilmicin, and vancomycin. Linear regression analyses performed,by conventional least squares regression and by standardized principal component analysis revealed almost identical slopes and intercepts. However, these regression techniques may not be optimal to analyse the experimental data. In contrast to the standard procedures, the method suggested by Passing & Bablok (1983) does not rely on the assumption of a normal distribution of either the measured values or the errors, and the result is not markedly influenced by extreme outliers. Nevertheless, the slopes and intercepts estimated by least squares regression and by standardized principal component analysis were within the confidence limits of the regression parameters as defined by Passing & Bablok (1983).
External quality controls on a voluntary basis are no substitute for frequent internal controls, required for immediate detection of methodological problems. According to the recommendations of the manufacturer deviations of 10% to 15% were tolerated for the internal controls, which appears adequate for therapeutic drug monitoring. The deviations from target values of the blind external quality assessment were within the error limits of the open internal controls for the great majority of specimens. Only in two instances the assay result was wrong to the extent that a different dosage recommendation would have been suggested. Errors attributable to preparation of the spiked specimens or to alterations during shipment never became obvious in this evaluation. Retrospective reanalyses of extreme outliers confirmed the target concen-trations.
Calibration curves were usually valid for several months. Major reasons for recalib-ration were optical or mechanical realignment of the apparatus during routine main-tenance or changes in reagent lots. In order to minimize the latter problem it is our policy to keep sufficient stock of reagents of identical lots. The need for more frequent
Accuracy of antibiotic assays 803 recalibrations with vancomycin than with the aminoglycosides may be attribu-table to the inferior stability of this compound at room temperature. For the three aminoglycosides the length of calibration-free intervals was increased with increased numbers of specimens analyzed. Thus performance appears to be improved when reagent packs are used up within a short time after opening.
In conclusion, the Abbott TDx fluorescence polarization immunoassays for genta-micin, tobramycin, netilmicin and vancomycin provided reliable results in this long term external quality assessment.
Acknowledgements
We are grateful to Mr M. J. Bywater and Dr D. S. Reeves from the Southmead Hospital, Bristol, UK, for providing us regularly with quality assurance specimens. We thank F. Einodter and I. Vincens for excellent technical assistance.
These results were presented in part at the 28th Interscience Conference on Antimic-robial Agents and Chemotherapy, Los Angeles, October 23-26, 1988.
References
Feldmann, U., Schneider, B., Kiinkers, H. & Haeckel, R. (1981). A multivariate approach for the biometric comparison of analytical methods in clinical chemistry. Journal of Clinical Chemistry and Clinical Biochemistry 19, 121-37.
Jolley, M. E., Stroupe, S. D., Schwenzer, K. S., Wang, C.J., Lu-Steffes, M., Hill, H. D. etal. (1981a). Fluorescence polarization immunoassay. III. An automated system for therapeutic drug determination. Clinical Chemistry 27, 1575-9.
Jolley, M. E., Stroupe, S. D., Wang, C. J., Panas, H.N., Keegan, C.L., Schmidt, R.L. etal. (19816). Fluorescence polarization immunoassay. I. Monitoring aminoglycoside antibiotics in serum and plasma. Clinical Chemistry 27, 1190—7.
Passing, H. & Bablok, W. (1983). A new biometrical procedure for testing the equality of measurements from two different analytical methods. Application of linear regression procedures for method comparison studies in clinical chemistry. Part I. Journal of Clinical Chemistry and Clinical Biochemistry 21, 709-20.
Passing, H. & Bablok, W. (1984). Comparison of several regression procedures for method comparison studies and determination of sample sizes. Application of linear regression procedures for method comparison studies. Part II. Journal of Clinical Chemistry and Clinical Biochemistry 22, 431-45.
Popelka, S. R., Miller, D. M., Holen, J.. T. & Kelso, D.M. (1981). Fluorescence polarization immunoassay. II. Analyzer for rapid, precise measurement of fluorescence polarization with use of disposable cuvettes. Clinical Chemistry 11, 1198-201.
Wenk, M., Vozeh, S. & Follath, F. (1984). Serum level monitoring of antibacterial drugs. A review. Clinical Pharmacokinetics 9, 475-92.