République Algérienne Démocratique et Populaire
Ministère de l’Enseignement Supérieur et de la Recherche Scientifique
UNIVERSITÉ HADJ LAKHDAR BATNA
Faculté des Sciences de L’Ingénieur
Département d’Electronique
THESE
En vue de l’obtention du diplôme de
DOCTORAT ES-SCIENCES
Option : Electronique
Présentée par :
Mohamed BAHAZ
Magister en électronique
Thème
PROPRIÉTÉS NON LINÉAIRES DES TISSUS
APPLIQUÉES À L’IMAGERIE ULTRASONORE
NONLINEAR TISSUS PROPERTIES APPLIED TO ULTRASOUND IMAGING
Soutenue le : 15 juillet 2010
Devant le Jury composé de :
M. Benslam
a Prof., Université de Constantine Président
a
A. Bouakaz
K. Benmah mmed Prof., Université de Sétif et Umm Alqura University, Makkah Rapporteur
H. Djeloua
h
Directeur de Recherche, Inserm, Tours, France Co‐Rapporteur
D. Benatia
Prof., Université USTHB, Alger Examinateur
Prof., Université de Batna Examinateur
N. Benoudjit Dr. MC. Université de Batna Examinateur
A
Ack
know
wleedgeemeents
Acknowledgements
First of all, I would like to express my
sincere appreciation and
thanks to my thesis Advisors, Professor Kier Benmahammed from the University of Setif, Algeria, and Umm Alqura University of Mekkah (KSA), and Ayache Bouakaz, Inserm research director from the University François Rabelais of Tours, France. They were fountains of knowledge and it was truly a pleasure to able to perform research under them and to have them as my advisors.My thanks are extended to the examining committee members for their interest in my work:
• Doctor Malek Benslama, professor at the department of electronics of the University of Constantine.
• Doctor Hakim Djelouah, professor at the USTHB, University of Algiers.
• Doctor Djamel Benatia, professor at the department of electronics of the University of Batna.
• Doctor Nabil Benoudjit, MC at the department of electronics of the University of Batna.
I am very grateful to all my colleagues in the department of electronics of the University of Batna for their support and encouragements.
The work in this thesis is supported in part by Inserm/DPGRF, 2007-08 (a cooperation project between the Inserm France and DPGRF Algeria), and the Advanced Electronics Laboratory of the University of Batna, so I would like Acknowledge them.
NONLINEAR TISSUS PROPERTIES
APPLIED
TO ULTRASOUND IMAGING
Thesis presented by
Mohamed BAHAZ
Magister in Electronics
to my mother.
to the memory of my father.
Ab
bstractt
Abstract
The main aim of the work in this thesis is to exploit nonlinear tissues properties for improving in medical ultrasound image quality.
Ultrasound imaging techniques have been widely used in modern hospitals for clinical ultrasound diagnosis because they can provide important information on the diseased state of the tissues in a human body invasively and non-destructively.
Ulrasound imaging is based on the generation, detection and processing of acoustic waves. The waves are transmitted into the human body, and on encountering variations in the properties of the medium, the waves are scattered and reflected. These reflections therefore contain information on the structures and shapes inside the body. When they are intercepted, the backscattered acoustic echoes are then beamformed and processed to form an image.
The standard approach for ultrasound imaging is to use the fundamental frequency from the reflected signal to form images. Tissue harmonic imaging is a new gray-scale imaging technique, which use harmonic information from nonlinear ultrasound propagation to form an image. It creates images that are derived solely from the higher frequency.
The properties of tissue cause the primary ultrasound signal to distort in the body. The distortion of this signal causes harmonics to be generated in tissue and these harmonics can then be used to generate an ultrasound image. The properties of these harmonic signals that can offer several advantages including improved contrast resolution, reduced noise and clutter, improved lateral resolution, reduced artefacts (side lobes, reverberations).
In this thesis, second harmonic component generation has been used to create images offering improvements over conventional B-mode images in penetration, spatial resolution and, more significantly, in the suppression of acoustic clutter and side-lobe artefacts.
In ultrasound harmonic imaging, an ongoing problem is that undesired signals are contained in the reflected waves, and that corrupt the image data, which leads to the contamination of the obtained image. Harmonic received frequency band must not contain components from transmit band, and its components must sufficiently be separable from fundamental spectral component. Thus, to effectively employ the information contained in the second harmonic of the received signal, this information should be properly extracted. In this thesis, a new technique for acquiring the proper second harmonic signal is presented; an optimization of the transmitted bandwidth is recommended to receive the purely second harmonic signal for harmonic imaging. Given a certain available bandwidth for the transducer, it must be decide in what band the transmitted pulse may be send at, and what band the second harmonic signal should be received at.
Con
nteentss
Contents
CHAPTER I GENERAL INTRODUCTION…………..……….………1
I.1 Introduction and motivation…….…..…..……….………….……….……….1
I.2 Medical ultrasound imaging……….…………..…….……….……….3
I.3 Tissue harmonic imaging and nonlinear propagation………..….…...………..5
I.4 Modeling of nonlinear ultrasound propagation in tissue….…………..…….…….…………6
I.5 Thesis Objective………..……….……….………..……..……….7
I.6 Thesis outline……….…….………..………8
CHAPTER II THEORETICAL BACKGROUND………..………..9
II.1 HISTORY……….………..………9
II.2 NATURE OF ULTRASOUND………..………..………..…10
II.3 GENERATION AND DETECTION OF ULTRASOUND WAVES………..……..11
II.3.1 Piezoelectric effect………..………..………12
II.3.2 Piezoelectric materials……….13
II.4 ULTRASOUND WAVE PROPAGATION………...……….14
II.4.1 Ultrasound waves………..….……….14
II.4.2 Plane wave of small amplitude, equation of propagation……….………14
II.4.3 Nonlinear propagation of sound beams……….………16
II.5 PROPERTIES OF ULTRASOUND WAVES…….…..…..……….……….17
II.5.1 Speed……….……….………..17
II.5.2 Frequency….………19
II.5.3 Acoustic impedance…….……….……….19
II.5.4 Reflection……….……….……….20
II.5.5 Attenuation……….………20
II.6 ULTRASOUND TRANSDUCERS………..………..22
II.6.1 Radiation and reception………..………..22
II.6.2 Important transducer performance parameters………25
II.6.3 Transducer in medical imaging…….………..………..26
II.6.3.1 Beam profile……….……….28
II.6.3.2 Focusing……….……….……….28
II.7 RADIATED BEAM DESCRIPTION……….………29
II.7.1 Beam regions……….………29
II.7.1.1 Nearfield or Fresnel region………..………..………29
II.7.1.2 Farfield or Fraunhofer region…...…..………..……….30
II.7.1.3 Transition region………….…………..……..………..……….30
II.7.2 Energy distribution………..………..31
II.7.2.1 Main lobe………..……….………..31
II.7.2.3 Grating lobes………...……….31
II.8 MEDICAL ULTRASOUND IMAGING…..…..……….………31
II.8.1 Principle……….……….31
II.8.2 Image displaying modes……….33
II.8.2.1 A-mode………...………33
II.8.2.2 B-mode……….………..………33
II.8.2.3 C-mode……….……..………34
II.8.2.4 M-mode………..…….………..34
II.9 BEAMFORMING FOR IMAGING………..………..………35
II.10 RESOLUTION AND IMAGE QUALITY………..……….36
CHAPTER III FUNDAMENTAL ULTRASOUND IMAGING……….………37
III.1 INTRODUCTION………..………..……..………37
III.2 FUNDAMENTAL ULTRASOUND IMAGING………..………..……….……….38
III.3 LINEAR PROPAGATION AND SMALL SIGNAL APPROXIMATION………….………38
III.4 LINEAR ULTRASOUND SYSTEM………..……….…….40
III.4.1 Field in linear ultrasound systems………….………..………41
III.4.2 Spatial impulse response……..……….………43
III.4.3 Calculation of spatial impulse response………...….………43
III.5 NUMERICAL SIMULATION…….…………..……….…..………46
III.5.1 FIELD: Program description………..………..………47
III.6 ARRAY TRANSDUCER…….………..………48
III.7 FOCUSING……….…………..…………..……….……….………50
III.9 SINGLE ELEMENT CIRCULAR TRANSDUCER…….………..………….………51
III.10 APODIZATION……….………...………..…….52
III.11 SIMULATION RESULTS……….……..……….………..……….53
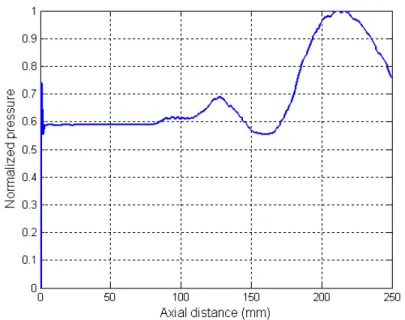
III.11.1 Unfocused Circular Transducer…..……….……….………53
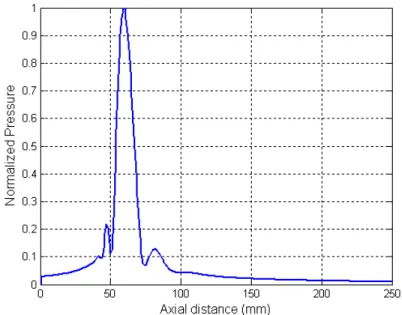
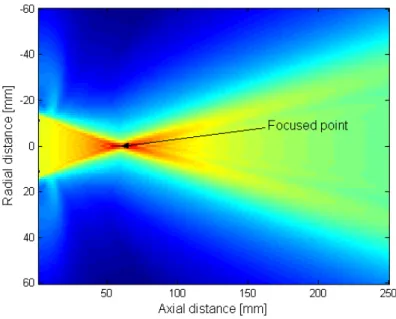
III.11.2 Focused Circular Transducer…….………..……….………..55
III.12 EXAMPLE OF B-MODE IMAGE……..………….……….…….….………57
CHAPTER IV HARMONIC ULTRASOUND IMAGING…….………58
IV.1 INTRODUCTION………..……….….……..………58
IV.2 HARMONIC ULTRASOUND IMAGING……….……….……….………59
IV.3 BENEFITS OF HARMONIC IMAGING………….………..………..…..………60
IV.4 NONLINEARITY IN WAVE PROPAGATION…….………..….………61
IV.5 THEORY OF HARMONIC GENERATION………...….……….……62
IV.5.1 Variation of wave speed in a wave……….………64
IV.5.2 Parameter B/A………..…65
IV.5.3 Amount of wave distortion………..………..……66
IV.5.4 Goldberg’s number………..……….………67
IV.5.5 Mechanical index……….………68
IV.6 EQUATION OF PROPAGATION……….………68
IV.6.1 Lossless Burgers equation………..………..……69
IV.6.2 Burgers equation…..………..………69
IV.6.3 Sound beams and KZK equation………..………..………70
IV.7 MODELING OF NONLINEAR MEDICAL ULTRASOUND………..…………71
IV.7.1 Medium under consideration………...…………..…………72
IV.7.2 Nonlinear numerical methods………73
IV.7.3 Finite difference analysis for ultrasound modeling……….………74
IV.8.1 Boundary conditions……….………..………77
IV.9 SIMULATION RESULTS USING CIRCULAR TRANSDUCER……….………..79
IV.9.1 Low excitation intensity……….………..……80
IV.9.2 High excitation intensity……….………82
IV.10 GRATING LOBES……….……….………..86
IV.11 PENETRATION……….……….……….87
IV.12 EXAMPLE OF COMPARATIVE IMAGES………...…..……….88
CHAPTER V OPTIMIZATION OF HARMONIC IMAGING………..90
V.1 INTRODUCTION……….………..…………..90
V.2 IMAGE FORMATION IN TISSUE HARMONICS……..………..………..91
V.3 SECOND HARMONIC EXTRACTION TECHNIQUES…….………..………..92
V.3.1 Filtration technique……….……….……….92
V.3.2 Pulse encoding technique……….…..………….94
V.3.3 Pulse inversion technique……….………..………94
V.3.4 Side-by-side phase cancellation technique………..………..98
V.3.5 Power modulation technique……….98
V.4 OPTIMIZATION OF HARMONIC IMAGING………..……….101
V.4.1 Bandwidth……….………102
V.4.2 Overlap……….………105
CHAPTER VI CONCLUSION & FUTURE WORKS…….…..………...………..109
REFERENCES
Ch
hap
Ge
pter
ener
r I
General Introduction
I.1 INTRODUCTION AND MOTIVATION
Ultrasound or acoustic waves are used in wide number of fields as means to test and view the inner structure of a medium without having to open it up. It may be possible to discover the motions of the internal parts of bodies, whether animal, vegetable, or mineral, by the sound they make, (Robert Hooke, 1635-1703) [1].
Ultrasound is a term used to describe sound waves that have frequencies above the audible range. As the name implies, ultrasound is high-frequency sound. Sound is the rapid oscillatory motion of atomes or molecules and is produced when a body vibrates. Sound propagates in waves. A wave is a disturbance whose position in space changes with time. Unlike electromagnetic waves, which can travel in vacuum, the propagation of sound waves requires some physical elastic medium, such as gas, liquid or solid. Sound waves are of an elastic or mechanical nature. They travel through a medium by causing local displacement of particles within the medium, but there is no overall movement of this last. If a particle of the medium is displaced from its equilibrium position by any external applied stress, internal forces tend to restore the system to its original equilibrium. Particles making up the medium are not propagating away from the disturbance source but are only vibrating back and forth about their equilibrium positions. Mechanical vibrations become vibrating pressure waves, transferring energy to the medium and to objects that the wave contacts by intimate contact between masses of the medium. In term of energy, sound is mechanical energy that propagates through a continuous, elastic medium by the compression and rarefaction of particles that compose it. Compression is caused by a mechanical deformation induced by an external force, with a resultant increase in the pressure of the medium. Rarefaction occurs following the compression event; as the backward motion of the piston reverses the force, the compressed particles transfer their energy to adjacent particles, with a
subsequent reduction in the local pressure amplitude. The mechanical energy moves progressively from particle to particle when a sound wave propagates in a medium [2].
Many animals in the natural world, such as bats and dolphins, use sound echo-location, which is the key principle of diagnostic ultrasound imaging. The connection between echo-location and the medical application of sound, however, was not made until the science of underwater exploration matured. Sound echo-location is the use of reflections of sound to locate objects. The applications range from geophysical exploration and customs inspection to medical diagnostics and therapy.
In medical field, acoustic waves are used with a frequency that is generally between 1 and 50MHz, which is in ultrasound domain. The waves are transmitted into the human body, and on encountering variations in the properties of the medium the waves are scattered and reflected. These reflections therefore contain information on the structures and shapes inside the body, and when they are intercepted by a transducer, an image can be formed of the organs within the human body.
The discovery of piezoelectricity (the property by which electrical charge is created by the mechanical deformation of a crystal) by the Curie brothers in 1880 and the invention of the triode amplifier tube by Lee De Forest in 1907 set the stage for further advances in pulse-echo range measurement. The Curie brothers also showed that the reverse piezoelectric effect (voltages applied to certain crystals cause them to deform) could be used to transform piezoelectric materials into resonating transducers [5].
The potential of ultrasound as an imaging modality was realized as early as the late 1940s when, utilizing sonar and radar technology developed during World War II. After this, with sonar and radar as models, a few medical practitioners saw the possibilities of using pulse-echo techniques to probe the human body for medical purposes. When commercialized versions of the reflectoscope were applied to the human body in Japan, the United States, and Sweden in the late 1940s and early 1950s (Goldberg and Kimmelman, 1988), a new world of possibility for medical diagnosis was born, and several groups of investigators around the world started exploring diagnostic capabilities of ultrasound.
In medical domain, ultrasound not only complements the more traditional imaging approaches such as x-ray, but also possesses unique characteristics that are advantageous in comparison to other competing modalities such as x-ray computed tomography, radionuclide emission tomography, and magnetic resonance imaging. More specifically:
1. Ultrasound is a form of no ionizing radiation.
2. It is less expensive than imaging modalities of similar capabilities. 3. It produces images in real time, unattainable by any other methods.
4. It is portable and thus can be easily transported to the bedside of a patient. 5. It has a resolution in the millimeter range for the frequencies being clinically
used today.
In ultrasound imaging, some limitations compared to other modalities include inferior resolution and poor penetration depth, are observed in the case of the fundamental imaging (the standard approach for ultrasound imaging is to use the fundamental frequency from the reflected signal to form images).Then, harmonic generation properties have been used to create improved images.
Because ultrasound attenuation is more severe for higher frequencies, there is typically an implicit tradeoff between resolution and penetration depth. Moreover, artifacts due to clutter, beam defocusing due to tissue path inhomogeneities, and multiple reflections can distort the image and cause erroneous interpretation. Many techniques are used in the aim to reinforce the ultrasound pressure field, and to increase the signal-to-noise ratio (SNR) of harmonic component, and consequently to improve the ultrasound image quality.
I.2 MEDICAL ULTRASOUND IMAGING
The history of medical ultrasound goes back more than 50 years, when tests were started using modified sonar equipment. It was seen that the principles of sonar and radar could be used to image human tissue, whose consistence is not that different from water. The first ultrasound systems having diagnostic value displayed what came to be known as A-mode images (A stands for amplitude). The A-mode technology had no focusing, and simply displayed a one-dimensional signal giving the echo strength. In the 1950s and 1960s the B-mode technology was developed (B standing for brightness), giving the first two-dimensional views of the
body. The B-mode technology forms the basis of the technology which today permeates most modern medical facilities. In a B-mode display the brightness in the image is proportional to the echo strength. In the beginning the B-mode images were generated using mechanically moving transducers, so that scans in various directions could be synthesized into an image. However, in the mid 1960s the first electronically steered array transducers were introduced, and this is the technology which has transformed into an advanced real-time scanners [11].
Today, ultrasound imaging techniques have been widely used in modern hospitals for clinical ultrasound diagnosis because they can provide important information on the diseased state of the tissues in a human body invasively and non-destructively.
Ulrasound imaging is based on the generation, detection and processing of acoustic signals. An ultrasound transducer converts electrical voltage pulses into mechanical pulses that propagate outwards as acoustic waves into the human body. Echo signals are produced when the ultrasound waves encounter the interfaces between human tissues with different acoustic impedances. These echo signals, which can have the same or multiple frequency of the original excitation wave, are generaly detected by the same transducer. The electrical signals generated from the backscattered acoustic echoes are then beamformed and processed to form an ultrasound image.
Ultrasound intruments for medical imaging purposes have a significantly smaller size and lower cost compared with instruments in other medical imaging modalities such as Magnetic Resonance Imaging and Computation Tomography. In addition there are no special building requirements as for X-ray, and Nuclear imaging. One ultrasound scanner can be equipped with multiple ultrasound probes to meet various needs for imaging different regions of the human body, and it can form 2D, or 3D, images in real-time.
Finally, it is worth mentioning one of the great leaps taken in medical ultrasound imaging, namely harmonic imaging. It was seen that a clearer image could be synthesized by processing the second harmonic frequency instead of the frequency of the emitted pulse.
I.3 TISSUE HARMONIC IMAGING AND NONLINEAR PROPAGATION
The last few years has seen the emergence a new ultrasound technology called Tissue Harmonic Imaging, or Finite Amplitude Distortion-Based Harmonic Imaging, which overcomes some of the problems of phase aberration, clutter artifacts, reverberation artifacts, and offers improved spatial resolution. Tissue harmonic imaging is a new grayscale imaging technique, which use harmonic information from nonlinear ultrasound propagation to form an image. It creates images that are derived solely from the higher frequency.
The properties of tissue cause the primary ultrasound signal to distort in the body. The distortion of this signal causes harmonics to be generated in tissue and these harmonics can then be used to generate an ultrasound image. When these harmonics are not present in the transmitted pulse, they are mostly caused either by nonlinear propagation of the sound wave in the tissue or by the presence of a medium that is capable of reflecting the transmitted energy in nonlinear manner. All finite amplitude ultrasonic waves undergo a degree of nonlinear distortion when traveling through real media. The distortion is due to slight nonlinearities in sound propagation that gradually deform the shape of the propagating wave, and result in the development of additional harmonic frequencies that were not present in the initial transmitted wave. More precisely, the reason of the distortion of the wave shape is that the tissue is not a completely incompressible medium. At the positives cycles of the acoustic pressure wave (compression) the temperature increases and, the density will increase proportionally while during the negatives cycles of the acoustic pressure wave (expansion) the temperature decreases and also the density of the medium. This change in medium density influences the local propagation speed of sound. Indeed, the positive part of the wave propagates a bit faster than the negative part, leading to a slight deformation in the shape of the wave [51]. This deformation accumulates in depth with propagation distance and is more significant for high acoustic pressure intensities. The distortion manifests itself in the frequency domain by the appearance of additional harmonic signals at integer multiples of the original excitation frequency. Distortion will be more severe for higher pressure amplitudes and another additional number of harmonics will be generated. The properties of these harmonic signals that can offer several advantages including improved contrast resolution, reduced noise and clutter,
improved lateral resolution, reduced artifacts (side lobes, reverberations). These improvements are especially in the region of interest in which the acoustic energy is sufficiently high to cause the harmonics to be generated.
Tissue harmonics uses various techniques to eliminate the echoes arising from the main transmitted ultrasound beam (the fundamental frequency), from which conventional images are made. Once the fundamental frequencies are eliminated, only the harmonic frequencies are left for image formation. Indeed, the quality of the harmonic image is primarily dependent on the complete elimination of all echoes derived from the transmitted frequencies.
I.4 MODELING OF NONLINEAR ULTRASOUND PROPAGATION IN TISSUE
An important aspect of modern engineering design is the use of computer models to simulate a technology before manufacturing. Often modeling not only saves money by allowing virtual research and development, but it also helps foster an understanding of principles needed for an optimal design. However, like in many engineering cases, either the structure geometry is complicated or some critical medium properties and behaviors are not uniform. Thus, an analytical solution cannot be found, or involves too many simplifying assumptions, which degrade the accuracy of the resulting solutions. In these situations, numerical analysis technique obtains piecewise approximate solutions for many engineering problems. Modeling of nonlinear ultrasound propagation in tissue, like the other fields, for the design and engineering of new technologies and techniques that exploit the nonlinear prapagation properties, it is primordial to be able to model the physical process with sufficient accuracy. Doing this, we can predict the consequences of certain design choises before we try to implement them.
In the present thesis, the model of nonlinear ultrasound propagation based on the KZK (Khokhlov-Zabolotskaya-Kuznetsov) equation is used. KZK equation is usually used to describe nonlinear wave propagation. It is based on a parabolic approximation, and describes the combined effects of diffraction, losses and nonlinearity. A numerical algorithm solves the equation in time domain and is based on finite differences method with a stepping in the axis of propagation direction. This algorithm follows similar lines as the algorithm described by Lee and Hamilton.
Numerical solutions have been investigated in the time domain, and the frequency domain.
I.5 THESIS OBJECTIVE
The objective of this thesis is firstly to develop a computationally efficient model of nonlinear ultrasound propagation, which may be used as a simulation tool for use in design of a harmonic imaging system. The model should enable simulation of nonlinear propagation in arbitrary media, and specifically, should accurately model propagation in tissue, and secondly exploiting the properties of the nonlinear propagation in tissue in the aim to searching improvements in ultrasound image quality.
In ultrasound imaging, some limitations compared to other modalities include inferior resolution and poor penetration depth, are observed in the case of fundamental imaging. In the work of this thesis, nonlinear tissues properties are exploited for the purpose of improving in medical ultrasound image quality. With this technique profit is taken from the nonlinearity of the tissues which where the wave energy is transferred from the fundamental frequency, in which the wave was originally transmitted to its higher harmonics.
Major improvements have been achieved by exploiting the characteristics of nonlinear fields with the utilization of harmonic frequencies, especially those of the second harmonic component which generated at two times of the transmit frequency.
Second harmonic component generation has been used to create images offering improvements over conventional B-mode images in penetration, spatial resolution and, more significantly, in the suppression of acoustic clutter and side-lobe artifacts.
Because ultrasound attenuation is more severe for higher frequencies, there is typically an implicit tradeoff between resolution and penetration depth. Moreover, artifacts due to clutter, beam defocusing due to tissue path inhomogeneities, and multiple reflections can distort the image and cause erroneous interpretation. Many methods like pulse inversion technique developed in this thesis are used in the aim to reinforce the ultrasound pressure field, and to increase the signal-to-noise ratio of second harmonic component.
In ultrasound harmonic imaging, an ongoing problem is that undesired signals are contained in the reflected waves, and that corrupt the image data which leads to the contamination of the obtained image. Harmonic received frequency band must not contain components from transmit band, and its components must sufficiently be separable from fundamental spectral component. Thus, to effectively employ the information contained in the second harmonic of the received signal, this information should be properly extracted. In this thesis, a new technique for acquiring the proper second harmonic signal is presented. An optimization of the transmitted bandwidth is recommended to receive the purely second harmonic signal for harmonic imaging. Given a certain available bandwidth for the transducer, it must be decided in what band the transmitted pulse may be sent at, and what band the second harmonic signal should be received at.
I.6 THESIS OUTLINE
Following this introductory chapter, chapter II will establish some fundamental theory background relevant to linear and nonlinear ultrasound propagation.
Chapter III will describes fundamental ultrasound imaging, and presents a numerical method used so far in modeling of linear propagation.
Harmonic ultrasound imaging and the principles of the used numerical model, and improvements achieved with the utilization of harmonic component of echo signal will be discussed in the Chapter IV.
Chapter V is dedicated to the study of bandwidths for fundamental and second harmonic spectral components and the overlap between them and how to optimize the excitation in the aim to earn more improvements in harmonic bandwidth, and consequently more details in required image.
A general conclusion will summarize this work and its main contribution, give recommendations for future works.
Ch
hap
Th
pter
heore
r II
etical
I
Back
kground
Theoretical Background
II.1 HISTORY
Robert Hooke (1635-1703), the eminent English scientist responsible for the theory of elasticity, pocket watches, compound microscopy, and the discovery of cells and fossils, foresaw the use of sound for diagnosis when he wrote: It may be possible to discover the motions of the internal parts of bodies, whether animal, vegetable, or mineral, by the sound they make [1]. Many animals in the natural world, such as bats and dolphins, use echo-location, which is the key principle of diagnostic ultrasound imaging. The connection between echo-location and the medical application of sound, however, was not made until the science of underwater exploration matured. Echo-location is the use of reflections of sound to locate objects. The discovery of piezoelectricity (the property by which electrical charge is created by the mechanical deformation of a crystal) by the Curie brothers in 1880 and the invention of the triode amplifier tube by Lee De Forest in 1907 set the stage for further advances in pulse-echo range measurement. The Curie brothers also showed that the reverse piezoelectric effect (voltages applied to certain crystals cause them to deform) could be used to transform piezoelectric materials into resonating transducers. The potential of ultrasound as an imaging modality was realized as early as the late 1940s when, utilizing sonar and radar technology developed during World War II. After this, with sonar and radar as models, a few medical practitioners saw the possibilities of using pulse-echo techniques to probe the human body for medical purposes. When commercialized versions of the reflectoscope were applied to the human body in Japan, the United States, and Sweden in the late 1940s and early 1950s (Goldberg and Kimmelman, 1988), a new world of possibility for medical diagnosis was born, and several groups of
investigators around the world started exploring diagnostic capabilities of ultrasound.
II.2 NATURE OF ULTRASOUND
Sound is the rapid oscillatory motion of atomes or molecules and is produced when a body vibrates. A wave is a disturbance whose position in space changes with time. Sound propagates in waves. Unlike electromagnetic waves, which can travel in vacuum, the propagation of sound waves requires some physical elastic medium, such as gas, liquid or solid. Sound waves are of an elastic or mechanical nature. If a particle of the medium is displaced from its equilibrium position by any external applied stress, internal forces tend to restore the system to its original equilibrium. Particles making up the medium are not propagating away from the disturbance source but are only vibrating back and forth about their equilibrium positions. Mechanical vibrations become vibrating pressure waves, transferring energy to the medium and to objects that the wave contacts by intimate contact between masses of the medium. In term of energy, sound is mechanical energy that propagates through a continuous, elastic medium by the compression and rarefaction of particles that compose it. Compression is caused by a mechanical deformation induced by an external force, with a resultant increase in the pressure of the medium. Rarefaction occurs following the compression event; as the backward motion of the piston reverses the force, the compressed particles transfer their energy to adjacent particles, with a subsequent reduction in the local pressure amplitude. The mechanical energy moves progressively from particle to particle when a sound wave propagates in a medium [2]-[3].
There exist five major modes of sound waves in terms of their particle motion in relation to the sound wave propagation direction. Longitudinal, transverse, surface, plate, and torsion waves. The longitudinal wave is a compressional wave in which the particle motion is parallel to the wave propagation direction. The transverse wave is shear wave motion in which the particle motion is perpondicular to the wave propagation direction. Surface waves have an elliptical particle motion and travel across the surface of the material, with the major axis of the ellipse perpendicular to wave paropagation direction. Plate or Lamb waves propagate in thin plates or specimen of uniform thickness less than a wavelength of the ultrasound introduced into it, resulting in flexural vibration of plate. Torsion waves occur in rods or wires
when the driving source performs an oscillatory, twisting action about the rod axis. Longitudinal waves can propagate in any elastic and compressible medium (solid, liquid, or gas). However, the other wave modes barely propagate in liquids or gases [4]. The acoustic spectrum breaks down sound into three ranges of frequencies: subsonic range, audible range, and ultrasonic range. Ultrasound wave refers to the human-inaudible sound wave, whose frequency range is above 20 kHz, the upper frequency response limit of the human ear. The ultrasonic range is then further broken down into three subsections, figure (II.1). Ultrasound behaves in a similar manner to audible sound except that it has a much shorter wavelength. The frequency range normally employed in ultrasonic nondestructive evaluation or imaging is 1 MHz to 20 MHz
Figure II.1 : Acoustic spectrum
II.3 GENERATION AND DETECTION OF ULTRASOUND WAVES
In ultrasonic imaging, there must be a way to both generate and detect ultrasound waves. Historically, ultrasound waves were generated using whistles, sirens, and tuning forks. With these techniques, the upper limit of the frequencies that could be generated was approximately 40 kHz [5]. By exploiting the piezoelectric properties of crystals, sound waves can be generated at several tens of megahertz.
Before and after any electrical or mechanical force is applied to a piezoelectric element, the charge of the material is neutral. There is no voltage across the crystal. For generation of an ultrasound wave, an electric voltage is applied to the material. The polarity of the voltage that reaches the material determines the type of mechanical response of the element. The element either becomes thinner and longer or shorter and fatter than the material was at rest. Since the change in shape depends on the polarity of the voltage, the shape of the ultrasound wave can be controlled by controlling the voltage across the piezoelectric element. Detection of ultrasound waves is the reverse procedure of ultrasound wave generation. The polarity of the voltage across the piezoelectric element is determined by whether the piezoelectric material is pushed (made thinner and longer) or pulled (made shorter and fatter) by the reflection of the ultrasound wave. In ultrasound imaging, a piezoelectric transducer is used for both ultrasound wave generation and detection. Initially, to generate ultrasound waves, the piezoelectric element converts an applied voltage to mechanical ultrasound waves. Then, as the reflections of the ultrasound waves arrive to the transducer face, it converts that mechanical energy back into electrical energy.
II.3.1 Piezoelectric Effect
In the 1880s, the Currie brothers and Lippmann both made realizations that are the basis for the current methods of ultrasound wave generation and detection. The Curie brothers discovered that when a mechanical stress is applied to certain materials, an internal electric field is generated such that opposite charges line the opposite sides of the material. Figure (II.2a) shows the direct piezoelectric effect in which a stress induces a charge separation, and figure (II.2b) shows the reverse piezoelectric effect in which a potential difference across the electrodes induces a strain. A year later Lippmann predicted that applying an electric field to these materials would cause the material to deform. Shortly afterwards, the Currie brothers proved Lippmann’s prediction experimentally [5].
Figure II.2: Direct and reverse piezoelectric effects II.3.2 Piezoelectric Materials
Materials that exhibit this piezoelectric behavior include the following crystals: quartz, lead zirconate, barium titanate, and lithium niobate. Typically, a slice of the material is taken so that the parallel portions of the element lie normal to an axis of non-symmetry. The cut is crucial, because a wrong cut can result in suppression of the piezoelectric activity. Furthermore, in order to obtain the piezoelectric behavior, the mechanical stress must be applied to the non-symmetrical axis. In general, ultrasound waves are then generated and detected by placing the piezoelectric element between two plates that can generate and measure an electric field [5].
II.4 ULTRASOUND WAVE PROPAGATION II.4.1 Ultrasound Waves
Waves in diagnostic ultrasound carry the information about the body back to the imaging system. Both elastic and electromagnetic waves can be found in imaging systems. Three simple but important types of wave shapes are plane, cylindrical, and spherical, figure (I.3). A plane wave travels in one direction. Stages in the changing pattern of the wave can be marked by a periodic sequence of parallel planes that have infinite lateral extent and are all perpendicular to the direction of propagation. When a stone is thrown into water, a widening circular wave is created. In a similar way, a cylindrical wave has a cross section that is an expanding circular wave that has an infinite extent along its axial direction. A spherical wave radiates a growing ball-like wave rather than a cylindrical one. In general, however, the shape of a wave will change in a more complicated way than these simple idealized shapes, which is why the principle of superposition synthesis is needed to describe a journey of a wave.
Figure II.3: Plane, cylindrical, and spherical waves showing
surfaces of constant phase
II.4.2 Plane Wave of Small Amplitude, Equation of Propagation
Ultrasound waves can be thought of as pressure variations in a media, which propagate periodically in space and time. To a first order approximation, ultrasound
propagation is well described as a linear process, governed by a linear, second order homogeneous differential equation. The assumption of linear propagation, however, is valid only for relatively small disturbances.
The propagation of sound waves in liquids and gases is described mathematically by the equations of hydrodynamics, which connect the velocity of the particle, the density of the medium, and the pressure. The acoustic wave equation in a fluid medium can be derived from three fundamental physical laws: conservation of masse (equation of continuity), momentum equation (the equation of motion) and pressure density relation for a perfect gas (the equation of state).
0
(II.1)0
(II.2) (II.3) Equation (II.1) is the equation of continuity, equation (II.2) is the momentum equation, and equation (II.3) is the equation of state.Where is the particle velocity, is the pressure, is the masse density, is a constant, and is the ratio of specific heats.
The medium is assumed to be ideal. That is, the medium has not viscosity and energy dissipation, the medium is quiescent when there is no acoustic disturbance, the sound propagation process is adiabatic and, the amplitude of acoustic disturbance is very small compared to the ambient medium condition. The linear, lossless acoustic wave equation in fluids with phase speed can be written as [4]:
0
,
.(II.4)
The variable is the acoustic pressure, where is the quiescent pressure in the ambient medium. The plane wave solution to equation (II.4) is:
Where is the radian frequency, is the location of the space point field pressure with respect to the origin of the coordinate system, and is the propagation vector perpendicular to the constant-phase surface, which points in the wave propagation direction and has magnitude | . The phase speed is a real number for a lossless medium. A purely imaginary phase speed corresponds to an evanescent wave whose amplitude decays as the wave propagates. Therefore, the wave vector could be a complex vector, with its real part representing a progressive wave and its imaginary part representing a no progressive wave.
2
⁄ |
A plane wave is a certain approximation to real conditions. In reality, the perturbation is always localized in space in the form of a beam, as occurs. The propagation of real wave beams frequently differs from the behavior of rays. The reason for this difference is included in the phenomenon of diffraction.
II.4.3 Nonlinear Propagation of Sound Beams
An increase in the intensity of a sound beam brings with it the necessity of investigating processes of nonlinear propagation of a multidimensional acoustic wave.
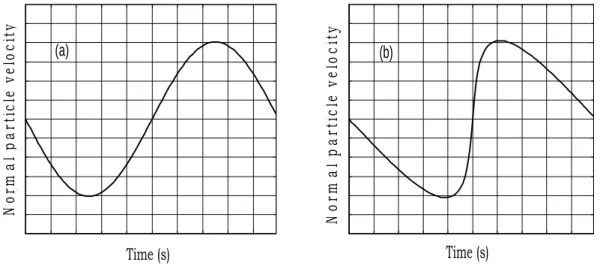
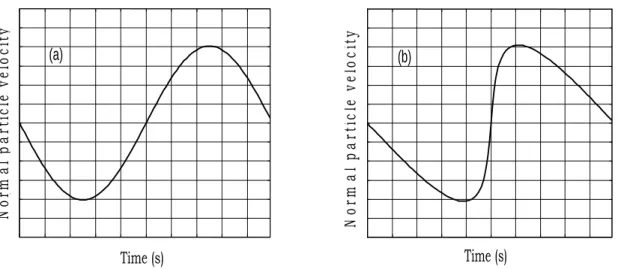
Nonlinear propagation arises from a convective phenomenon and from a nonlinear relationship between pressure and density. Convection effects can be thought of as being like an oscillating wind travelling with the wave. Overall, the oscillation propagates with small signal speed , however, the peak of the oscillation will also have a local particle velocity above and beyond the wave velocity . Effects due to the nonlinearity of the medium can be understood as a dependence of the speed of sound with temperature and pressure. The compression phase of a wave will cause a local increase in pressure and temperature compared with the rarefaction phase. Locally, an increase in pressure and temperature causes an increase in the speed of sound, figure II.4. Thus, the compression phase of a wave travels faster than the rarefaction phase. Note that because the speed of sound is dependent on density, the plane wave impedance relation is no longer a linear relation. The slope of a graph of pressure versus density, is thus not a straight line, but is rather a curve, where the local slope is proportional to the square of the speed of sound.
(a) Time (s) N or m al p ar ti cl e ve loc it y (/ )
(b) Time (s) N or m al pa rti cl e ve loc it y
Figure II.4: Effects of nonlinear distortion of a plane sinusoidal wave: (a) Initial
waveform, (b) Showing the nonlinear distortion after propagating
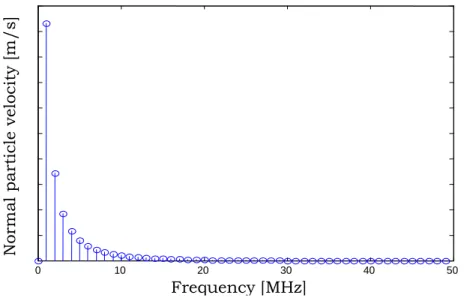
Thus, nonlinear propagation of the sound wave will undergo distortion, which will be more severe for higher pressure amplitudes. In the frequency domain, nonlinearity means that harmonics and sum and difference frequencies will be generated. A sinusoid distorting in the process of nonlinear propagation transforms a monofrequency source at , into an entire spectrum of harmonics, at , 2 , 3 ,
… 4
The nonlinear wave propagation process is more complicated than linear case. A sound beam travelling through a medium will involve the effects of diffraction, absorption, and nonlinearity, and the sound beam can be thought of as interacting with itself as it propagates.
II.5 PROPERTIES OF ULTRASOUND WAVES II.5.1 Speed
Sound travels through different media at different speeds (e.g., sound travels faster through water than it does through air). The speed of a sound wave , is given by the distance travelled by the disturbance (compression or rarefaction) during a given time and is constant in any specific material. It can be found by multiplying the frequency by the wavelength and is usually measured in meters per second (m/s):
.
(II.6) The speed of sound through a material depends on both the density and the compressibility of the medium. The denser and the more compressible the medium, the slower the wave will travel through it. While media of varying properties propagate sound at different speeds, the wave’s speed in a single medium remains constant as long as the temperature and the properties of the medium are held constant [6]. For medical imaging, the speed of sound is different for the various tissues in the body, Table (II.1).Knowledge of the speed of sound is needed to determine how far an ultrasound wave has travelled. This is required in both imaging and pulsed Doppler, but ultrasound systems usually make an estimate by assuming that the speed of sound is the same in all tissues: 1540 m/s. This can lead to small errors in the estimated distance travelled because of the variations in the speed of sound in different tissues.
Medium Speed (m/s) at 20°C to 25°C Air 343 Water 1480 Fat 1450 Blood 1550 Liver 1570 Muscle 1585 Kidney 1561 Soft tissue 1540 Bone 3500
Table II.1: Speed of sound in different medium
Mainly two properties of a medium are considered to affect sound wave speed: elasticity and inertia of the particles within the propagating medium [7]. Elasticity is defined as the degree to which a medium resists deformation when a force is applied to it. Typically, solids have higher elasticity than liquids, which in turn have higher
elasticity than gases. Furthermore, sound waves tend to propagate faster in media with higher elasticity. Inertia, determines the responsiveness of individual particles to their neighboring particles. A greater inertia indicates a medium is composed of particles with larger mass-densities. Sound waves propagate faster in media with less particle inertia.
II.5.2 Frequency
Frequency is defined as the number of wave lengths passing through a point per second. In ultrasound, the frequency of a sound wave can be discerned by counting how many times per unit of time either a high pressure (compression) or a low pressure (rarefaction) passes a particular location. A detector can be used to record the pressure variations through the medium. When the frequency of the sound wave is not obvious from the recorded signal, a Fourier Transform can be performed on the signal in order to determine the frequencies of which the sound wave is comprised as well as the proportions of the sound wave that are at each of these frequencies [8].
II.5.3 Acoustic Impedance
The acoustic impedance of a medium is the impedance (similar to resistance) that the material offers against the passage of the sound wave through it and depends on the density and compressibility of the medium. The greater the change in the acoustic impedance, the greater the proportion of the ultrasound that is reflected. The equation for finding acoustic impedance is as follows [6]:
.
(II.7) Where is the acoustic impedance of the meterial, is the density of the material, and is the speed that sound travels in the material. Table (II.2) shows acoustic impedance of different medium.Material Acoustic impedance ( Mrayl ) Air 0.0004 Water 1.48 Fat 1.38 Blood 1.61 Liver 1.65 Kidney 1.63 Muscle 1.64
Table II.2: Impedance of sound in different medium .
II.5.4 Reflection
When a sound wave encounters the end of one medium and the beginning of another one (a boundary), a portion of the transmitted energy gets reflected. The equation used to determine the amount of energy that gets reflected is as follows [6]:
(II.8)
Where is the acoustic impedance of the first medium, is the acoustic impedance of the second medium, and is the fraction of the energy that gets reflected. Clearly, this equation depends on the acoustic impedances of the two media. Therefore, measuring these acoustic impedances is necessary to evaluate the amount of reflection.
From the mathematical equation for finding a reflection, it can be concluded that a greater difference in acoustic impedances between two neighboring media results in a greater amount of reflection. Note that any energy that is reflected at a boundary is lost from the energy of the propagating sound wave.
II.5.5 Attenuation
Attenuation is the diminishing of the original sound wave’s energy resulting from the combined effects of both scattering and absorption. For ultrasonic imaging,
attenuation is significant because it determines the depth of wave penetration possible and, thus, the depth of imaging that is possible. Scattering occurs when energy reflects from a very small obstacle and absorption occurs when particles in the path of the ultrasound wave retain some of the energy from the wave, possibly in the form of heat [7]. It follows that sound wave and media characteristics that are more conducive to scattering and absorption dissipate sound waves more quickly. One example is the dependency of the degree of attenuation on the sound wave fequency. Sound waves at a higher frequecy tend to have greater amounts of energy absorbed by the media and, consequently, higher frequency sound waves tend to dissipate more quickly than low frequency sound waves within the same media. If we consider a pressure of a plane monochromatic wave propagating in the z-direction decreases exponentially as a function of z:
0
0 0
(II.9) Where is the pressure at and is the pressure attenuation coefficient. Therefore,
(II.10)
The attenuation coefficient has a unit of nepers per centimeter (sometimes expressed in units of decibels per centimeter), like given in the table (II.3) below.
Material Attenuation coefficient (np/cm) at 1 MHz Air 1.38 Water 0.00025 Fat 0.06 Blood 0.02 Liver 0.11 Skull bone 1.30 Aluminum 0.0021
The relative importance of absorption and scattering to attenuation of ultrasound in biological tissues is a matter that is continuously debated. Investigations have shown that scattering contributes little to attenuation in most soft tissues (Shung and Thieme, 1993). Therefore, it is safe to say that absorption is the dominant mechanism for ultrasonic attenuation in biological tissues.
II.6 ULTRASOUND TRANSDUCERS
The realizations of the Currie brothers and Lippmann are the basis for the present day use of piezoelectric transducers in ultrasonic imaging. Piezoelectric materials are dielectric materials that produce electric charge when they are subjected to strain or produce strain when the electric field distribution across them is altered. A transducer is, by definition, a device that converts one form of energy into another [9]. In the case of an ultrasound transducer, this conversion is from electrical energy to mechanical vibration. The thickness of the piezoelectric element will determine the frequency at which the element will vibrate most efficiently, this is known as the resonant frequency of the transducer.
II.6.1 Radiation and Reception
In radiation and reception, an ultrasonic transducer has dual roles by acting both as a radiation device to generate ultrasound from an electrical signal and as a reception device to convert ultrasound to an electrical signal. In contrast to the older tools that generated ultrasound waves with frequencies as high as 40 kHz, piezoelectric transducers allow for ultrasound waves in the 100s of MHz to be generated. Furthermore, the precision of detection available by measuring the voltages in the transducer that result from the ultrasound wave reflections is much greater than relying on animals and flames for ultrasound wave detection.
The main components of a transducer are the active element, backing, and wear plate, figure (II.5). The active element, which is piezoelectric or ferroelectric material, provides electric-mechanic energy transduction, and vice versa. The most commonly used piezoelectric materials are polarized ceramics. New materials such as piezo-polymers and composites are also used for their benefit to transducer and system performance. The backing is usually a highly attenuating, high-density material that absorbs the energy radiating from the back surface of the active element. It is used
to increase the bandwidth of the transducer. For immersion applications, the wear plate not only provides protection to the active element but also serves as an acoustic impedance transformer between the high acoustic impedance of the active element and the low acoustic impedance of the liquid (usually a quarter-wavelength-thick matching layer to achieve in phase output) [10].
Figure II.5: Transducer components
The electrical-to-mechanical energy transduction of ultrasonic transducers can be modeled by three-port network called Mason’s equivalent circuit, with two acoustic ports representing two surfaces of the active element and one electrical port. The coupling between the stress in the acoustic ports and voltage in the electrical port is modeled by an electromechanical transformer.
Unfocused transducer emits an ultrasonic beam that spreads radially due to diffraction. The beam intensity falls off and the beam diameter is too large to obtain good lateral resolution when probing an object in the farfield. Therefore, a focused acoustic beam is often employed, as in optics, to obtain good lateral resolution and high acoustic beam intensity at a point of interest [11]. The use of focused ultrasound pulse waves prompts inspection sensitivity because the ultrasound energy is concentrated in a focal region so that the response of the microstructure in
this focal region to the incident ultrasound wave could be probed with high sensitivity.
Focused ultrasound pulse waves can be generated by a single element transducer with concave surface such as spherical or cylindrical surface, which functions similarly to a focusing optical lens. There are essentially three approaches to focus an ultrasound beam: shaping the actual transducer vibrating element, attaching a concave lens to the transducer face, and inserting a biconvex lens into the ultrasound energy path which is similar to focusing the light from the sun using a magnifying glass.
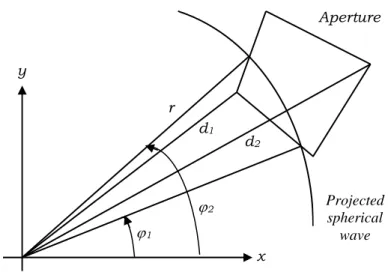
The sound field of a transducer is a beam within which sound intensity varies. An unfocused beam can be divided into the nearfield and the farfield. The nearfield is the region directly in front of the transducer where the echo amplitude goes through a series of maxima and minima and ends at the last axial maximum, at distance from the transducer, where is the diameter of the transducer surface. The farfield is the region at distances greater than [12]. Attenuation is effectively a gradual loss of energy. The ultrasound beam attenuates as it progresses through a medium. Attenuation in the nearfield is associated with edge diffraction, absorption and scattering. In farfield, beam spread joins the three factors to attenuate sound intensity of the beam [12]. A spherical focusing transducer has the following important characteristics, figure (II.6):
4 ⁄
diameter , focal length which is the distance between the center point on transducer surface and the point of maximum echo from a point target, focal depth
which is the pulse echo beam axial distance between two points whose echo amplitudes are 6 relative to the focal point amplitude, beam diameter which is the 6 pulse echo beam lateral diameter at .
20
The numerical aperture of a transducer is defined as the ratio of its focal length to its diameter. The waveform of a transducer has the following parameters: center frequency, frequency bandwidth, pulse duration that is the waveform duration at the level or 10% amplitude of peak, pulse repetition frequency that is the number of pulses produced per second. A transducer is often described by its waveform center frequency, diameter and numerical aperture.
II.6.2 Important Transducer Performance Parameters
The ultrasound transducer is one of the most important parts in any ultrasound scanner system. Electromechanical coupling coefficient, resonance frequency, bandwidth, the dimension, and the effective transducer aperture are among the major parameters that govern the performance of an ultrasound transducer [13]. Electromechanical coupling coefficient is a key parameter used to describe a transducer’s effectiveness as a converter of energy. It can be defined as the ratio between the converted mechanical energy and total input energy in one cycle. It is important to note that the electromechanical coupling coefficient value is not equal to the energy conversion efficiency which determines the amount of energy that is converted, the amount that is lost as heat with respect to available input energy. A transducer that has the efficiency equal to unity but a low electromechanical coupling coefficient value will convert all input energy to output energy but it will not be able to complete it in one single cycle. It will take several cycles before all input energy is converted [14]. For piezoelectric transducers operated in the thickness mode, the resonance frequency, which approximately determines where maximum sensitivity is achieved, is determined by the thickness of the transducer layer, sound velocity and electromechanical coupling coefficient [15]-[16]. The operating frequency also affects the focusing performance of an ultrasound transducer. Higher frequency is associated with a shorter wavelength, resulting in improved lateral and axial resolution.
Bandwidth is generally defined as the frequency range over which the transducer response is greater than its half-maximum (i.e. -6 dB with respect to maximum). Higher bandwidth increases the versatility of ultrasound transducers.
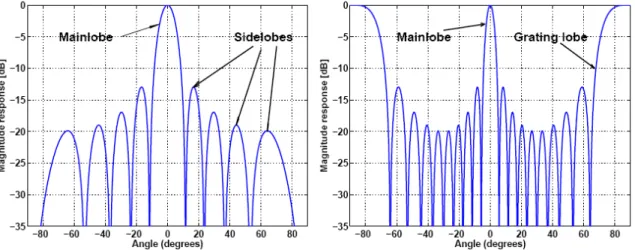
The size of the transducer and each individual element plays an important role in transducer’s performance. For a certain range or focal length, a larger aperture generally improves the lateral resolution. The element spacing pitch also has a significant impact and determines whether there is any grating lobe in the transducer angular response, and where the grating lobe will exist. The element width has an impact on both single element and overall array beam pattern. For an array transducer, it determines the magnitudes of the sidelobes and grating lobes. For single element beam pattern, it determines the behavior of the sidelobes. The ultrasound transducer is a complex system in the sense that every parameter has impact on net transducer performance. For every application, the transducer has to be designed carefully and has to undergo an optimization procedure to ensure the transducer performance meets the application needs [17].
II.6.3 Transducer In Medical Imaging
All ultrasonic imaging systems require a device called an ultrasonic transducer to convert electrical energy into ultrasonic or acoustic energy and vice versa. The ultrasonic field from transducers is the feature that determines the performance of a given system. The study of the spatial and temporal characteristics of the acoustical pressure field allows a greater understanding of the behavior of such devices. The medical ultrasound scanners use advanced transducer geometries for creating ultrasound fields suitable for probing the body. Ultrasound imaging is based on the transducer characterization in where pulsed ultrasound waves are directed into the human body, and echo signals from reflectors and scatterers organs are detected and used to construct an image. A first characterization of these transducers is based on computer simulation of the field. Ultrasonic transducers come in a variety of forms and sizes ranging from single-element transducers for mechanical scanning and linear arrays, to multidimensional arrays for electronic scanning. Although performance of an ultrasonic scanner is critically dependent upon transducers/arrays,
array/transducer performance has been one of the bottlenecks that prevent current ultrasonic imagers from reaching their theoretical resolution limit.
Like imaging, ultrasound transducers have also been improved over the time to meet the increasing needs demanded by new diagnostic and clinical applications. Lead Zirconium Titanate transducers (PZT) have dominated the medical ultrasound field since its beginning. Most current handheld ultrasounds probes are based on PZT technologies. In recent years, another type of transducer – Capacitive Micromachined Ultrasonic Transducer (CMUT) has gained a lot of attention and has emerged as promising transducer replacement due to its high bandwidth, low cost, and potential compatibility with tightly integrated electronics. However, both PZT and CMUT transducers have deficiencies providing opportunities for making significant improvements [17]. Figure (II.7), shows an example of a beam profile in medical ultrasound imaging field.
Harmonic imaging necessitates high transducer bandwidth. In harmonic imaging, the transducer transmits ultrasound waves at a fundamental frequency band, and receives harmonic (generally second harmonic) echoes back from the human body. Moreover, bandwidth is a critical factor determining the image axial resolution. A higher bandwidth means fewer pulse cycles in the time domain, and results in improved axial resolution (range of depth resolution) in an image. A transducer with higher electromechanical coupling effectiveness usually has wider bandwidth and shorter pulse duration.
Medical ultrasound scanners typically use high frequencies of between 1 and 20 MHz. Simple Doppler systems operate with a continuous single-frequency excitation voltage, but all imaging systems and pulsed Doppler systems use pulsed excitation signals. If ultrasound is continuously transmitted along a particular path, the energy will also be continuously reflected back from any boundary in the path of the beam, and it will not be possible to predict where the returning echoes have come from.
The pulses used in imaging ultrasound are very short and will only contain 1 to 3 cycles in order that reflections from boundaries that are close together can be easily separated. Pulsed Doppler signals are longer and contain several cycles. In fact, a pulse is made up not of a single frequency but of a range of frequencies of different amplitudes. Different shaped pulses will have different frequency contents.
II.6.3.1 Beam profile
When the vibrating surface of the transducer is in contact with the tissue which be imaged, an ultrasound beam of longitudinal waves is radiated into the tissue. According to Huygens’s principle, which describes a large transducer surface as an infinite number of point sources of ultrasound energy where each point is characterized as a radial emitter, the ultrasound beam can be calculated as interference between spherical waves that originate at all points from the transducer surface. The spatial variation of the beam power is called beam profile.
The soft tissue which has inhomogeneous acoustic properties absorbs acoustic energy. This affects the ultrasound beam profile by changing the frequency content, phase aberrations, and reverberations. Exact values of the ultrasound beam profile can be obtained by numerical calculation, and in special cases we can obtain exact and approximate analytical expressions for the beam profile [18]. The ultrasound beam profile will depend on the length of the transmitted pulse, and we therefore often define a continuous wave (CW) beam pattern for a continuous vibration of the surface of the transducer, and a pulsed wave (PW) for a pulsed vibration.
II.6.3.2 Focusing
The principle of focusing an ultrasound beam is to align the pressure fields from all points of the transducer aperture to arrive at the field point at the same
time. This can be done through either a physically curved aperture, through a lens in front of the aperture, or by the use of electronic delays for multi-element arrays. The focal distance, the length from the transducer to the narrowest beam width, is shorter than the focal length of a nonfocused transducer and is fixed. The focal zone is defined as the region over which the width of the beam is less than two times the width at the focal distance; thus, the transducer frequency and dimensions should be chosen to match the depth requirements of the clinical situation.
II.7 RADIATED BEAM DESCRIPTION II.7.1 Beam Regions
The ultrasound field that emanates from a piezoelectric transducer does not originate from a point, but instead originates from most of the surface of the piezoelectric element. Round transducers are often referred to as piston source transducers because the ultrasound field resembles a cylindrical mass in front of the transducer. Since the ultrasound field originates from a number of points along the transducer surface, the ultrasound intensity along the beam is affected by constructive and destructive wave interference. These are sometimes also referred to a diffraction effects. For a plane ultrasound transducer there are three distinct regions of the beam:
II.7.1.1 Nearfield or Fresnel region
It’s the region situated between the transducer and the farfield region. The nearfield is adjacent to the transducer face and has a converging beam profile. Beam convergence in the nearfield occurs because of multiple constructive and destructive interference patterns of the ultrasound waves from the transducer surface. As individual wave patterns interact, the peaks and troughs from adjacent sources constructively and destructively interfere, causing the beam profile to be tightly collimated in the nearfield. The ultrasound beam path is thus largely confined to the dimensions of the active portion of the transducer surface, with the beam diameter converging to approximately half the transducer diameter at the end of the nearfield. The nearfield lengh is dependent on the transducer frequency and diameter as:
Where is the transducer diameter, is the transducer radius, and λ is the wavelength of ultrasound waves in the propagation medium. Pressure amplitude characteristics in the near field are very complex, caused by the constructive and destructive interference wave patterns of the ultrasound beam. Peak ultrasound pressure occurs at the end of the nearfield, corresponding to the minimum beam diameter for a single element transducer. Pressures vary rapidly from peak compression to peak rarefaction several times during transit through the nearfield.
sin θ
1.22
II.7.1.2 Farfield or Fraunhofer region
It’s the region wherein the ultrasound beam spreads as a cone with a main lobe and side lobes as skirts around. The intensity falls off gradually from the axis in the main lobe, and we specify the intensity drop of the ultrasound field that defines the beam width. For a large area single element transducer, the angle of ultrasound beam divergence θ, for the farfield is given by:
(II.12)
Where is the effective diameter of the transducer, and λ is the wavelength. Less beam divergence occurs with high frequency, large diameter transducer. Unlike the nearfield, where beam intensity varies from maximum to minimum to maximum in a converging beam, ultrasound intensity in the farfield decreases monotonically with distance.
d
II.7.1.3 Transition region
It’s the region between the extreme nearfield and farfield regions. In the transition region, the diffraction causes a slight contraction of the central portion of the ultrasound beam before it starts to diverge in the farfield region. This phenomenon is sometimes referred to as diffraction focusing, and it causes highest intensity of the ultrasound beam for a focused transducer to be nearer the transducer than the geometric focus.
![Figure II.11: Illustration of the principle of beamforming ( figure Adapted from [14])](https://thumb-eu.123doks.com/thumbv2/123doknet/14912165.659112/49.918.201.744.637.901/figure-ii-illustration-principle-beamforming-figure-adapted.webp)