HAL Id: hal-02652427
https://hal.inrae.fr/hal-02652427
Submitted on 29 May 2020
HAL is a multi-disciplinary open access
archive for the deposit and dissemination of
sci-entific research documents, whether they are
pub-lished or not. The documents may come from
teaching and research institutions in France or
abroad, or from public or private research centers.
L’archive ouverte pluridisciplinaire HAL, est
destinée au dépôt et à la diffusion de documents
scientifiques de niveau recherche, publiés ou non,
émanant des établissements d’enseignement et de
recherche français ou étrangers, des laboratoires
publics ou privés.
Is R2* a new MRI biomarker for the progression of
parkinson’s disease? A longitudinal follow-up
Miguel Ulla, J.-M. Bonny, Lemlih Ouchchane, Isabelle Rieu, Béatrice Claise,
Franck Durif
To cite this version:
Miguel Ulla, J.-M. Bonny, Lemlih Ouchchane, Isabelle Rieu, Béatrice Claise, et al.. Is R2* a new MRI
biomarker for the progression of parkinson’s disease? A longitudinal follow-up. PLoS ONE, Public
Library of Science, 2013, 8 (3), pp.e57904. �10.1371/journal.pone.0057904�. �hal-02652427�
Parkinson’s Disease? A Longitudinal Follow-Up
Miguel Ulla1,2*, Jean Marie Bonny3, Lemlih Ouchchane4,5, Isabelle Rieu1,2, Beatrice Claise2,6, Franck Durif1,2
1 CHU Clermont-Ferrand, Service de Neurologie A, Clermont-Ferrand, France, 2 University Clermont 1, EA3845, Clermont-Ferrand, France, 3 INRA, UR370 Qualite´ des Produits Animaux, Saint Gene`s Champanelle, France, 4 CHU Clermont-Ferrand, Poˆle Sante´ Publique Me´decine Le´gale Qualite´ Vigilances, Unite´ de Biostatistique Informatique Me´dicale et Technologies de Communication, Clermont-Ferrand, France,5 University Clermont1, Laboratoire de Biostatistique Informatique Me´dicale et Technologies de Communication, Clermont-Ferrand, France,6 CHU Clermont-Ferrand, Service de Radiologie B, Clermont-Ferrand, France
Abstract
Purpose:To study changes of iron content in basal ganglia in Parkinson’s disease (PD) through a three-year longitudinal follow-up of the effective transverse relaxation rate R2*, a validated MRI marker of brain iron content which can be rapidly
measured under clinical conditions.
Methods: Twenty-seven PD patients and 26 controls were investigated by a first MRI (t0). Longitudinal analysis was
conducted among the 18 controls and 14 PD patients who underwent a second MRI (t1) 3 years after. The imaging protocol
consisted in 6 gradient echo images obtained at different echo-times for mapping R2*. Quantitative exploration of basal
ganglia was performed by measuring the variation of R2* [R2*(t1) – R2*(t0)] in several regions of interest.
Results:During the three-year evolution of PD, R2* increased in Substantia nigra (SN) (by 10.2% in pars compacta, p = 0.001,
and 8.1% in pars reticulata, p = 0.013) and in the caudal putamen (11.4%, p = 0.011), without significant change in controls. Furthermore, we showed a positive correlation between the variation of R2* and the worsening of motor symptoms of PD
(p = 0.028).
Conclusion:Significant variation of R2* was longitudinally observed in the SN and caudal putamen of patients with PD
evolving over a three-year period, emphasizing its interest as a biomarker of disease progression. Our results suggest that R2* MRI follow-up could be an interesting tool for individual assessment of neurodegeneration due to PD, and also be useful
for testing the efficiency of disease-modifying treatments.
Citation: Ulla M, Bonny JM, Ouchchane L, Rieu I, Claise B, et al. (2013) Is R2* a New MRI Biomarker for the Progression of Parkinson’s Disease? A Longitudinal
Follow-Up. PLoS ONE 8(3): e57904. doi:10.1371/journal.pone.0057904 Editor: John Duda, Philadelphia VA Medical Center, United States of America Received August 7, 2012; Accepted January 29, 2013; Published March 1, 2013
Copyright: ß 2013 Ulla et al. This is an open-access article distributed under the terms of the Creative Commons Attribution License, which permits unrestricted use, distribution, and reproduction in any medium, provided the original author and source are credited.
Funding: The authors have no funding or support to report.
Competing Interests: The authors have declared that no competing interests exist. * E-mail: mulla@chu-clermontferrand.fr
Introduction
Increased iron concentration was found in specific brain structures of patients suffering from Parkinson’s disease (PD). Indeed, post mortem histological analysis [1], in vivo magnetic resonance imaging (MRI) [2–7] and transcranial sonography [8] studies are in agreement, highlighting iron deposition in the substantia nigra (SN) of PD patients, although results are controversial for other basal ganglia (BG) structures such as the putamen [9–11]. Whereas no association was shown between iron deposition and disease duration, clinical scores correlated with SN iron load in PD patients [4,5,12], suggesting that the amount of SN iron could be a biomarker of disease severity.
It is noteworthy that since there is no longitudinal data available in PD, all these results come from cross-sectional studies that do not directly assess changes in the amounts of iron in the brains of subjects over time. Thus, to further investigate the link between brain iron changes and PD progression, a longitudinal approach involving both PD patients and normal subjects appears to be the
most appropriate study design for distinguishing between the concomitant effects of normal aging and disease evolution over time. Indeed, the amount of iron increases particularly in the caudate nucleus, putamen [13–16] and cerebral cortex [17] during normal aging.
Magnetic resonance imaging (MRI) is a non invasive imaging modality which makes it interesting for conducting longitudinal follow-ups. Moreover, it is a powerful tool for detecting iron deposits in the brain. Iron deposition induces local, fluctuating and non-fluctuating, magnetic field inhomogeneities which lead to faster signal decay and thus to an increase of the relating relaxation rates [18]. First, the relaxation rate R2(R2= 1/T2) is
influenced by the effects of fluctuating microscopic magnetic field due to iron. The measurement of R2is based on spin-echoes which
discard the non-fluctuating magnetic field inhomogeneities whereas the fluctuating ones are preserved. It explains why iron effects are detectable through R2 variations. Secondly, the
relaxation rate R2’ conveys the other non-fluctuating magnetic
variations using gradient-echoes [19]. It has been shown that R2
and R2’ exhibit a strong correlation with iron concentration, with
similar sensitivities [20]. Since reversible and irreversible iron effects cumulate through R2*, which sums these two relaxation
rates, this parameter is characterized by a higher sensitivity to iron content. This is why we propose to assess R2* as an imaging
biomarker of PD evolution.
To achieve this, a 3-year follow-up longitudinal study was conducted on cohorts of PD patients and controls for dissociating the effects of disease progression and normal aging in regional variations of R2* in basal ganglia (BG).
Methods Subjects
Twenty-seven PD patients were included in the study. They were recruited consecutively, among patients who presented themselves for consultation in the Movement Disorder unit of Clermont-Ferrand, France. All the patients were suffering from idiopathic Parkinson’s disease according to the criteria of the ‘‘Parkinson’s Disease Society Brain Bank’’ [21]. In addition, twenty-six control subjects were included, recruited among relatives of patients, who were all free of any history of neurological or psychiatric diseases.
All the subjects were interviewed regarding their previous medical history and a Mini Mental Status examination was performed to exclude demented subjects (MMS,26/30). In the PD group, disease duration, levodopa equivalent dose (LED) [22], Hoehn and Yahr (HY) stages and the motor part of Unified Parkinson’s Disease Rating Scale (UPDRS III) [23], were noted, the latter two being assessed in the ‘‘on’’ state. The lateralized UPDRS motor score on each side was also calculated (sum of items 20 to 26).
All the subjects were investigated by an initial MRI session (called t0). Three years later the subjects were contacted by mail or phone to participate in a second MRI session, to enable us to conduct a longitudinal analysis. After acceptance, 18 controls and 14 PD patients underwent this second MRI session (called t1). Thus 13 PD patients (1 death due to heart attack, 3 benefiting from deep-brain stimulation, 1 refusal and 8 moves) and 8 controls (unavailability) did not have the second MRI.
All subjects gave written consent and the study was approved by the local research ethics committee (Comite´ de Protection des Personnes Sud-Est, file AU 867).
MRI Investigations
Images were obtained using a 1.5 T MRI system (Sonata, Siemens, Germany). The subjects were immobilized in the head coil for both emission and reception, by foam pads to reduce involuntary head movements. Disposable ear protectors were also used to reduce acoustic noise.
A T1-weighted sagittal scout image was first acquired to locate
the anterior and posterior commissure (AC and PC). Then, an anatomical protocol was used to highlight BG structures in 14 slices acquired parallel to the AC-PC line.
Finally, we used a 2D steady-state free precession gradient echo sequence for mapping the apparent proton transverse relaxation rate (R2* = 1/T2*). For each of the 14 slices of the anatomical
dataset, images were obtained at 6 different echo times (TE) ranging from 7.61 ms to 50 ms (7.61, 10, 20, 30, 40, 50 ms). The other image parameters were: TR = 1050 ms, FOV = 2806280 mm2, matrix = 1286128, slice thickness = 2.5 mm (volume of the resulting voxel 2.262.262.5 mm3). The duration of the whole MRI session was 40 minutes.
Image Analysis
Regions of interest (ROI) in which R2* was measured were
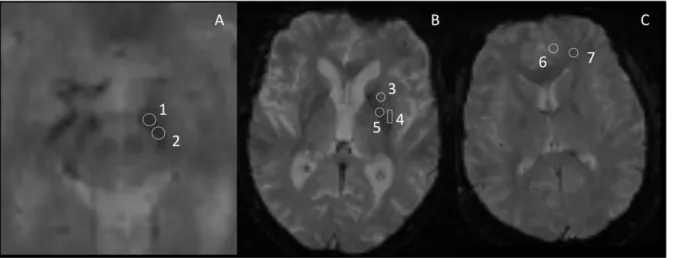
defined manually on the anatomical images using ImageJ, a public domain software application (http://rsb.info.nih.gov/ij/). This approach was preferred to automatic segmentation because it is the only method able to subdivide SN into two parts (pars reticulata and pars compacta) [24]. The investigator responsible for ROI definition (M.U.) was unaware of subject group identification. The accurate position of each ROI was systemat-ically controlled in the images obtained at the different TE and for the two MRI of the same subject based on relative distance of the ROI to the boundaries of the anatomical structure.The shape and size of the ROI were identical for a given structure in all subjects. Three BG structures were selected (Figure 1): the SN divided into two parts: pars reticulata and pars compacta (SNr and SNc respectively); according to recent data [5]; the putamen, also divided into two parts: rostral and caudal (rPut and cPut respectively); and the globus pallidus (GP). Grey matter (GM) and white matter (WM), both in the frontal lobe, were also studied. All ROI were placed bilaterally.
R2* values from the different brain structures were obtained by
fitting the ROI-averaged magnitude of the six echoes with a single exponential decay using a nonlinear least-squares numerical procedure.
Statistical Analysis
PD patients were compared to controls regarding gender (using Fisher’s exact test) and continuous characteristics such as age and period between t0and t1examinations (using the Wilcoxon test).
R2* values measured in the left and right hemispheres (in
controls) as well as in the more and less affected side (in PD patients) in each brain structure were not significantly different (paired signed rank tests). Therefore these two measurements were averaged to obtain a single representative value in each structure. Quantitative variables were transformed into ordinal classes (age in quartiles, disease duration, HY stage and UPDRS in terciles) for inclusion as factors in ANOVAs. The effect of different variables on R2* at t0was tested separately for each ROI and each group by
analysis of variance (ANOVA); i.e. gender and age for all groups of subjects, and disease duration, HY stage and UPDRS for the PD group only. In the case of significant effect, a post-hoc multiple comparisons procedure was performed (Tukey test).
Subjects who benefited from two MRI sessions (n = 32) were used to assess the possible difference between R2* values by
performing a signed rank test after computation of DR2* defined
as the difference R2*(t1) – R2*(t0).
Furthermore, disease effect was tested for both R2* at t0 and
DR2* through ANOVA involving PD patients (PD) and controls.
Finally, correlations between DR2* and variations of HY stages,
DHY (HY*(t1) – HY*(t0)), variations of LED, DLED (LED (t1) –
LED (t0)) and percentage changes of UPDRS III worsening
(DUPDRS, %) were tested using a Spearman correlation. All these statistical tests were performed on SAS (SAS v9.1, SAS institute inc., Cary, NC, USA) with a 0.05 type I error.
Results Subjects
Table 1 summarizes the demographic and clinical characteris-tics of subjects.
When comparing the characteristics of control and PD groups, no significant difference was found in age (p = 0.314), gender (p = 0.264) and in the period between the two MRI sessions (p = 0.819).
The LED was 6146317 mg at t0and 9076443 mg at t1, with a
significant increase between t0and t1(p = 0.019). The HY scale
and the UPDRS III in PD patients followed-up longitudinally were significantly higher at t1 compared to t0, reflecting disease
evolution (HY, p = 0.007; UPDRS, p,0.0001).
The comparisons between subjects investigated only at t0and
subjects investigated twice did not reveal any significant difference regarding age (p = 0.667 for controls and p = 1 for PD patients) and gender (p = 0.118 for controls and p = 1 for PD patients) in all subjects, either regarding disease duration (p = 0.099), HY stage (p = 0.506) and UPDRS III (p = 0.101) in PD patients.
It should be noted that anatomical MRI sequences in all our subjects did not display any anomalies, in particular vascular lesions.
Cross-sectional Analysis of R2*
Measurements performed at t0on controls showed that R2* was
higher in older subjects (Table 2). The effect of age turned out to be significant in the cPut (f = 5.39, p = 0.007) and the GM (f = 4.39, p = 0.016). Post-hoc analysis showed that the difference was significant between first three quartiles and last quartile, in both cPut and GM. Moreover, no effect of gender on R2* was
found.
In PD patients, a significant effect of age in the rPut (f = 4.4, p = 0.019) was observed. Post-hoc comparisons revealed higher R2* values in the fourth quartile of age compared to the others.
We also showed a trend of lower R2* in WM (f = 3.08, p = 0.057).
Gender, disease duration, HY stage and UPDRS III did not have significant effects on R2* at t0(Table 2).
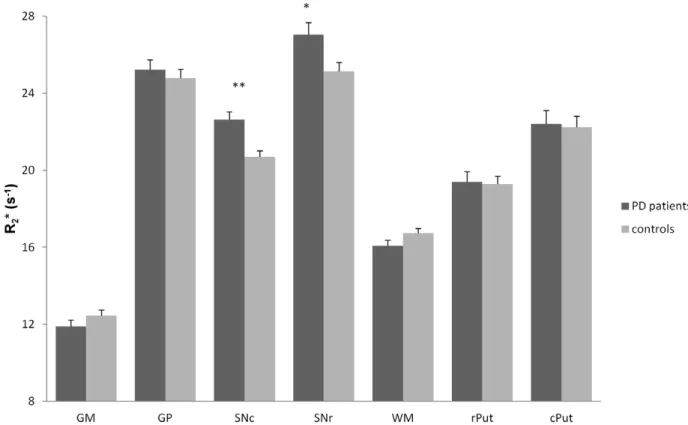
Finally, the intergroup comparison at t0with ANOVA showed a
significant effect of PD on R2* in SNr (f = 6.55, p = 0.013) and SNc
(f = 15.49, p,0.001), R2* being higher in the PD group. Also, R2*
tended to be lower in the WM of PD patients (f = 3.08, p = 0.085) (Figure 2).
Longitudinal Analysis of R2*
For controls, no significant evolution over 3 years was found. DR2* tended to be significant in WM with R2* decreasing by
0.8260.44 s21(p = 0.099).
For PD patients, R2* increased by 2.3260.63 s 21
(10.2%) in SNc (p = 0.001), 2.1960.95 s21 (8.1%) in SNr (p = 0.042) and 2.5660.8 s21(11.4%) in the cPut (p = 0.011), while it decreased by 1.2160.44 s21(7.5%) in WM (p = 0.042).
Concerning the comparison between controls and PD patients, DR2* in PD changed significantly from that of controls in SNc
(f = 12.1, p = 0.002), SNr (f = 5.05, p = 0.033) and in the cPut (f = 5.91, p = 0.022). It should be noted that there was no difference of DR2* between PD and controls in WM. The results
of the longitudinal studies are grouped in Figure 3.
Finally, we found a positive correlation between DR2* and
DUPDRS in SNc (R = 0.586, p = 0.028) and SNr (R = 0.608, p = 0.021) (Figure 4), but no correlation between DR2* and DHY
nor between DR2* and DLED.
Figure 1. ROI location in three different slices (A, B and C) in anatomic images. TR = 1100 ms, TE = 50 ms, field-of-view (FOV) = 2806280 mm, acquisition matrix = 2566256 1: Substantia nigra pars reticulata (SNr). 2: Substantia nigra pars compacta (SNc). 3: rostral putamen (rPut). 4: caudal putamen (cPut). 5: Globus Pallidus (GP). 6: gray matter (GM). 7: white matter (WM).
doi:10.1371/journal.pone.0057904.g001
Table 1. Demographic and clinical characteristics of subjects.
group n (t0) age (years) gender (M/F) disease duration (years) HY stage (t0) UPDRS III (t0) n (t1) delay between 2 MRI (months) HY stage (t1) UPDRS III (t1) PD patients 27 60.2610.7 13/14 5.764.4 1.960.7 12.168.5 14 36.964.7 2.560.5* 19.8614.7** controls 26 57.068.5 9/17 NA NA NA 18 37.263.7 NA NA
Mean 6 standard error. M = male; F = female; NA = not applicable; HY = Hoehn and Yahr; UPDRS III = motor part of UPDRS (Unified Parkinson’s Disease Rating Scale). *p,0.01 and **p,0.0001, vs. t0(signed rank test).
Discussion
Using an adapted longitudinal analysis, we show for the first time: i- how quickly R2* increases due to the disease, since over 3
years it evolved by 10.2% in SNc, 8.1% in SNr and 11.2% in the cPut; ii- a positive correlation between DR2* and disease
worsening assessed with motor part of UPDRS. We also confirm that R2* increased in the SN of PD patients compared to controls.
Our results therefore suggest that R2*, previously considered as
being a disease marker, is also sensitive to its evolution.
Cross-sectional Analysis at t0
We confirm that R2* is significantly higher in the SN of PD
patients and that no changes had occurred in the others parts of BG, in agreement with previous R2*-based cross-sectional studies
[3,7,9]. Despite obvious anatomical differences between the two Table 2. R2* (s
21
) at t0in each ROI (mean 6 standard error).
t/q n GM GP SNc SNr WM rPut cPut controls age 1 8 12.4660.34 25.8160.59 21.4760.53 25.7960.62 17.1360.32 18.9860.57 21.6760.35 (n = 26) 2 7 11.6160.53 23.7360.67 20.5660.52 25.2360.91 16.2560.32 18.7460.70 20.9660.66 3 6 12.1060.28 24.4561.15 19.6660.48 23.8760.81 16.3860.76 19.4161.13 21.2260.80 4 5 14.0360.68 24.9761.32 20.8960.86 25.4561.35 17.1860.52 20.3360.86 26.1761.55 F 4.39 0.6 1.29 1.02 1.25 0.69 5.39 p 0.0165* 0.6237 0.3072 0.4063 0.3208 0.5708 0.0074* gender F 18 12.5660.36 25.0360.54 20.9160.39 25.0760.43 16.6060.27 19.6760.42 22.8260.71 M 8 12.1960.35 24.2160.82 20.2060.41 25.2861.10 17.0160.49 18.3860.80 20.9260.49 F 0.15 0.51 0.12 0.88 2.46 2.48 0.51 p 0.702 0.4858 0.7286 0.3612 0.1331 0.1316 0.4827 PD patients age 1 8 11.6560.54 25.9360.72 23.6060.69 27.1460.82 15.8160.49 18.4460.46 20.3460.90 (n = 27) 2 5 12.1260.70 25.8761.61 22.2760.61 27.4362.24 17.2560.61 18.2060.51 22.6361.50 3 7 12.3460.62 24.0760.53 21.1160.64 25.4460.89 16.3460.46 18.4060.70 22.0961.07 4 7 11.5460.87 25.0761.19 23.3260.76 28.2661.08 15.2960.55 22.3361.17 24.9161.46 F 0.22 0.07 1.26 1.32 3.08 4.4 1.76 p 0.8787 0.9753 0.3225 0.3028 0.0575 0.0194* 0.1944 gender F 14 12.1560.48 24.1860.44 22.5460.61 25.5460.50 16.0060.36 19.3760.74 22.2360.97 M 13 11.6160.47 26.3360.81 22.7460.48 28.6660.94 16.1760.44 19.4260.71 22.5960.93 F 0,01 1,52 0,1 2,12 0,6 0,57 1,54 p 0,9081 0,2361 0,7576 0,1649 0,4506 0,4625 0,2327 diseases duration 1 10 11.8360.53 25.5460.74 22.6460.71 26.7160.51 15.3660.38 18.6560.80 22.0961.32 2 9 11.4060.46 25.5561.02 23.1260.54 26.4860.79 16.6160.37 20.5760.92 22.8661.13 3 8 12.5160.74 24.4460.80 22.0760.77 28.0961.74 16.3960.65 18.9960.82 22.2960.99 F 0.17 0.74 0.02 2.02 3.16 1.02 1.37 p 0.8464 0.4936 0.983 0.1647 0.0696 0.3831 0.282 Hoehn and Yahr 1 9 11.8160.58 24.3160.47 22.2360.79 26.6860.50 15.8360.43 18.7860.97 21.8561.39
2 9 11.5460.43 26.3360.70 23.1260.48 27.7860.93 16.0660.41 19.7360.64 22.3260.85 3 9 13.3460.89 22.8560.73 21.6260.98 24.9961.55 16.6660.76 19.3461.62 23.8361.71 F 1.98 2.37 0.15 0.43 1.09 0.07 1.01 p 0.1708 0.1257 0.8614 0.6598 0.3594 0.9285 0.3875 UPDRS III 1 8 12.4060.54 25.6560.88 23.0560.82 27.0761.51 16.4960.97 19.9660.87 22.8961.16 2 10 11.9960.51 25.6360.74 22.6460.65 27.0560.57 15.7960.47 18.0460.29 20.9561.05 3 9 11.3160.67 24.3760.95 22.2560.59 27.0061.13 16.0360.58 20.3961.15 23.5861.16 F 1.21 0.35 0.03 0.18 0.71 1 0.96 p 0.3227 0.7077 0.9674 0.8399 0.5077 0.3883 0.4034 n = number of subjects. Age was divided into quartiles (q) (the classes for controls being 42–49, 50–53, 54–67, 68–76; for PD patients 42–49, 50–59, 60–68, 69–78) and disease duration, Hoehn and Yahr stage and UPDRS III in terciles (t) (the classes for disease duration being 1–3, 4–6, 7–21; for HY 1–1.5, 2, 2.5–4; for UPDRS III 4–7.5, 8– 12.5, 13–40).
GM = gray matter; GP = Globus Pallidus; SNc = Substantia nigra pars compacta; SNr = Substantia nigra pars reticulata; WM = white matter; rPut = rostral putamen; cPut = caudal putamen.
*p,0.05; analysis of variance (ANOVA). Post-hoc multiple comparisons (Tukey test) showed in the three cases that the difference was significant between the three first quartiles and the fourth.
doi:10.1371/journal.pone.0057904.t002
Figure 2. R2* (s21) at t0 in each ROI (mean± standard error) in PD patients and controls. GM = gray matter; GP = Globus Pallidus;
SNc = Substantia nigra pars compacta; SNr = Substantia nigra pars reticulata; WM = white matter; rPut = rostral putamen; cPut = caudal putamen. **: p,0.001; *: p,0.05; analysis of variance (ANOVA).
doi:10.1371/journal.pone.0057904.g002
Figure 3. DR2* (s21) in each ROI (mean± standard error). A negative DR2*corresponds to a decrease of R2* after three years follow-up,
whereas a positive DR2* corresponds to an increase of R2*. GM = gray matter; GP = Globus Pallidus; SNc = Substantia nigra pars compacta;
SNr = Substantia nigra pars reticulata; WM = white matter; rPut = rostral putamen; cPut = caudal putamen. **: p,0.01; *: p,0.05 (significance of DR2*
by group, signed rank test). ##: p,0.01; #: p,0.05 (effect of Parkinson’s disease on R2*, ANOVA).
parts of the SN, few works have dealt with them separately. Only Martin et al. [5] analyzed these two structures, reporting an increase of R2* limited to the lateral part of the SNc, whereas we
found a significant increase of R2* in both parts. This
inconsis-tency could be explained by a different duration of the disease, 3 years on average in the study by Martin et al. instead of 6 years in our study. In addition, the lack of contrast between the two parts of the SN in the MR images must be emphasized, which introduces uncertainty in ROI positioning and thus may contribute to the differences between the two studies [24]. It should be noted, however, that we used the same method as Martin et al. to place the ROI in the 2 parts of the SN. We did not find any difference between less and most affected sides in the SN whereas a correlation between the lateralized UPDRS motor scores from the clinically most affected side and R2* values from
the opposite SN was shown in early PD [5]. These differences could again be explained by the longer disease duration of our patients, leading to mainly symmetrical motor signs. Finally we showed no effect of disease duration and HY stage on R2*
according to the literature [4,5,7,9,25]. There is considerable heterogeneity in the rate of progression of PD, which can be influenced by clinical, genetic and external factors, the relative contribution of these factors which remain incompletely under-stood [26,27]. This interindividual variability in terms of rate of disease progression may explain why our cross-sectional study is insufficient to demonstrate a link between the variables which had been assessed (UPDRS, HY stage and disease evolution) and the R2*. This fact emphasizes the need to perform an individual and
longitudinal approach to assess R2* as a biomarker of disease
progression, the patient being his own control.
In the controls, we found an effect of age on R2* in the putamen
(significant in the caudal part) and GM, with an increase in elderly subjects, in agreement with other cross-sectional studies [15– 17,28]. We also observed an increase of R2* with age in the
putamen of PD patients, with results reaching significance only in the rostral part.
Longitudinal Analysis
In PD patients, in which both aging and disease evolution are involved in the change of iron content estimated with R2*,
longitudinal follow-up is the best way of taking these two factors into account. Thus it is likely that the disease itself is the main explanation for the rapid increase of R2* in the SN because no
change of R2* due to aging was observed in this structure in the
control group. In the caudal putamen, although cross-sectional analysis showed higher R2* in older controls, the longitudinal
follow-up did not highlight any significant evolution over three years, demonstrating the predominant role of PD in increasing R2* in this structure.
The significant variation of R2* over a short period in structures
involved in the physiopathology of PD [29], underlines the sensitivity of this parameter to disease evolution, since the HY stage and UPDRS used to evaluate the severity of the disease were significantly exacerbated over this same period of 3 years. Interestingly, we also found a positive correlation between DR2*
and DUPDRS in SN, providing an additional argument in favor of DR2* as a biomarker of disease progression.
As the variation of R2* is essentially linked to modifications of
iron content, our results suggest rapid accumulation of iron in the SN and the cPut during disease evolution. This rapid accumula-tion, particularly in the SN, suggests that iron plays a role in neuronal death mechanisms, in addition to its role as a vulnerability factor described by certain authors [13].
Several hypotheses [30] have been evoked to explain the increase of iron in the SN of PD patients, such as increased penetration of iron in dopaminergic neurons [31–33] and microglial activation [34,35]. The migration of microglial cells in
Figure 4. Correlation between DR2* and disease worsening. Scatter plot of the correlation between DR2* (s21) and DUPDRS (%) in SNc
showing a positive correlation (Spearman, R = 0.586, p = 0.028). doi:10.1371/journal.pone.0057904.g004
the SN, which represents a normal immune response to the degenerative process, could also participate in maintaining this process [35]. At the pathophysiological level, iron participates in the degenerative process as it contributes to the generation of reactive oxygen species inducing oxidative stress [36]. Works on animal models [37] show that the death of dopaminergic neurons precedes iron accumulation. Thus iron may not play a role in the initiation of the degenerative process but its increase as the disease worsening could indicate an important mechanism ensuring its persistence.
However, it is likely that the variations of R2* observed in this
study do not exclusively reflect those of iron concentration. Indeed, the R2* relaxometry method worked well in brain tissues
studied post mortem [29], but correlations observed between R2*
and iron concentration was weaker in vivo [30,31]. A large amount of R2is non-iron dependent which makes R2* (R2* = R2+
R2’) sensitive to the neurodegenerative process that affects water
content [38]. Furthermore, R2’ is very sensitive to brain
oxygenation [39] and the arrangement at cellular scale of tissue constituents having different magnetic susceptibilities [18]. Thus we cannot discard the possibility that vascular or microstructural modifications of basal ganglia during the evolution of PD could participate in variations of R2* mainly due to iron accumulation.
However, vascular involvement seems unlikely in our subjects, since we did not find any vascular lesion on MRI.
Lastly, we found a reduction of R2* in the WM of PD evaluated
at 7.5% over 3 years, a point that has not yet been studied in PD. Siemonsen et al. [17], demonstrated a decrease of R2* correlated
with normal aging, which could be linked with structural modifications of white matter described in elderly subjects, such as demyelination and axonal changes [17]. Interestingly, the
decrease of R2* tended to be significant in our control group.
Moreover, no difference was found between PD and controls in longitudinal follow-up. These two last points lead us to presume that age plays a predominant role in explaining the variations of R2* in the frontal WM observed in our PD patients.
In conclusion, we showed that a significant increase of R2* was
observed longitudinally in substantia nigra and caudal putamen of PD patients, and correlated with clinical markers of disease worsening, emphasizing its interest as a biomarker of the disease’s evolution. The result of this longitudinal follow-up, collected from only 18 controls and 14 PD patients, asks to be confirmed on a larger cohort.
Our results suggest that such quantitative MRI relaxometry could be an interesting tool for an individual assessment of the progression of the neurodegeneration due to PD, and it would also be interesting for testing the efficiency of specific iron chelators and disease-modifying treatments. Finally, the sensitivity of relaxation rates to iron content is known to increase with the resonance frequency [20]. Consequently, the magnitude of R2*
variations, over three years, which have been highlighted here at 1.5 T, would be presumably greater with higher magnetic field strength. This provides an opportunity to reduce the follow-up period separating two R2* measurements, a point which deserves
further studies.
Author Contributions
Conceived and designed the experiments: MU JMB FD. Performed the experiments: MU IR BC. Analyzed the data: MU JMB LO. Contributed reagents/materials/analysis tools: MU JMB. Wrote the paper: MU JMB LO FD.
References
1. Dexter DT, Carayon A, Javoy-Agid F, Agid Y, Wells FR, et al. (1991) Alterations in the levels of iron, ferritin and other trace metals in Parkinson’s disease and other neurodegenerative diseases affecting the basal ganglia. Brain 114 (Pt 4): 1953–1975.
2. Bartzokis G, Cummings JL, Markham CH, Marmarelis PZ, Treciokas LJ, et al. (1999) MRI evaluation of brain iron in earlier- and later-onset Parkinson’s disease and normal subjects. Magn Reson Imaging 17: 213–222.
3. Baudrexel S, Nurnberger L, Rub U, Seifried C, Klein JC, et al. (2010) Quantitative mapping of T1 and T2* discloses nigral and brainstem pathology in early Parkinson’s disease. Neuroimage 51: 512–520.
4. Gorell JM, Ordidge RJ, Brown GG, Deniau JC, Buderer NM, et al. (1995) Increased iron-related MRI contrast in the substantia nigra in Parkinson’s disease. Neurology 45: 1138–1143.
5. Martin WR, Wieler M, Gee M (2008) Midbrain iron content in early Parkinson disease: a potential biomarker of disease status. Neurology 70: 1411–1417. 6. Michaeli S, Oz G, Sorce DJ, Garwood M, Ugurbil K, et al. (2007) Assessment of
brain iron and neuronal integrity in patients with Parkinson’s disease using novel MRI contrasts. Mov Disord 22: 334–340.
7. Peran P, Cherubini A, Assogna F, Piras F, Quattrocchi C, et al. (2010) Magnetic resonance imaging markers of Parkinson’s disease nigrostriatal signature. Brain 133: 3423–3433.
8. Behnke S, Schroeder U, Dillmann U, Buchholz HG, Schreckenberger M, et al. (2009) Hyperechogenicity of the substantia nigra in healthy controls is related to MRI changes and to neuronal loss as determined by F-Dopa PET. Neuroimage 47: 1237–1243.
9. Graham JM, Paley MN, Grunewald RA, Hoggard N, Griffiths PD (2000) Brain iron deposition in Parkinson’s disease imaged using the PRIME magnetic resonance sequence. Brain 123 Pt 12: 2423–2431.
10. Ryvlin P, Broussolle E, Piollet H, Viallet F, Khalfallah Y, et al. (1995) Magnetic resonance imaging evidence of decreased putamenal iron content in idiopathic Parkinson’s disease. Arch Neurol 52: 583–588.
11. Wallis LI, Paley MN, Graham JM, Grunewald RA, Wignall EL, et al. (2008) MRI assessment of basal ganglia iron deposition in Parkinson’s disease. J Magn Reson Imaging 28: 1061–1067.
12. Kosta P, Argyropoulou MI, Markoula S, Konitsiotis S (2006) MRI evaluation of the basal ganglia size and iron content in patients with Parkinson’s disease. J Neurol 253: 26–32.
13. Bartzokis G, Tishler TA, Lu PH, Villablanca P, Altshuler LL, et al. (2007) Brain ferritin iron may influence age- and gender-related risks of neurodegeneration. Neurobiol Aging 28: 414–423.
14. Hallgren B, Sourander P (1958) The effect of age on the nonhaem iron in the human brain. J Neurochem 3: 41–51.
15. Martin WR, Roberts TE, Ye FQ, Allen PS (1998) Increased basal ganglia iron in striatonigral degeneration: in vivo estimation with magnetic resonance. Can J Neurol Sci 25: 44–47.
16. Xu X, Wang Q, Zhang M (2008) Age, gender, and hemispheric differences in iron deposition in the human brain: an in vivo MRI study. Neuroimage 40: 35– 42.
17. Siemonsen S, Finsterbusch J, Matschke J, Lorenzen A, Ding XQ, et al. (2008) Age-dependent normal values of T2* and T29 in brain parenchyma. AJNR Am J Neuroradiol 29: 950–955.
18. Yablonskiy DA, Haacke EM (1994) Theory of NMR signal behavior in magnetically inhomogeneous tissues: the static dephasing regime. Magn Reson Med 32: 749–763.
19. Ma J, Wehrli FW (1996) Method for image-based measurement of the reversible and irreversible contribution to the transverse-relaxation rate. J Magn Reson B 111: 61–69.
20. Gelman N, Gorell JM, Barker PB, Savage RM, Spickler EM, et al. (1999) MR imaging of human brain at 3.0 T: preliminary report on transverse relaxation rates and relation to estimated iron content. Radiology 210: 759–767. 21. Gibb WR, Lees AJ (1988) The relevance of the Lewy body to the pathogenesis of
idiopathic Parkinson’s disease. J Neurol Neurosurg Psychiatry 51: 745–752. 22. Thobois S (2006) Proposed dose equivalence for rapid switch between dopamine
receptor agonists in Parkinson’s disease: a review of the literature. Clin Ther 28: 1–12.
23. Fahn S, Elton RL, and Members of the UPDRS development committee. (1987) Recent Developments in Parkinson’s Disease; In S. Fahn CDM, D.B. Calne and M. Goldstein (Eds.), editor. Florham Park (NJ): Macmillan Healthcare Information. 153–163.
24. Eapen M, Zald DH, Gatenby JC, Ding Z, Gore JC (2011) Using high-resolution MR imaging at 7 T to evaluate the anatomy of the midbrain dopaminergic system. AJNR Am J Neuroradiol 32: 688–694.
25. Du G, Lewis MM, Styner M, Shaffer ML, Sen S, et al. (2011) Combined R2* and diffusion tensor imaging changes in the substantia nigra in Parkinson’s disease. Mov Disord 26: 1627–1632.
26. Evans JR, Mason SL, Williams-Gray CH, Foltynie T, Brayne C, et al. (2011) The natural history of treated Parkinson’s disease in an incident, community based cohort. J Neurol Neurosurg Psychiatry 82: 1112–1118.
27. Jankovic J, Kapadia AS (2001) Functional decline in Parkinson disease. Arch Neurol 58: 1611–1615.
28. Bartzokis G, Beckson M, Hance DB, Marx P, Foster JA, et al. (1997) MR evaluation of age-related increase of brain iron in young adult and older normal males. Magn Reson Imaging 15: 29–35.
29. Agid Y (1991) Parkinson’s disease: pathophysiology. Lancet 337: 1321–1324. 30. Gerlach M, Double KL, Youdim MB, Riederer P (2006) Potential sources of
increased iron in the substantia nigra of parkinsonian patients. J Neural Transm Suppl: 133–142.
31. Hirsch EC (2006) Altered regulation of iron transport and storage in Parkinson’s disease. J Neural Transm Suppl: 201–204.
32. Kortekaas R, Leenders KL, van Oostrom JC, Vaalburg W, Bart J, et al. (2005) Blood-brain barrier dysfunction in parkinsonian midbrain in vivo. Ann Neurol 57: 176–179.
33. Salazar J, Mena N, Hunot S, Prigent A, Alvarez-Fischer D, et al. (2008) Divalent metal transporter 1 (DMT1) contributes to neurodegeneration in animal models of Parkinson’s disease. Proc Natl Acad Sci U S A 105: 18578–18583. 34. Connor JR, Boeshore KL, Benkovic SA, Menzies SL (1994) Isoforms of ferritin
have a specific cellular distribution in the brain. J Neurosci Res 37: 461–465.
35. Hirsch EC, Hunot S (2009) Neuroinflammation in Parkinson’s disease: a target for neuroprotection? Lancet Neurol 8: 382–397.
36. Zecca L, Youdim MB, Riederer P, Connor JR, Crichton RR (2004) Iron, brain ageing and neurodegenerative disorders. Nat Rev Neurosci 5: 863–873. 37. He Y, Thong PS, Lee T, Leong SK, Mao BY, et al. (2003) Dopaminergic cell
death precedes iron elevation in MPTP-injected monkeys. Free Radic Biol Med 35: 540–547.
38. Mitsumori F, Watanabe H, Takaya N (2009) Estimation of brain iron concentration in vivo using a linear relationship between regional iron and apparent transverse relaxation rate of the tissue water at 4.7 T. Magn Reson Med 62: 1326–1330.
39. Punwani S, Cooper CE, Clemence M, Penrice J, Amess P, et al. (1997) Correlation between absolute deoxyhaemoglobin [dHb] measured by near infrared spectroscopy (NIRS) and absolute R2’ as determined by magnetic resonance imaging (MRI). Adv Exp Med Biol 413: 129–137.