HAL Id: inserm-02865968
https://www.hal.inserm.fr/inserm-02865968
Submitted on 24 May 2021
HAL is a multi-disciplinary open access
archive for the deposit and dissemination of
sci-entific research documents, whether they are
pub-lished or not. The documents may come from
teaching and research institutions in France or
abroad, or from public or private research centers.
L’archive ouverte pluridisciplinaire HAL, est
destinée au dépôt et à la diffusion de documents
scientifiques de niveau recherche, publiés ou non,
émanant des établissements d’enseignement et de
recherche français ou étrangers, des laboratoires
publics ou privés.
Rare variant association testing in the non-coding
genome
Ozvan Bocher, Emmanuelle Génin
To cite this version:
Ozvan Bocher, Emmanuelle Génin. Rare variant association testing in the non-coding genome. Human
Genetics, Springer Verlag, In press, Online ahead of print. �10.1007/s00439-020-02190-y�.
�inserm-02865968�
Rare variant association testing in the non-coding genome
Bocher Ozvan
1, Génin Emmanuelle
1,21
Univ Brest, Inserm, EFS, UMR1078, GGB, Brest, France
2CHU Brest, France
Keywords: Rare variants, non-coding genome, association tests, WGS, pathogenicity scores
Address for correspondence
Inserm UMR1078, Génétique, Génomique fonctionnelle et Biotechnologies
Faculté de Médecine
Bâtiment E – IBRBS 2ieme étage
22 avenue Camille Desmoulins
F-29238 BREST Cedex 3
Abstract
The development of next-generation sequencing technologies has opened-up some new possibilities to explore the contribution of genetic variants to human diseases and in particular that of rare variants. Statistical methods have been developed to test for association with rare variants that require the definition of testing units and, in these testing units, the selection of qualifying variants to include in the test. In the coding regions of the genome, testing units are usually the different genes and qualifying variants are selected based on their functional effects on the encoded proteins. Extending these tests to the non-coding regions of the genome is challenging. Testing units are difficult to define as the non-coding genome organisation is still rather unknown. Qualifying variants are difficult to select as the functional impact of non-coding variants on gene expression is hard to predict. These difficulties could explain why very few investigators so far have analysed the non-coding parts of their whole genome sequencing data. These non-coding parts yet represent the vast majority of the genome and some studies suggest that they could play a major role in disease susceptibility. In this review, we discuss recent experimental and statistical developments to gain knowledge on the non-coding genome and how this knowledge could be used to include rare non-coding variants in association tests. We describe the few studies that have considered variants from the non-coding genome in association tests and how they managed to define testing units and select qualifying variants.
Introduction
The development of high throughput genome sequencing technologies has opened-up new perspectives in the study of human diseases, including common diseases (Petersen et al. 2017), with the possibility to explore the full range of variant allele frequencies. Indeed, genome-wide association studies (GWAS) that were conducted before the sequencing era using SNP-chip data only explored the role of common genetic variants on disease susceptibility. With sequencing data, it is now possible to study the role played by rare variants and to explore the common disease multiple rare variants paradigm (Saint Pierre and Génin 2014). Under this paradigm, it is anticipated that different rare genetic variants located within one or a few genes could contribute to disease susceptibility with stronger effects than common variants. To test this hypothesis, novel association tests were developed to analyse exome data that, rather than testing each variant individually, group them by gene and test whether there is an enrichment in rare variants among cases or controls (Lee et al. 2014; Weissenkampen et al. 2019). The power of these tests depends on how qualifying variants are selected and how they are binned into testing units. Indeed, to be powerful, rare variant association tests require the selection of variants that are likely to have an effect on protein function or expression and their grouping into relevant genomic units (Povysil et al. 2019). The first rare variant association studies focused on the exome with rare variants selected based on the prediction of their impact on the protein, leaving out variants that were synonymous or predicted neutral. The testing unit was usually the gene but some studies have also considered groups of genes within a pathway (see for example Allen et al.(2017) or Shivakumar et al.(2019)) or sub-regions of a gene like exons or those encoding for specific protein functional domains (see for example Richardson et al.(2016b)). However, exomes only represent less than 2% of the genome and whole genome sequence (WGS) data are now becoming more easily available offering possibilities to explore the role of genomic variants located in the non-coding genome. This non-coding genome is enriched in regulatory elements involved in the control of gene expression and about 88% of the common variants found associated with common diseases fall in the non-coding genome (Hindorff et al. 2009). It is thus desirable to extend rare variant association tests to the non-coding genome. This is however not trivial with major challenges to be faced (Kosmicki et al. 2016). First, it is more difficult to predict the functional effect of non-coding variants as they are less likely to have strong effects on gene expression than protein-coding variants (Povysil et al. 2019), and tools to predict their effects still need to be evaluated. Second, it is also more difficult to decide on the genomic regions to group variants as the non-coding genome organisation is not as well understood as the coding genome where genes appear as natural testing units. All these limitations explain why in most cases all the potential of WGS data is not fully exploited and rare variant association testing is only performed on the exonic parts or candidate regions of WGS data. Scanning the non-coding genome for rare variants is yet important as variants in this part of the genome have been shown to play an important role in different human diseases (Zhang and Lupski 2015). In this paper, we review the current possibilities and questions raised by the analysis of WGS data. Challenges concerning variant detection and interpretation were recently reviewed by Lappalainen et al.(2019). Here, we take a different perspective and focus on rare variant association tests and the different strategies to group rare variants into testing units and to select qualifying variants within these units.
The non-coding genome
Organisation of the non-coding genome
Knowledge about the organisation of the non-coding genome has been rapidly growing these last years with the development of multiple projects and molecular techniques (for a recent review, see Sati and Cavalli (2017) and for simplified schematic view, see Figure 1). Among them, techniques that look at chromosome conformation and interactions between different loci have provided useful information. Among these techniques are 3C (Chromosome Conformation Capture) that looks at interactions between two genomic loci, 4C (Chromosome Conformation Capture-on-Chip) at interactions between one loci and all other genomic loci, and 5C (Chromosome Conformation Capture Carbon Copy) at interactions between all genomic loci in a given region. ChIA-PET (Chromatin Interaction Analysis by Paired-End Tag Sequencing) techniques also add information about the binding to DNA sequences of key proteins involved in the regulation of gene expression. It is indeed
now well established that gene expression is controlled by a balance between the joint action of enhancers and promoters increasing transcriptional activity, and silencers having an opposite effect (Kolovos et al. 2012), along with the action of many proteins that bind to these DNA regions. A number of studies have been conducted to describe enhancers and link them to their target genes, as enhancers do not necessarily control the nearest gene (Yao et al. 2015). Gasperini et al.(2020) recently reviewed biological techniques and recent developments enabling the discovery and characterisation of such enhancers. Several huge projects like FANTOM5 (Forrest et al. 2014) or ENCODE (Dunham et al. 2012) have described and annotated regulatory elements of the genome and contributed to the construction of public databases to share this knowledge. Thanks to these projects, we now have access to a huge amount of information about gene regulation which can be used to identify variants within key regulatory elements that could potentially be linked to diseases (Ma et al. 2015). Other projects such as the Roadmap Epigenomics Project (Bernstein et al. 2010) were developed to study epigenomics marks of the genome. These marks are very useful to define regulatory elements with, for example, the mono-methylation of the 4th lysine residue of the H3 histone (H3K4m1) being indicative of enhancers or its tri-methylation (H3K4m3) being indicative of promoters. Projects were also conducted to study gene expression in different tissues. The GTEx project (GTEx Consortium 2013) for example provides information on gene expression in different cell lines. It has enabled the identification of expression Quantitative Trait Loci (eQTL) that could be involved in human diseases (Albert and Kruglyak 2015). At a larger scale, the characterisation of the genome organisation or “3D genome” has also been possible using molecular techniques. For example, Hi-C techniques looking at all possible pairwise DNA fragments interactions, demonstrated that genome is organised into topologically associated domains (TADs) characterised by a much higher frequency of chromatin contacts. These large domains that encompass genes and their associated promoters and enhancers have been described as keys for the control of gene expression (Dixon et al. 2012). They are delineated by so-called insulators that are regions of 300 to 2000 bp containing binding sites for DNA-binding proteins. These insulators limit contact between TADs (Ong and Corces 2014) and lead to a compartmentalisation of gene expression that, if disrupted, could lead to wrong gene expression and diseases (Kleinjan and Coutinho 2009; Rao et al. 2014; Krijger and de Laat 2016; Spielmann and Mundlos 2016). For a more detailed review about the 3D organisation of the genome, see Bonev and Cavalli (2016). Taken together, experimental developments and huge projects to explore the non-coding genome have provided important insights into genome organisation and gene regulation (Elkon and Agami 2017; Delaneau et al. 2019) and suggested some novel disease mechanisms linked to gene expression disregulation (Krijger and de Laat 2016).
Pathogenicity scores
In addition to the description of the genome organisation, huge efforts have also been made to estimate the functionality of single-nucleotide variants (SNVs) in the non-coding genome, i.e. if they lead to changes in the regulation of gene expression, and their pathogenicity, i.e. if they lead to an increased risk of developing a disease. Several scores have been developed that are based on different information and different underlying models (for a review, see for example Nishizaki et al. (2017) who also proposed a framework to integrate these scores into GWAS analysis and Rojano et al. (2019) who presented different scores and provided details of molecular techniques to validate these predictions). Some of the scores focus on specific regulatory elements (SURF (Dong and Boyle 2019)), some are based on conservation (GERP++ (Cooper et al. 2005), Orion (Gussow et al. 2017), CDTS (di Iulio et al. 2018)), others on functional data (GWAS3D (Li et al. 2013), RegulomeDB (Boyle et al. 2012)), and there are also composite scores that integrate several of these information. Among the most commonly used composite scores is the CADD score (Rentzsch et al. 2019) that is based on 63 annotations including data from the ENCODE project, VEP annotation and GERP++ scores among others, and genetic simulations to assess the functional impact of variants. Other scores gathering multiple lines of biological evidences have also been developed with different underlying models such as random forest models (like for example GWAVA (Ritchie et al. 2014) or DeepSEA (Zhou and Troyanskaya 2015)) or machine learning models (like for example FATHMM-MKL (Shihab et al. 2015), DANN (Quang et al. 2015) or hyperSMURF (Schubach et al. 2017)). These models learn how to discriminate neutral from non-neutral variants using a “training set” composed of both functional/pathogenic variants (i.e., variants with known functional effects or described as pathogenic in databases such as Human Gene Mutation Database (HGMD)(Stenson et al. 2017) or Genome-Wide Repository of Associations Between SNPs and Phenotypes (GRASP)(Leslie et al. 2014)) and neutral
variants (i.e. variants found in reference populations such as 1000Genomes (Sudmant et al. 2015) or GnomAD (Lek et al. 2016) and not described as pathogenic). The performance of these scores is then assessed using another set of variants, the “testing set”, also containing known functional/pathogenic variants and neutral variants. Two statistical measures are usually computed: the sensibility or true positive rate (the proportion of functional/pathogenic variants that are correctly classified as such) and the specificity or true negative rate (the proportion of neutral variants that are correctly classified as such). Sensibility and specificity are computed for different threshold values of the scores and receiver operating characteristic (ROC) curves are constructed where the sensitivity is plotted against the false positive rate (1-specificity). Based on the ROC curve, the performance of a score can then be summarized using the Area Under the Curve (AUC) which can be interpreted as the probability that the score ranks a randomly chosen pathogenic variant higher than a randomly chosen neutral one. In some studies, rather than comparing scores based on AUC, other summary statistics are used such as, for example, the proportion of pathogenic variants among the top 10 percent of the scores or the difference of mean scores between the two types of variants. From one study to another, different scores are compared and results are not always concordant but there is not one score that seems to outperform all others. Some trends can however be highlighted regarding score performances: performances vary depending on the composition of the testing set of SNVs, on the region of the genome where tested variants are located and on their degree of evolutionary conservation. For example, Liu et al.(2017) showed that the ranking of scores depends on the number of SNVs in the testing set. They compared the performances of 23 scores to discriminate rare variants annotated as deleterious in the HGMD database (Stenson et al. 2017) from benign variants observed in the UK10K study (The UK10K Consortium 2015) using two testing sets. When using their first testing set composed of 2578 “deleterious non-protein coding SNVs” and 2578 “benign ones”, they found that the machine-learning based score FATHMM-MKL (Shihab et al. 2015) performed significantly better than all other scores with AUC above 0.80. However, when restricting the testing set to a subset of 196 deleterious SNVs and 196 benign SNVs, AUCs were different. FATHMM-MKL still outperformed other scores but it was not significantly better than some other scores based on the level of conservation. Moreover, most of the scores are not able to discriminate the pathogenicity of alternative alleles at the same position. This is well illustrated by Liu et al. (2019a) who contrasted variants commonly observed in human populations and not associated with any trait (their “non-pathogenic” set) and, at the same genomic positions, variants not observed in any species closely related to humans (that they considered as “pathogenic”). Using such matched sets of pathogenic and non-pathogenic alleles at the same genomic positions, they tested the performances of six commonly used prediction scores: CADD (Rentzsch et al. 2019), CATO (Maurano et al. 2015), DeepSEA (Zhou and Troyanskaya 2015), EIGEN (Ionita-Laza et al. 2016), GWAVA (Ritchie et al. 2014) and LINSIGHT (Huang et al. 2017). They found that most of the scores could not differentiate pathogenic versus non-pathogenic alleles located at the same position. Only two of the methods (CADD and DeepSea) gave different scores for the two types of variants but their AUCs were only 0.54 and 0.51 respectively. Scores tend to be similar for closely-located pathogenic and non-pathogenic SNVs and would therefore not be very efficient for the fine-mapping of causal variants. The methods have limited power to prioritize pathogenic non-coding SNVs when their proportion in the test set is small relative to non-pathogenic SNVs. However, differences were seen depending on the region of the genome. All scores performed better when the variant was located in ultra-conserved genomic regions. Differences were also observed depending on the type of functional elements: DeepSEA, GWAVA and LINSIGHT performed better with variants in promoters and CADD with intronic variants. In another study (Gunning et al. 2020), all scores were found to perform worse when, in the testing set, pathogenic variants were selected from diagnostic panels rather than among variants annotated as pathogenic in public databases. This could probably be explained by the fact that it is from these latter databases that most of the methods choose their training set. In the same idea, in the study from Liu et al.(2019a), the good performance of GWAVA with a 10:1 ratio of non-pathogenic versus pathogenic sites could at least partially be explained by the fact that 2/3 of the pathogenic variants in the testing set were also in the GWAVA training set. Zhang et al.(2019) confirmed the strong impact on score estimated performances of the composition of the training set. They found that the correlations were stronger between scores that use the same training set but, in general, correlations between scores were rather low. Since scores are based on different information (conservation, effect on gene expression, epigenetic marks, …), it was suggested that combining multiple scores could be a solution to improve variant classification as it will enable to get the advantage of each score and indeed, it was found that composite scores improve predictions over individual scores (see for example Dong et al.(2015)). Different methods were proposed to combine individual scores. The simplest way consists in running each score individually and then looking at the concordance of the results. This is the method recommended in the ACMG guidelines (Richards et al. 2015) but without any precision on which
scores should be used and how many of these scores should be concordant. However, this simple method was shown to perform much worse than methods that integrate different scores into a single model (Gunning et al. 2020). Several integrating methods have been proposed that use different scores and different models to combine them. For example, Zhang et al. (2019) recently proposed three models based on 23 scores to classify variants into three categories: predicting regulatory variants, pathogenic variants, and cancer-driver variants. For each category, a different training set of variants was used and scores were returned as PHRED-scaled scores varying between 0 and 100. Using Gradient Tree Boosting algorithms, an optimal combination of the 23 scores was selected for each of the three models.
Rare variant association tests (RVAT)
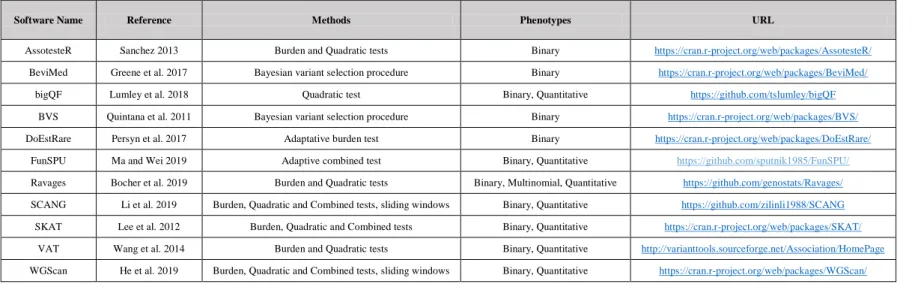
Different methods and software have been proposed in the literature to perform rare variant association tests (see Table 1 for a non exhaustive list of available software). These methods can be broadly divided into two groups: frequentist and Bayesian approaches.
Frequentist approaches
Frequentist approaches are based on the calculation of a statistic on observed data and its comparison to expectations under the null model of no genetic association. A p-value is computed that is the probability of observing a value of the statistic at least as extreme as the one observed on the data under the null. This p-value can be derived analytically when the theoretical distribution under the null hypothesis is known or, otherwise, estimated using random permutations of individual phenotypes (Epstein et al. 2012). Most rare variant association tests are frequentist tests and can be grouped into three types: (i) burden tests that rely on the comparison between cases and controls of genetic scores summarising the information from rare variants in the testing unit (examples include CAST (Morgenthaler and Thilly 2007), WSS (Madsen and Browning 2009), VT (Price et al. 2010) or DoEstRare (Persyn et al. 2017) among others); (ii) quadratic tests including variance-component tests that compare the distribution of variants’ genetic effects in the testing unit (C-alpha (Neale et al. 2011) or SKAT (Wu et al. 2011) for example); (iii) combined tests that search for the best combination between the two previous types of tests (SKAT-O (Lee et al. 2012) for the most commonly used). Burden tests are more powerful than variance-component tests when the rare variant effects in the testing unit are all in the same direction (either deleterious or protective) but they lack power when a mix of deleterious and protective variants are present. Simulation studies performed under realistic scenarios have found that rare variant association tests often lack power (Ladouceur et al. 2012; Derkach et al. 2014; Sung et al. 2014). An important driver of power was the ratio of causal versus non-causal variants in the studied genetic unit. To increase this ratio in whole exome sequence (WES) studies, qualifying variants are usually chosen among those with the highest predicted impact on the protein (i.e., the only variants kept are those annotated as transcript ablation, splice acceptor or donor, stop gained or lost, start lost, frameshift, inframe insertion or deletion, and missense). Frequentist approaches are implemented in software such as AssotesteR (Sanchez 2013), DoEstRare (Persyn et al. 2017), Ravages (Bocher et al. 2019), SKAT (Lee et al. 2012) or VAT (Wang et al. 2014).
Bayesian approaches
Bayesian approaches start from some prior probabilities that an association exists between the testing unit and the trait under study and modify these prior probabilities based on the observed data. Results are given as posterior probabilities, or Bayesian factors, representing the increase in probability from the prior knowledge to the posterior one. In the context of rare variant association tests, several Bayesian methods have been developed to measure the association between rare variants and a binary outcome (Quintana et al. 2011; Greene et al. 2017; Lin et al. 2017). The advantage of these proposed Bayesian methods over frequentist ones is that they do not require a pre-selection of qualifying variants but they use the data to identify the most likely causal variants (Lin et al. 2017) that are then given more weight in the analysis (Greene et al. 2017). Bayesian methods are therefore very attractive as they offer the possibility to prioritise variants based only on the observed data without the need of external information or assumption. External information could however be taken into account by modifying
prior probabilities associated to some variants as it will be discussed later in this review. Bayesian approaches are implemented in various R packages such as BeviMed (Greene et al. 2017) or BVS (Quintana et al. 2011).
RVAT in the non-coding genome
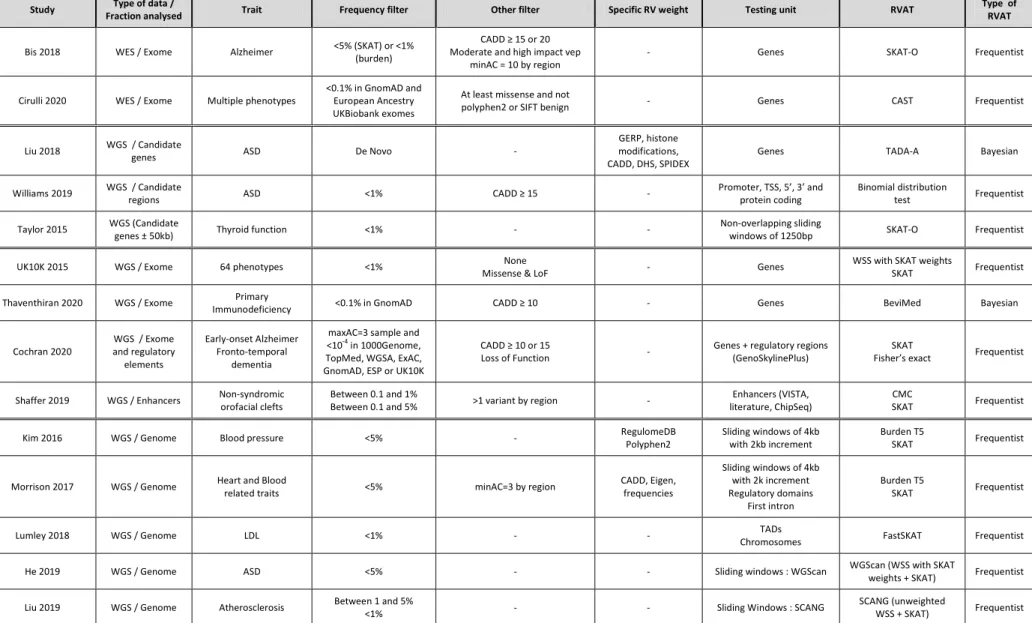
This section presents the different strategies proposed in the literature to test for association with rare variants located in the non-coding genome (see Figure 2 and Table 2 for a summary).
Choice of the testing unit
A first step in RVAT is to choose the testing unit in which rare variants will be grouped. As mentioned earlier, this task is particularly challenging in the non-coding genome as its organisation is not well defined. Different strategies have been used in the literature to define testing units either using functional annotations or agnostic methods based on sliding windows.
Using functional annotations
Some studies have defined genomic testing units in the non-coding genome using functional annotations available through the different genome annotation projects such as ENCODE described earlier. Variants in some regulatory elements have been shown to be enriched in different diseases and could explain a non-substantial part of heritability in complex traits (The UK10K Consortium 2015; Finucane et al. 2015). This approach however is often only applied to well-described regulatory elements such as introns, promoters, enhancers or silencers. Cochran et al.(2020) for example used a gene-centric approach on WGS data from early-onset Alzheimer’s disease and frontotemporal dementia. They grouped together coding variants in each gene and non-coding variants in their associated regulatory elements predicted by the GenoSkyline-Plus database (Lu et al. 2017). They found an association with TET2 in both diseases with an enrichment in loss-of-function and regulatory variants in patients. Interestingly, this association would have been missed if only the coding parts of the genes had been considered. Another example is the study performed by Shaffer et al. (Shaffer et al. 2019) where they looked for an accumulation of rare variants in enhancers in orofacial clefts phenotype using CMC (Li and Leal 2008) and SKAT (Wu et al. 2011) association tests. They grouped rare variants by enhancers that were defined using different sources including the VISTA database (Visel et al. 2007), results from ChIP-Seq studies and a literature search, and found an association with an enhancer near FOXP1. Rather than focusing only on one type of regulatory elements, it is also possible to integrate information on multiple regulatory elements to define testing units. This is illustrated in Morrison et al.(2017) where variants were grouped within large “regulatory domains” encompassing promoters and enhancers defined using the FANTOM5 project (Forrest et al. 2014) and gene 3’ and 5’ UTRs. At a larger scale than specific regulatory elements, other types of functional information can be used to group variants within genomic regions. In particular, TADs that were shown to be regions of co-regulation between genes and their regulatory elements could be relevant testing units for rare variant association tests (Dixon et al. 2012). However, the problem with the use of TADs as testing units is the fact that they cover large genomic regions. They can contain a very large number of variants that will be difficult to test using the available methods. Methodological development could then be needed as described in Lumley et al.(2018) who proposed an extension of SKAT.
Using sliding windows
While using well-described regulatory elements to group rare variants has the advantage of taking into account biological information, this strategy relies on current biological knowledge and available data. Therefore, it does not allow for an agnostic scan of the non-coding genome and the discovery of new regulatory variants associated to complex diseases. To solve this issue, sliding window approaches have been proposed. The idea behind these methods is to scan the genome by considering adjacent or overlapping regions in which RVAT are performed in order to detect hotspots of association with rare variants. Sliding-window approaches were used in several studies to analyse WGS data or candidate regions (Taylor et al. 2015; The UK10K Consortium 2015; Morrison et al. 2017). Windows are defined by choosing either a genomic length or a number of variants. They can be used to scan the whole genome or some selected regions of the genome only. For example, Vecchio-Pagán et al.(2016) when searching for cystic fibrosis modifier variants used the positions of the TAD encompassing the
sub-regions by using 5 kb sliding windows with a 1250 bp increment, resulting in 404 windows tested. Among them, some significant results were found, including a region of 13.8 kb associated with the tested phenotypes and interacting with the CFTR promoter. Another possibility to define relevant windows over the genome could consist in using linkage disequilibrium (LD) maps as defined by Maniatis et al. and recently revisited by Vergara-Lope et al. Rather than fixing window sizes in base pairs, one could then consider using LD units that, depending on the strength of LD in the genomic region, will encompass variable number of base pairs and variants. Such a strategy has not been used so far in rare variant association tests probably because rare variants are not expected to be in strong LD. There are also some results that suggest that LD blocks and chromatine domains do not usually coincide (Whalen and Pollard 2019). As the size and location of the optimal window is not a priori known, using fixed sizes could reduce power if the region of association is larger or smaller than the chosen window and it could also be of interest to use overlapping windows. Two similar approaches, WGScan (He et al. 2019) and SCANG (Li et al. 2019) were recently developed to scan the entire genome using overlapping windows of varying sizes. Both methods can accommodate burden and variance component tests and are available in R packages. They both proposed corrections to take into account the multiple testing issue. WGScan determines the minimum p-value that needs to be reached to achieve significance while controlling the family-wise error rate and declare as significant all the windows with a value lower than this minimum p-value. SCANG controls the family-wise error rate using Monte-Carlo simulations. WGScan was applied on WGS data from the Simons Simplex Collection study on autism spectrum disorders (Fischbach and Lord 2010) and detected an enrichment of promoter regions among the windows with the smallest p-values. SCANG was applied to WGS data from the Atherosclerosis Risk in Communities (ARIC) study and detected an association between LDL cholesterol and a region in the NECTIN2 gene. Interestingly, the same data were previously analysed by Morrison et al. (2017) with a fixed 4 kb-size sliding window procedure and this association could not be found as it involves two variants distant of more than 4kb.
Selection and prioritization of qualifying variants in the testing unit
Since the main driver of power in RVAT is the proportion of pathogenic variants in the testing unit, it is important to try to increase this proportion by selecting some subsets of variants or by giving more weight to some variants in association tests. Different criteria can be used to select and/or weight qualifying variants in RVAT.
Allele frequencies
A first criterion to select qualifying variants is the population frequency. Indeed, there is a correlation between variant frequency and effect with the rarest variants having the strongest effects. Deleterious variants are expected to be maintained at low frequency by negative selection (Gorlov et al. 2011), and a recent study (Kosmicki et al. 2017) confirmed that low frequencies in reference populations is a good proxy of functionality. Allele frequencies can be used to filter out common variants in association tests but also to weight the contribution of rare variants in test statistics such as WSS (Madsen and Browning 2009) or SKAT (Wu et al. 2011). An advantage of using allele frequencies to select or weight variants in RVAT is the fact that it could be applied to prioritise variants both in coding and non-coding regions of the genome. It is therefore appealing for the non-coding genome where other biological data such as pathogenicity scores are less reliable than in coding regions (Kim and Wei 2016). Frequencies can be either estimated on the study sample, or obtained from external reference panels such as 1000Genomes (Sudmant et al. 2015), TopMED (TopMED Program) or GnomAD (Lek et al. 2016) as done in several WES or WGS studies (see for example Thaventhiran et al.(2020) and Cirulli et al.(2020)). Allele frequencies computed on the study sample are more representative of the studied population but their use in association tests could lead to a dramatic loss of power if causal variants are present at high frequency in the group of cases. These causal variants could even be discarded from the analysis. Furthermore, if the sample size of the study is small, the allele frequency threshold would probably need to be increased to integrate more variants, and more importantly, the inclusion of a variant could change between two studies because of sampling fluctuations. In this situation, it would therefore be safer to use external frequencies from reference panels.
When allele frequencies are used to weight the contribution of variants in RVAT, the choice of the weighting scheme based on allele frequencies is not obvious. In many tests, a same weighting scheme which up-weights the rarer variants is used over the whole genome but this might not be optimal as shown by Minica et al. (2017). To
solve this issue, they proposed the use of a data-driven weighting procedure that can accommodate different hypotheses regarding the contribution of rare and common variants in the disease. They also investigated the robustness of RVAT to weight misspecification and showed that this does not lead to an increase of type-one error rates but to a reduction of power.
Pathogenicity scores
A second possibility to select qualifying variants, in addition to allele frequency filtering, is to make use of the pathogenicity scores described earlier. As for allele frequencies, these scores can be used in two different ways: (i) as filtering criteria to keep only potential causal variants into the statistical tests, an approach similar to what is performed in WES studies where the analysis is often restricted to non-synonymous variants; (ii) as a weight to enhance the contribution to the test of variants with a high probability of being functional.
Pathogenicity scores were found to clearly improve the selection of the most relevant qualifying variants within a gene in WES studies as shown for example by Richardson et al. (2016a) using CADD (Rentzsch et al. 2019) and FATHMM-MKL (Shihab et al. 2015) scores. The CADD score is by far the most commonly used pathogenicity score in both WES or WGS studies to filter rare variants kept in association tests (Bis et al. 2018; Thaventhiran et al. 2020; Cochran et al. 2020). Investigators only keep variants with a CADD score above a given threshold but this threshold can vary between studies. It is indeed difficult to choose a cut-off value and different cut-off values might be needed depending on the genomic region under study. Indeed, the distributions of CADD scores were found to vary substantially between protein-coding genes (Itan et al. 2016) and we can therefore expect even more variations in the non-coding genome. Other scores have also been used in some association studies but, as they are not always concordant at classifying variants, there is a major difficulty in choosing which scores should better be used to select the most relevant variants to be included in RVAT. Pathogenicity scores have also been used in existing RVAT to weight rare variants. Kim and Wei (2016) used for example RegulomeDB (Boyle et al. 2012) classes and Polyphen2 (Adzhubei et al. 2010) scores to weight variants in the burden test T5 and in SKAT (Wu et al. 2011). Morrison et al.(2017) used CADD (Rentzsch et al. 2019) and Eigen (Ionita-Laza et al. 2016) scores, both adjusted on the range of scores observed in the data, as direct weights of rare variants in the same two statistical tests. The two studies however reached different conclusions regarding the interest of weighting rare variants by functionality scores. Kim and Wei (2016) found associations that would have been missed without the weighting whereas Morrison et al.(2017) did not found an advantage of using their functionality scores into RVAT. It is however difficult to know if these differences are explained by the differences in the scores used.
More recently, other types of RVAT, referred to as adaptive, were developed that learn from the data and uses different functional annotations to select the best combinations of variants and the best weights. TADA-A (Liu et al. 2018) is an example of a Bayesian adaptive method that was developed to study de novo mutations in non-coding regions with prior information based on annotations from GERP++ (Cooper et al. 2005), CADD (Rentzsch et al. 2019) or histones marks. To select the most relevant annotations, a learning step is performed on the data with a relative risk computed for each functional annotation that is then used as prior. FunSPU (Ma and Wei 2019) is another adaptive method that considers multiple annotations and groups them or not depending on the heritability partitioned by functional annotation (Gusev et al. 2014). Some frequentist approaches were also developed to optimally select annotations in RVAT by combining, for example, p-values obtained with different annotations (Liu et al. 2019b). Posner et al.(2020) also recently proposed an extension of SKAT (Wu et al. 2011) to allow the inclusion of multiple functional annotations of variants using a convex combination of kernels to optimally weight the functional annotations. They showed that their proposed method gives higher weights to candidate variants previously described in G6PC2 as associated with fasting glucose, compared to SKAT classical weights that are only based on frequencies. The advantage of all these adaptive methods is that they enable the inclusion of information from multiple sources and select among them the most informative ones. Integrating such information into classical RVAT would require to combine them into a single weight or to choose between only one of them and to use the same weighting strategy in all testing units.
Other practical considerations
Significance threshold
When performing association tests at the scale of the entire genome, we are faced to a multiple testing issue that will require some new guidelines regarding which signal could be considered as significant. For RVAT performed on WES studies, a genome-wide significance level of 2.5 10-6 is usually considered that corresponds to a Bonferroni multiple test correction for the 20,000 genes (Kosmicki et al. 2016). On the non-coding genome, a similar approach can be used when the number of functional units tested is known. The question is more challenging when an agnostic scan of the genome is used with sliding windows. Indeed, when the whole genome is analysed, a huge number of windows are tested that can overlap, leading to non-independent tests. Using Bonferroni correction for all the tests performed will then be too conservative and could lead to a lack of power. To solve this issue, authors of WGScan (He et al. 2019) have proposed a method based on the moments of the test statistics to analytically compute the significance threshold at genome-wide level while accounting for the correlation among test statistics. In a similar manner, Monte-Carlo simulations are performed in SCANG (Li et al. 2019) to evaluate genome-wide significance and control for the number of non-independent tests performed. The question of the genome-wide significance level for WGS studies was also addressed by Xu et al. (2014). Depending on the test performed, they found that the significance thresholds can vary from 0.6 10-8 to 8.0 10-8. They showed that reliable estimates of empirical thresholds can be extrapolated from calculations performed on a small genomic region.
Combination of testing units
A major question when analysing the whole genome will be to know how to integrate the information from multiple genomic regions. Even when genomic regions can be defined using known functional elements such as enhancers and promoters, the following question is to determine if each regulatory element should be considered as a testing unit on its own or if they should be combined together into bigger testing units such as what was performed by Morrison et al. (2017). Indeed, if some genomic elements have been shown to interact together or to act in the same way, it could be of interest to consider them together. It is for example what was done by Duan et al. (2014) who, by considering together variants in promoters and enhancers separated from variants in insulators, found an association with promoters/enhancers that was missed when all information were considered together. It makes a biological sense to separate these two groups of regulatory regions as promoters and enhancers increase gene expression, while insulators act as barriers to prevent inappropriate gene expression. Williams et al. (2019) reached a similar conclusion when they found similar patterns of enrichment in associated variants between different regulatory elements. In the same idea, it is well known that some genes are regulated by multiple enhancers acting in a redundant way and it could therefore be expected that having a deleterious variant in any of these enhancers would have a similar impact on gene expression (Osterwalder et al. 2018). In this situation, considering all these enhancers as a single unit could be relevant. These different examples show that RVAT could gain power by leveraging biological information to group rare variants. The same question can be raised between regulatory sequences and their target genes. Indeed, some studies have shown that the effects of coding variants could be modified by the presence of regulatory variants (Li and Montgomery 2013; Castel et al. 2018). It could therefore be of interest to group together the coding variants from a gene with the variants in the gene regulatory elements with the problem that these genomic regions are usually not adjacent and could be far away from each other. Sliding windows which scan the genome linearly would thus not be appropriate. This connects with the problem of testing multiple genes implicated in the same biological pathway together to improve RVAT power. This is well illustrated in the study by Allen et al. (2017). They found no significant results when testing each gene individually because their epilepsy variants were spread over multiple genes that were all involved in the same biological pathway. It is only by studying the entire pathway that they could identify the causative variants.
Conclusions and perspectives
With advances in molecular techniques and bioinformatics, knowledge about genome organisation and gene regulation is expected to further increase in the next few years. This will hopefully lead to more reliable and concordant information about the functionality and potential pathogenicity of rare variants and their implication in the regulation of gene expression. If WGS data are getting more and more easily accessible, only very few studies so far have tested for association in the whole non-coding genome. In most WGS studies, only the exome or some candidate regions are considered in the association tests. Apart from the computational issues, this could be explained by the lack of methods and software to perform analyses in the non-coding genome where both the choice of testing units and the selection of qualifying variants into these testing units are challenging tasks. Development of new methods and analysis strategies with guidelines are therefore needed to analyse rare non-coding variants from WGS data. Using these methods, we could find more disease-specific regulatory mechanisms including those involved in differences in disease expression and clinical heterogeneity. We are therefore just at the beginning of WGS data exploration and guidelines will be needed to assess the significance of the findings and compare results from different studies. Moreover, as some methods would lead to the discovery of new regulatory signals involving regulatory elements never described before, the challenge will be to go beyond the associations and describe the mechanisms involved. New in-vivo assays, such as the ones developed by Kvon et al.(2020) to assess the pathogenic effect on gene expression of variants located in enhancers, could help to answer this issue. With both these novel methodological and technical developments, we can hope, in a near future, to reach a better understanding of the biological mechanisms involved in gene regulation and genome organisation and how their disturbance could lead to complex diseases.
Bibliography
Adzhubei IA, Schmidt S, Peshkin L, Ramensky VE, Gerasimova A, Bork P, Kondrashov AS, Sunyaev SR (2010) A method and server for predicting damaging missense mutations. Nat Methods 7:248–249 . https://doi.org/10.1038/nmeth0410-248
Albert FW, Kruglyak L (2015) The role of regulatory variation in complex traits and disease. Nat Rev Genet 16:197–212 . https://doi.org/10.1038/nrg3891
Allen AS, Bellows ST, Berkovic SF, Bridgers J, Burgess R, Cavalleri G, Chung S-K, Cossette P, Delanty N, Dlugos D, Epstein MP, Freyer C, Goldstein DB, Heinzen EL, Hildebrand MS, Johnson MR, Kuzniecky R, Lowenstein DH, Marson AG, Mayeux R, Mebane C, Mefford HC, O’Brien TJ, Ottman R, Petrou S, Petrovski S, Pickrell WO, Poduri A, Radtke RA, Rees MI, Regan BM, Ren Z, Scheffer IE, Sills GJ, Thomas RH, Wang Q, Abou-Khalil B, Alldredge BK, Amrom D, Andermann E, Andermann F, Bautista JF, Berkovic SF, Bluvstein J, Boro A, Cascino GD, Consalvo D, Crumrine P, Devinsky O, Dlugos D, Epstein MP, Fiol M, Fountain NB, French J, Freyer C, Friedman D, Geller EB, Glauser T, Glynn S, Haas K, Haut SR, Hayward J, Helmers SL, Joshi S, Kanner A, Kirsch HE, Knowlton RC, Kossoff EH, Kuperman R, Kuzniecky R, Lowenstein DH, Motika PV, Novotny EJ, Ottman R, Paolicchi JM, Parent JM, Park K, Poduri A, Sadleir LG, Scheffer IE, Shellhaas RA, Sherr EH, Shih JJ, Shinnar S, Singh RK, Sirven J, Smith MC, Sullivan J, Thio LL, Venkat A, Vining EPG, Von Allmen GK, Weisenberg JL, Widdess-Walsh P, Winawer MR (2017) Ultra-rare genetic variation in common epilepsies: a case-control sequencing study. Lancet Neurol 16:135–143 . https://doi.org/10.1016/S1474-4422(16)30359-3
Bernstein BE, Stamatoyannopoulos JA, Costello JF, Ren B, Milosavljevic A, Meissner A, Kellis M, Marra MA, Beaudet AL, Ecker JR, Farnham PJ, Hirst M, Lander ES, Mikkelsen TS, Thomson JA (2010) The NIH Roadmap Epigenomics Mapping Consortium. Nat Biotechnol 28:1045–1048 .
https://doi.org/10.1038/nbt1010-1045
Bis JC, Jian X, Kunkle BW, Chen Y, Hamilton-Nelson KL, Bush WS, Salerno WJ, Lancour D, Ma Y, Renton AE, Marcora E, Farrell JJ, Zhao Y, Qu L, Ahmad S, Amin N, Amouyel P, Beecham GW, Below JE, Campion D, Cantwell L, Charbonnier C, Chung J, Crane PK, Cruchaga C, Cupples LA, Dartigues J-F, Debette S, Deleuze J-F, Fulton L, Gabriel SB, Genin E, Gibbs RA, Goate A, Grenier-Boley B, Gupta N, Haines JL, Havulinna AS, Helisalmi S, Hiltunen M, Howrigan DP, Ikram MA, Kaprio J, Konrad J, Kuzma A, Lander ES, Lathrop M, Lehtimäki T, Lin H, Mattila K, Mayeux R, Muzny DM, Nasser W, Neale B, Nho K, Nicolas G, Patel D, Pericak-Vance MA, Perola M, Psaty BM, Quenez O, Rajabli F, Redon R, Reitz C, Remes AM, Salomaa V, Sarnowski C, Schmidt H, Schmidt M, Schmidt R, Soininen H, Thornton TA, Tosto G, Tzourio C, van der Lee SJ, van Duijn CM, Valladares O, Vardarajan B, Wang L-S, Wang W, Wijsman E, Wilson RK, Witten D, Worley KC, Zhang X, Alzheimer’s Disease Sequencing Project, Bellenguez C, Lambert J-C, Kurki MI, Palotie A, Daly M, Boerwinkle E, Lunetta KL, Destefano AL, Dupuis J, Martin ER, Schellenberg GD, Seshadri S, Naj AC, Fornage M, Farrer LA (2018) Whole exome sequencing study identifies novel rare and common Alzheimer’s-Associated variants involved in immune response and transcriptional regulation. Mol Psychiatry.
https://doi.org/10.1038/s41380-018-0112-7
Bocher O, Marenne G, Saint Pierre A, Ludwig TE, Guey S, Tournier‐ Lasserve E, Perdry H, Génin E (2019) Rare variant association testing for multicategory phenotype. Genet Epidemiol.
https://doi.org/10.1002/gepi.22210
Bonev B, Cavalli G (2016) Organization and function of the 3D genome. Nat Rev Genet 17:661–678 . https://doi.org/10.1038/nrg.2016.112
Boyle AP, Hong EL, Hariharan M, Cheng Y, Schaub MA, Kasowski M, Karczewski KJ, Park J, Hitz BC, Weng S, Cherry JM, Snyder M (2012) Annotation of functional variation in personal genomes using
RegulomeDB. Genome Res 22:1790–1797 . https://doi.org/10.1101/gr.137323.112
Castel SE, Cervera A, Mohammadi P, Aguet F, Reverter F, Wolman A, Guigo R, Iossifov I, Vasileva A, Lappalainen T (2018) Modified penetrance of coding variants by cis-regulatory variation contributes to disease risk. Nat Genet 50:1327–1334 . https://doi.org/10.1038/s41588-018-0192-y
Cirulli ET, White S, Read RW, Elhanan G, Metcalf WJ, Tanudjaja F, Fath DM, Sandoval E, Isaksson M, Schlauch KA, Grzymski JJ, Lu JT, Washington NL (2020) Genome-wide rare variant analysis for thousands of phenotypes in over 70,000 exomes from two cohorts. Nat Commun 11: .
https://doi.org/10.1038/s41467-020-14288-y
Cochran JN, Geier EG, Bonham LW, Newberry JS, Amaral MD, Thompson ML, Lasseigne BN, Karydas AM, Roberson ED, Cooper GM, Rabinovici GD, Miller BL, Myers RM, Yokoyama JS, Alzheimer’s Disease Neuroimaging Initiative (2020) Non-coding and Loss-of-Function Coding Variants in TET2 are Associated with Multiple Neurodegenerative Diseases. Am J Hum Genet 106:632–645 . https://doi.org/10.1016/j.ajhg.2020.03.010
Cooper GM, Stone EA, Asimenos G, Green ED, Batzoglou S, Sidow A (2005) Distribution and intensity of constraint in mammalian genomic sequence. Genome Res 15:901–913 .
https://doi.org/10.1101/gr.3577405
Delaneau O, Zazhytska M, Borel C, Giannuzzi G, Rey G, Howald C, Kumar S, Ongen H, Popadin K, Marbach D, Ambrosini G, Bielser D, Hacker D, Romano L, Ribaux P, Wiederkehr M, Falconnet E, Bucher P, Bergmann S, Antonarakis SE, Reymond A, Dermitzakis ET (2019) Chromatin three-dimensional interactions mediate genetic effects on gene expression. Science 364: .
https://doi.org/10.1126/science.aat8266
Derkach A, Lawless JF, Sun L (2014) Pooled Association Tests for Rare Genetic Variants: A Review and Some New Results. Stat Sci 29:302–321 . https://doi.org/10.1214/13-STS456
di Iulio J, Bartha I, Wong EHM, Yu H-C, Lavrenko V, Yang D, Jung I, Hicks MA, Shah N, Kirkness EF, Fabani MM, Biggs WH, Ren B, Venter JC, Telenti A (2018) The human noncoding genome defined by genetic diversity. Nat Genet 50:333–337 . https://doi.org/10.1038/s41588-018-0062-7
Dixon JR, Selvaraj S, Yue F, Kim A, Li Y, Shen Y, Hu M, Liu JS, Ren B (2012) Topological domains in mammalian genomes identified by analysis of chromatin interactions. Nature 485:376–380 . https://doi.org/10.1038/nature11082
Dong C, Wei P, Jian X, Gibbs R, Boerwinkle E, Wang K, Liu X (2015) Comparison and integration of deleteriousness prediction methods for nonsynonymous SNVs in whole exome sequencing studies. Hum Mol Genet 24:2125–2137 . https://doi.org/10.1093/hmg/ddu733
Dong S, Boyle AP (2019) Predicting functional variants in enhancer and promoter elements using RegulomeDB. Hum Mutat 40:1292–1298 . https://doi.org/10.1002/humu.23791
Duan J, Shi J, Fiorentino A, Leites C, Chen X, Moy W, Chen J, Alexandrov BS, Usheva A, He D, Freda J, O’Brien NL, McQuillin A, Sanders AR, Gershon ES, DeLisi LE, Bishop AR, Gurling HMD, Pato MT, Levinson DF, Kendler KS, Pato CN, Gejman PV, Gejman PV, Sanders AR, Duan J, Levinson DF, Shi J, Buccola NG, Mowry BJ, Freedman R, Olincy A, Amin F, Black DW, Silverman JM, Byerley WF, Svrakic DM, Cloninger CR, Pato MT, Sobell JL, Medeiros H, Abbott C, Skar B, Buckley PF, Bromet EJ, Escamilla MA, Fanous AH, Lehrer DS, Macciardi F, Malaspina D, McCarroll SA, Marder SR, Moran J, Morley CP, Nicolini H, Perkins DO, Purcell SM, Rapaport MH, Sklar P, Smoller JW, Knowles JA, Pato CN (2014) A Rare Functional Noncoding Variant at the GWAS-Implicated
MIR137/MIR2682 Locus Might Confer Risk to Schizophrenia and Bipolar Disorder. Am J Hum Genet 95:744–753 . https://doi.org/10.1016/j.ajhg.2014.11.001
Dunham I, Kundaje A, Aldred SF, Collins PJ, Davis CA, Doyle F, Epstein CB, Frietze S, Harrow J, Kaul R, Khatun J, Lajoie BR, Landt SG, Lee B-K, Pauli F, Rosenbloom KR, Sabo P, Safi A, Sanyal A, Shoresh N, Simon JM, Song L, Trinklein ND, Altshuler RC, Birney E, Brown JB, Cheng C, Djebali S, Dong X, Dunham I, Ernst J, Furey TS, Gerstein M, Giardine B, Greven M, Hardison RC, Harris RS, Herrero J, Hoffman MM, Iyer S, Kellis M, Khatun J, Kheradpour P, Kundaje A, Lassmann T, Li Q, Lin X, Marinov GK, Merkel A, Mortazavi A, Parker SCJ, Reddy TE, Rozowsky J, Schlesinger F, Thurman RE, Wang J, Ward LD, Whitfield TW, Wilder SP, Wu W, Xi HS, Yip KY, Zhuang J, Bernstein BE, Birney E, Dunham I, Green ED, Gunter C, Snyder M, Pazin MJ, Lowdon RF, Dillon LAL, Adams LB, Kelly CJ, Zhang J, Wexler JR, Green ED, Good PJ, Feingold EA, Bernstein BE, Birney E, Crawford GE, Dekker J, Elnitski L, Farnham PJ, Gerstein M, Giddings MC, Gingeras TR, Green ED, Guigó R,
Hardison RC, Hubbard TJ, Kellis M, Kent WJ, Lieb JD, Margulies EH, Myers RM, Snyder M,
Stamatoyannopoulos JA, Tenenbaum SA, Weng Z, White KP, Wold B, Khatun J, Yu Y, Wrobel J, Risk BA, Gunawardena HP, Kuiper HC, Maier CW, Xie L, Chen X, Giddings MC, Bernstein BE, Epstein CB, Shoresh N, Ernst J, Kheradpour P, Mikkelsen TS, Gillespie S, Goren A, Ram O, Zhang X, Wang L, Issner R, Coyne MJ, Durham T, Ku M, Truong T, Ward LD, Altshuler RC, Eaton ML, Kellis M, Djebali S, Davis CA, Merkel A, Dobin A, Lassmann T, Mortazavi A, Tanzer A, Lagarde J, Lin W, Schlesinger F, Xue C, Marinov GK, Khatun J, Williams BA, Zaleski C, Rozowsky J, Röder M, Kokocinski F, Abdelhamid RF, Alioto T, Antoshechkin I, Baer MT, Batut P, Bell I, Bell K,
Chakrabortty S, Chen X, Chrast J, Curado J, Derrien T, Drenkow J, Dumais E, Dumais J, Duttagupta R, Fastuca M, Fejes-Toth K, Ferreira P, Foissac S, Fullwood MJ, Gao H, Gonzalez D, Gordon A,
Gunawardena HP, Howald C, Jha S, Johnson R, Kapranov P, King B, Kingswood C, Li G, Luo OJ, Park E, Preall JB, Presaud K, Ribeca P, Risk BA, Robyr D, Ruan X, Sammeth M, Sandhu KS,
Schaeffer L, See L-H, Shahab A, Skancke J, Suzuki AM, Takahashi H, Tilgner H, Trout D, Walters N, Wang H, Wrobel J, Yu Y, Hayashizaki Y, Harrow J, Gerstein M, Hubbard TJ, Reymond A,
Antonarakis SE, Hannon GJ, Giddings MC, Ruan Y, Wold B, Carninci P, Guigó R, Gingeras TR, Rosenbloom KR, Sloan CA, Learned K, Malladi VS, Wong MC, Barber GP, Cline MS, Dreszer TR, Heitner SG, Karolchik D, Kent WJ, Kirkup VM, Meyer LR, Long JC, Maddren M, Raney BJ, Furey TS, Song L, Grasfeder LL, Giresi PG, Lee B-K, Battenhouse A, Sheffield NC, Simon JM, Showers KA, Safi A, London D, Bhinge AA, Shestak C, Schaner MR, Ki Kim S, Zhang ZZ, Mieczkowski PA, Mieczkowska JO, Liu Z, McDaniell RM, Ni Y, Rashid NU, Kim MJ, Adar S, Zhang Z, Wang T, Winter D, Keefe D, Birney E, Iyer VR, Lieb JD, Crawford GE, Li G, Sandhu KS, Zheng M, Wang P, Luo OJ, Shahab A, Fullwood MJ, Ruan X, Ruan Y, Myers RM, Pauli F, Williams BA, Gertz J, Marinov GK, Reddy TE, Vielmetter J, Partridge E, Trout D, Varley KE, Gasper C, The ENCODE Project
Consortium, Overall coordination (data analysis coordination), Data production leads (data production), Lead analysts (data analysis), Writing group, NHGRI project management (scientific management), Principal investigators (steering committee), Boise State University and University of North Carolina at Chapel Hill Proteomics groups (data production and analysis), Broad Institute Group (data production and analysis), Cold Spring Harbor U of G Center for Genomic Regulation, Barcelona, RIKEN, Sanger Institute, University of Lausanne, Genome Institute of Singapore group (data production and analysis), Data coordination center at UC Santa Cruz (production data coordination), Duke University E
University of Texas, Austin, University of North Carolina-Chapel Hill group (data production and analysis), Genome Institute of Singapore group (data production and analysis), HudsonAlpha Institute C UC Irvine, Stanford group (data production and analysis) (2012) An integrated encyclopedia of DNA elements in the human genome. Nature 489:57–74 . https://doi.org/10.1038/nature11247
Elkon R, Agami R (2017) Characterization of noncoding regulatory DNA in the human genome. Nat Biotechnol 35:732–746 . https://doi.org/10.1038/nbt.3863
Epstein MP, Duncan R, Jiang Y, Conneely KN, Allen AS, Satten GA (2012) A Permutation Procedure to Correct for Confounders in Case-Control Studies, Including Tests of Rare Variation. Am J Hum Genet 91:215–223 . https://doi.org/10.1016/j.ajhg.2012.06.004
Finucane HK, Bulik-Sullivan B, Gusev A, Trynka G, Reshef Y, Loh P-R, Anttila V, Xu H, Zang C, Farh K, Ripke S, Day FR, Consortium R, Purcell S, Stahl E, Lindstrom S, Perry JRB, Okada Y, Raychaudhuri S, Daly M, Patterson N, Neale BM, Price AL (2015) Partitioning heritability by functional annotation using genome-wide association summary statistics. Nat Genet 47:1228–1235 .
https://doi.org/10.1038/ng.3404
Fischbach GD, Lord C (2010) The Simons Simplex Collection: A Resource for Identification of Autism Genetic Risk Factors. Neuron 68:192–195 . https://doi.org/10.1016/j.neuron.2010.10.006
Forrest ARR, Kawaji H, Rehli M, Kenneth Baillie J, de Hoon MJL, Haberle V, Lassmann T, Kulakovskiy IV, Lizio M, Itoh M, Andersson R, Mungall CJ, Meehan TF, Schmeier S, Bertin N, Jørgensen M, Dimont E, Arner E, Schmidl C, Schaefer U, Medvedeva YA, Plessy C, Vitezic M, Severin J, Semple CA, Ishizu Y, Young RS, Francescatto M, Alam I, Albanese D, Altschuler GM, Arakawa T, Archer JAC, Arner P, Babina M, Rennie S, Balwierz PJ, Beckhouse AG, Pradhan-Bhatt S, Blake JA, Blumenthal A, Bodega B, Bonetti A, Briggs J, Brombacher F, Maxwell Burroughs A, Califano A, Cannistraci CV, Carbajo D, Chen Y, Chierici M, Ciani Y, Clevers HC, Dalla E, Davis CA, Detmar M, Diehl AD, Dohi T, Drabløs F, Edge ASB, Edinger M, Ekwall K, Endoh M, Enomoto H, Fagiolini M, Fairbairn L, Fang H, Farach-Carson MC, Faulkner GJ, Favorov AV, Fisher ME, Frith MC, Fujita R, Fukuda S, Furlanello C, Furuno
M, Furusawa J, Geijtenbeek TB, Gibson AP, Gingeras T, Goldowitz D, Gough J, Guhl S, Guler R, Gustincich S, Ha TJ, Hamaguchi M, Hara M, Harbers M, Harshbarger J, Hasegawa A, Hasegawa Y, Hashimoto T, Herlyn M, Hitchens KJ, Ho Sui SJ, Hofmann OM, Hoof I, Hori F, Huminiecki L, Iida K, Ikawa T, Jankovic BR, Jia H, Joshi A, Jurman G, Kaczkowski B, Kai C, Kaida K, Kaiho A, Kajiyama K, Kanamori-Katayama M, Kasianov AS, Kasukawa T, Katayama S, Kato S, Kawaguchi S, Kawamoto H, Kawamura YI, Kawashima T, Kempfle JS, Kenna TJ, Kere J, Khachigian LM, Kitamura T, Peter Klinken S, Knox AJ, Kojima M, Kojima S, Kondo N, Koseki H, Koyasu S, Krampitz S, Kubosaki A, Kwon AT, Laros JFJ, Lee W, Lennartsson A, Li K, Lilje B, Lipovich L, Mackay-sim A, Manabe R, Mar JC, Marchand B, Mathelier A, Mejhert N, Meynert A, Mizuno Y, de Lima Morais DA, Morikawa H, Morimoto M, Moro K, Motakis E, Motohashi H, Mummery CL, Murata M, Nagao-Sato S, Nakachi Y, Nakahara F, Nakamura T, Nakamura Y, Nakazato K, van Nimwegen E, Ninomiya N, Nishiyori H, Noma S, Nozaki T, Ogishima S, Ohkura N, Ohmiya H, Ohno H, Ohshima M, Okada-Hatakeyama M, Okazaki Y, Orlando V, Ovchinnikov DA, Pain A, Passier R, Patrikakis M, Persson H, Piazza S, Prendergast JGD, Rackham OJL, Ramilowski JA, Rashid M, Ravasi T, Rizzu P, Roncador M, Roy S, Rye MB, Saijyo E, Sajantila A, Saka A, Sakaguchi S, Sakai M, Sato H, Satoh H, Savvi S, Saxena A, Schneider C, Schultes EA, Schulze-Tanzil GG, Schwegmann A, Sengstag T, Sheng G, Shimoji H, Shimoni Y, Shin JW, Simon C, Sugiyama D, Sugiyama T, Suzuki M, Suzuki N, Swoboda RK, ’t Hoen PAC, Tagami M, Takahashi N, Takai J, Tanaka H, Tatsukawa H, Tatum Z, Thompson M, Toyoda H, Toyoda T, Valen E, van de Wetering M, van den Berg LM, Verardo R, Vijayan D, Vorontsov IE, Wasserman WW, Watanabe S, Wells CA, Winteringham LN, Wolvetang E, Wood EJ, Yamaguchi Y, Yamamoto M, Yoneda M, Yonekura Y, Yoshida S, Zabierowski SE, Zhang PG, Zhao X, Zucchelli S, Summers KM, Suzuki H, Daub CO, Kawai J, Heutink P, Hide W, Freeman TC, Lenhard B, Bajic VB, Taylor MS, Makeev VJ, Sandelin A, Hume DA, Carninci P, Hayashizaki Y, The FANTOM Consortium and the RIKEN PMI and CLST (DGT) (2014) A promoter-level mammalian expression atlas. Nature 507:462–470 . https://doi.org/10.1038/nature13182
Gasperini M, Tome JM, Shendure J (2020) Towards a comprehensive catalogue of validated and target-linked human enhancers. Nat Rev Genet. https://doi.org/10.1038/s41576-019-0209-0
Gorlov IP, Gorlova OY, Frazier ML, Spitz MR, Amos CI (2011) Evolutionary evidence of the effect of rare variants on disease etiology. Clin Genet 79:199–206 .
https://doi.org/10.1111/j.1399-0004.2010.01535.x
Greene D, Richardson S, Turro E (2017) A Fast Association Test for Identifying Pathogenic Variants Involved in Rare Diseases. Am J Hum Genet 101:104–114 . https://doi.org/10.1016/j.ajhg.2017.05.015 GTEx Consortium (2013) The Genotype-Tissue Expression (GTEx) project. Nat Genet 45:580–585 .
https://doi.org/10.1038/ng.2653
Gunning AC, Fryer V, Fasham J, Crosby AH, Ellard S, Baple E, Wright CF (2020) Assessing performance of pathogenicity predictors using clinically-relevant variant datasets. Genomics
Gusev A, Lee SH, Trynka G, Finucane H, Vilhjálmsson BJ, Xu H, Zang C, Ripke S, Bulik-Sullivan B, Stahl E, Kähler AK, Hultman CM, Purcell SM, McCarroll SA, Daly M, Pasaniuc B, Sullivan PF, Neale BM, Wray NR, Raychaudhuri S, Price AL, Ripke S, Neale BM, Corvin A, Walters JTR, Farh K-H, Holmans PA, Lee P, Bulik-Sullivan B, Collier DA, Huang H, Pers TH, Agartz I, Agerbo E, Albus M, Alexander M, Amin F, Bacanu SA, Begemann M, Belliveau RA, Bene J, Bergen SE, Bevilacqua E, Bigdeli TB, Black DW, Børglum AD, Bruggeman R, Buccola NG, Buckner RL, Byerley W, Cahn W, Cai G, Campion D, Cantor RM, Carr VJ, Carrera N, Catts SV, Chambert KD, Chan RCK, Chen RYL, Chen EYH, Cheng W, Cheung EFC, Chong SA, Cloninger CR, Cohen D, Cohen N, Cormican P, Craddock N, Crowley JJ, Curtis D, Davidson M, Davis KL, Degenhardt F, Del Favero J, DeLisi LE, Demontis D, Dikeos D, Dinan T, Djurovic S, Donohoe G, Drapeau E, Duan J, Dudbridge F, Durmishi N,
Eichhammer P, Eriksson J, Escott-Price V, Essioux L, Fanous AH, Farrell MS, Frank J, Franke L, Freedman R, Freimer NB, Friedl M, Friedman JI, Fromer M, Genovese G, Georgieva L, Gershon ES, Giegling I, Giusti-Rodrguez P, Godard S, Goldstein JI, Golimbet V, Gopal S, Gratten J, Grove J, de Haan L, Hammer C, Hamshere ML, Hansen M, Hansen T, Haroutunian V, Hartmann AM, Henskens FA, Herms S, Hirschhorn JN, Hoffmann P, Hofman A, Hollegaard MV, Hougaard DM, Ikeda M, Joa I, Julià A, Kahn RS, Kalaydjieva L, Karachanak-Yankova S, Karjalainen J, Kavanagh D, Keller MC, Kelly BJ, Kennedy JL, Khrunin A, Kim Y, Klovins J, Knowles JA, Konte B, Kucinskas V, Kucinskiene ZA, Kuzelova-Ptackova H, Kähler AK, Laurent C, Keong JLC, Lee SH, Legge SE, Lerer B, Li M, Li T,
Liang K-Y, Lieberman J, Limborska S, Loughland CM, Lubinski J, Lnnqvist J, Macek M, Magnusson PKE, Maher BS, Maier W, Mallet J, Marsal S, Mattheisen M, Mattingsdal M, McCarley RW,
McDonald C, McIntosh AM, Meier S, Meijer CJ, Melegh B, Melle I, Mesholam-Gately RI, Metspalu A, Michie PT, Milani L, Milanova V, Mokrab Y, Morris DW, Mors O, Mortensen PB, Murphy KC, Murray RM, Myin-Germeys I, Mller-Myhsok B, Nelis M, Nenadic I, Nertney DA, Nestadt G, Nicodemus KK, Nikitina-Zake L, Nisenbaum L, Nordin A, O’Callaghan E, O’Dushlaine C, O’Neill FA, Oh S-Y, Olincy A, Olsen L, Van Os J, Pantelis C, Papadimitriou GN, Papiol S, Parkhomenko E, Pato MT, Paunio T, Pejovic-Milovancevic M, Perkins DO, Pietilinen O, Pimm J, Pocklington AJ, Powell J, Price A, Pulver AE, Purcell SM, Quested D, Rasmussen HB, Reichenberg A, Reimers MA, Richards AL, Roffman JL, Roussos P, Ruderfer DM, Salomaa V, Sanders AR, Schall U, Schubert CR, Schulze TG, Schwab SG, Scolnick EM, Scott RJ, Seidman LJ, Shi J, Sigurdsson E, Silagadze T, Silverman JM, Sim K, Slominsky P, Smoller JW, So H-C, Spencer CCA, Stahl EA, Stefansson H, Steinberg S, Stogmann E, Straub RE, Strengman E, Strohmaier J, Stroup TS, Subramaniam M,
Suvisaari J, Svrakic DM, Szatkiewicz JP, Sderman E, Thirumalai S, Toncheva D, Tooney PA, Tosato S, Veijola J, Waddington J, Walsh D, Wang D, Wang Q, Webb BT, Weiser M, Wildenauer DB, Williams NM, Williams S, Witt SH, Wolen AR, Wong EHM, Wormley BK, Wu JQ, Xi HS, Zai CC, Zheng X, Zimprich F, Wray NR, Stefansson K, Visscher PM, Adolfsson R, Andreassen OA, Blackwood DHR, Bramon E, Buxbaum JD, Brglum AD, Cichon S, Darvasi A, Domenici E, Ehrenreich H, Esko T, Gejman PV, Gill M, Gurling H, Hultman CM, Iwata N, Jablensky AV, Jönsson EG, Kendler KS, Kirov G, Knight J, Lencz T, Levinson DF, Li QS, Liu J, Malhotra AK, McCarroll SA, McQuillin A, Moran JL, Mortensen PB, Mowry BJ, Nthen MM, Ophoff RA, Owen MJ, Palotie A, Pato CN, Petryshen TL, Posthuma D, Rietschel M, Riley BP, Rujescu D, Sham PC, Sklar P, St. Clair D, Weinberger DR, Wendland JR, Werge T, Daly MJ, Sullivan PF, O’Donovan MC, Ripke S, O’Dushlaine C, Chambert K, Moran JL, Kähler AK, Akterin S, Bergen S, Magnusson PKE, Neale BM, Ruderfer D, Scolnick E, Purcell S, McCarroll S, Sklar P, Hultman CM, Sullivan PF (2014) Partitioning Heritability of Regulatory and Cell-Type-Specific Variants across 11 Common Diseases. Am J Hum Genet 95:535– 552 . https://doi.org/10.1016/j.ajhg.2014.10.004
Gussow AB, Copeland BR, Dhindsa RS, Wang Q, Petrovski S, Majoros WH, Allen AS, Goldstein DB (2017) Orion: Detecting regions of the human non-coding genome that are intolerant to variation using population genetics. PLOS ONE 12:e0181604 . https://doi.org/10.1371/journal.pone.0181604 He Z, Xu B, Buxbaum J, Ionita-Laza I (2019) A genome-wide scan statistic framework for whole-genome
sequence data analysis. Nat Commun 10:1–11 . https://doi.org/10.1038/s41467-019-11023-0 Hindorff LA, Sethupathy P, Junkins HA, Ramos EM, Mehta JP, Collins FS, Manolio TA (2009) Potential
etiologic and functional implications of genome-wide association loci for human diseases and traits. Proc Natl Acad Sci 106:9362–9367 . https://doi.org/10.1073/pnas.0903103106
Huang Y-F, Gulko B, Siepel A (2017) Fast, scalable prediction of deleterious noncoding variants from functional and population genomic data. Nat Genet 49:618–624 . https://doi.org/10.1038/ng.3810 Ionita-Laza I, McCallum K, Xu B, Buxbaum JD (2016) A spectral approach integrating functional genomic
annotations for coding and noncoding variants. Nat Genet 48:214–220 . https://doi.org/10.1038/ng.3477 Itan Y, Shang L, Boisson B, Ciancanelli MJ, Markle JG, Martinez-Barricarte R, Scott E, Shah I, Stenson PD,
Gleeson J, Cooper DN, Quintana-Murci L, Zhang S-Y, Abel L, Casanova J-L (2016) The mutation significance cutoff: gene-level thresholds for variant predictions. Nat Methods 13:109–110 . https://doi.org/10.1038/nmeth.3739
Kim T, Wei P (2016) Incorporating ENCODE information into association analysis of whole genome sequencing data. BMC Proc 10: . https://doi.org/10.1186/s12919-016-0040-y
Kleinjan D-J, Coutinho P (2009) Cis-ruption mechanisms: disruption of cis-regulatory control as a cause of human genetic disease. Brief Funct Genomic Proteomic 8:317–332 .
https://doi.org/10.1093/bfgp/elp022
Kolovos P, Knoch TA, Grosveld FG, Cook PR, Papantonis A (2012) Enhancers and silencers: an integrated and simple model for their function. Epigenetics Chromatin 5:1 . https://doi.org/10.1186/1756-8935-5-1
Kosmicki JA, Churchhouse CL, Rivas MA, Neale BM (2016) Discovery of rare variants for complex phenotypes. Hum Genet 135:625–634 . https://doi.org/10.1007/s00439-016-1679-1
Kosmicki JA, Samocha KE, Howrigan DP, Sanders SJ, Slowikowski K, Lek M, Karczewski KJ, Cutler DJ, Devlin B, Roeder K, Buxbaum JD, Neale BM, MacArthur DG, Wall DP, Robinson EB, Daly MJ (2017) Refining the role of de novo protein-truncating variants in neurodevelopmental disorders by using population reference samples. Nat Genet 49:504–510 . https://doi.org/10.1038/ng.3789
Krijger PHL, de Laat W (2016) Regulation of disease-associated gene expression in the 3D genome. Nat Rev Mol Cell Biol 17:771–782 . https://doi.org/10.1038/nrm.2016.138
Kvon EZ, Zhu Y, Kelman G, Novak CS, Plajzer-Frick I, Kato M, Garvin TH, Pham Q, Harrington AN, Hunter RD, Godoy J, Meky EM, Akiyama JA, Afzal V, Tran S, Escande F, Gilbert-Dussardier B, Jean-Marçais N, Hudaiberdiev S, Ovcharenko I, Dobbs MB, Gurnett CA, Manouvrier-Hanu S, Petit F, Visel A, Dickel DE, Pennacchio LA (2020) Comprehensive In Vivo Interrogation Reveals Phenotypic Impact of Human Enhancer Variants. Cell 180:1262-1271.e15 . https://doi.org/10.1016/j.cell.2020.02.031 Ladouceur M, Dastani Z, Aulchenko YS, Greenwood CMT, Richards JB (2012) The Empirical Power of Rare
Variant Association Methods: Results from Sanger Sequencing in 1,998 Individuals. PLoS Genet 8:e1002496 . https://doi.org/10.1371/journal.pgen.1002496
Lappalainen T, Scott AJ, Brandt M, Hall IM (2019) Genomic Analysis in the Age of Human Genome Sequencing. Cell 177:70–84 . https://doi.org/10.1016/j.cell.2019.02.032
Lee S, Abecasis GR, Boehnke M, Lin X (2014) Rare-variant association analysis: study designs and statistical tests. Am J Hum Genet 95:5–23 . https://doi.org/10.1016/j.ajhg.2014.06.009
Lee S, Emond MJ, Bamshad MJ, Barnes KC, Rieder MJ, Nickerson DA, NHLBI GO Exome Sequencing Project—ESP Lung Project Team, Christiani DC, Wurfel MM, Lin X (2012) Optimal unified approach for rare-variant association testing with application to small-sample case-control whole-exome
sequencing studies. Am J Hum Genet 91:224–237 . https://doi.org/10.1016/j.ajhg.2012.06.007
Lek M, Karczewski KJ, Minikel EV, Samocha KE, Banks E, Fennell T, O’Donnell-Luria AH, Ware JS, Hill AJ, Cummings BB, Tukiainen T, Birnbaum DP, Kosmicki JA, Duncan LE, Estrada K, Zhao F, Zou J, Pierce-Hoffman E, Berghout J, Cooper DN, Deflaux N, DePristo M, Do R, Flannick J, Fromer M, Gauthier L, Goldstein J, Gupta N, Howrigan D, Kiezun A, Kurki MI, Moonshine AL, Natarajan P, Orozco L, Peloso GM, Poplin R, Rivas MA, Ruano-Rubio V, Rose SA, Ruderfer DM, Shakir K, Stenson PD, Stevens C, Thomas BP, Tiao G, Tusie-Luna MT, Weisburd B, Won H-H, Yu D, Altshuler DM, Ardissino D, Boehnke M, Danesh J, Donnelly S, Elosua R, Florez JC, Gabriel SB, Getz G, Glatt SJ, Hultman CM, Kathiresan S, Laakso M, McCarroll S, McCarthy MI, McGovern D, McPherson R, Neale BM, Palotie A, Purcell SM, Saleheen D, Scharf JM, Sklar P, Sullivan PF, Tuomilehto J, Tsuang MT, Watkins HC, Wilson JG, Daly MJ, MacArthur DG, Exome Aggregation Consortium (2016) Analysis of protein-coding genetic variation in 60,706 humans. Nature 536:285–291 .
https://doi.org/10.1038/nature19057
Leslie R, O’Donnell CJ, Johnson AD (2014) GRASP: analysis of genotype-phenotype results from 1390 genome-wide association studies and corresponding open access database. Bioinformatics 30:i185–i194 . https://doi.org/10.1093/bioinformatics/btu273
Li B, Leal SM (2008) Methods for detecting associations with rare variants for common diseases: application to analysis of sequence data. Am J Hum Genet 83:311–321 . https://doi.org/10.1016/j.ajhg.2008.06.024 Li MJ, Wang LY, Xia Z, Sham PC, Wang J (2013) GWAS3D: detecting human regulatory variants by
integrative analysis of genome-wide associations, chromosome interactions and histone modifications. Nucleic Acids Res 41:W150–W158 . https://doi.org/10.1093/nar/gkt456
Li X, Montgomery SB (2013) Detection and Impact of Rare Regulatory Variants in Human Disease. Front Genet 4: . https://doi.org/10.3389/fgene.2013.00067