Environmentally Conscious Chemical Process Design
by
José Alejandro Cano Ruiz
B.S. Environmental Engineering Science Massachusetts Institute of Technology, 1991
M.S. Civil Engineering University of California, 1992 M.S. Chemical Engineering Practice Massachusetts Institute of Technology, 1998 Submitted to the Department of Chemical Engineering in Partial Fulfillment of the Requirements for the Degree of
Doctor of Philosophy in Chemical Engineering at the
Massachusetts Institute of Technology September 2000
© Massachusetts Institute of Technology All rights reserved
Signature of Author ... Department of Chemical Engineering August 3, 2000 Certified by ... Gregory J. McRae Bayer Professor of Chemical Engineering Thesis Supervisor Accepted by ... Robert E. Cohen St. Laurent Professor of Chemical Engineering Chairman, Committee for Graduate Students
Environmentally Conscious Chemical Process Design
by
José Alejandro Cano Ruiz
Submitted to the Department of Chemical Engineering on August 3, 2000 in Partial Fulfillment of the Requirements for the Degree of
Doctor of Philosophy in Chemical Engineering
Abstract
The environment has emerged as an important determinant of the performance of the modern chemical industry. Process engineering in the 21st century needs to evolve to include environmental
issues as part of the design objectives, rather than as constraints on operations.
A frequently cited objection to the use of quantitative indicators of environmental performance in product and process design is that the underlying data are too uncertain for the numbers to have any real meaning. This thesis demonstrates that explicit incorporation of uncertainties allows bounds to be established on the confidence of decisions made on the basis of uncertain indicators. The examples provided show that large uncertainties in indicators used to assess environmental performance do not necessarily imply uncertainty in decision-making.
A series of computer-aided decision making tools have been developed to decrease the barriers to the use of environmental valuation functions in routine design activities. These tools include: uncertainty propagation of relative performance measures, a spreadsheet-based fate, transport and exposure model for chemicals, an information content chart for assessing the quality of uncertain indicators, a screening procedure to identify the most important structural and parametric uncertainties in multimedia exposure models, a process by product input-output life cycle assessment method to generate correlated distributions of unit environmental indicators, an extension of the deterministic equivalent modeling method for the generation of spreadsheet based polynomial chaos expansion metamodels of process flowsheet models, and a database for managing uncertain parameters used in environmental valuation models.
Case studies are presented to help the reader in learning the use of the tools. The tools are also applied to an analysis of the U.S. toxics release inventory, in which confidence bounds are developed for the trends in impacts and the contributions of industrial sectors and specific chemical compounds to overall potential impact.
Although the tools were developed bearing in mind the need for methods to evaluate the environmental performance of chemical process design alternatives, the ideas can be applied to any decision context in which there are significant uncertainties in the parameters of the objective function.
Thesis Supervisor: Gregory J. McRae
In the first place, I would like to acknowledge my parents, Alejandro and Milagros Cano, for their unconditional love, full trust, and unwavering support in my 26 years as a student. Papá y Mamá never questioned the need to get multiple graduate degrees or even hinted surprise at the length of time required to finish my Ph.D. program. Esta tesis está dedicada a ustedes.
I was fortunate to graduate from high school at the same time that Mr. Eduardo Grado was assistant director of admissions at MIT. Eddie was instrumental in opening the doors of MIT to qualified students from south of the border. Had it not been for Eddie’s recruitment trip to Mexico in the fall of 1986, I would have never entertained the idea of travelling abroad for my college education.
I first heard about MIT from Dr. José Miguel Gonzalez Santaló for whom I worked in the afternoons during my junior year in High School. Pepe also helped me to discover my interest in environmental studies. I remember a conversation we had in which I told him I wanted to study engineering but were not sure about which branch to pursue. Pepe told me that engineers solve problems, so I should think about which problems I would be most interested in solving. The choice of environmental engineering became evident after that conversation.
Prof. Dave Marks and Prof. Greg McRae gave me vast freedom and their full support to define and pursue my own thesis project as a graduate student at MIT. I recall talking with Dave two years after my graduation from the Environmental Engineering Science undergraduate program at MIT. I told him I wanted to pursue a Ph.D. in pollution prevention and asked him whether there were any faculty members at MIT with whom I could work towards that goal. I wanted to learn how to design cleaner processes from the start, instead of adding pollution control technology to processes after they were built. His response was something along the lines of “Come over and we’ll figure it out once you are here”. I followed his advice, came back to MIT in the fall of 1994, and Dave provided me with a home at the Parsons lab and financial support for two years while I learned enough process engineering to be able to talk intelligently with chemical engineers. When I met Greg and told him about my research interest he gave a warm and enthusiastic welcome to his research group. Ever since, whenever I had doubts about the relevance of my research Greg would give me a big confidence boost with his interest and enthusiasm for my work.
I would also like to thank the other members of my committee, Prof. Joel Clark, Prof. Tom Magnanti, and Prof. Jeff Tester, for their advice and for reading through this lengthy manuscript. Prof. Francis McMichael from CMU helped me to refine the PIO-LCA method described in Chapter 7.
I would like to thank the MIT-ETH-UT Alliance for Global Sustainability for providing me with the opportunity to meet and develop relationships with colleagues around the world from many different disciplines who share my interest in issues of sustainability. In particular, the collaboration with Prof. Konrad Hungerbühler’s research group at ETH has resulted in a very fruitful exchange of ideas.
My colleagues Gary Adamkiewicz, Enrique Guinand, Volker Hoffmann, José Manuel Ortega, and Mort Webster read drafts of chapters of this thesis and provide me with many valuable comments. Discussions with them as well as with Aleks Engel, José Luis Jiménez, Gene Lin, Markus Meier, Sam Newell, Darren Obrigkeit, Menner Tatang, and Cheng Wang helped me to develop my thinking on environmental assessment and uncertainty analysis. I also want to thank Cheng, Gary and Mort for taking turns in keeping our computer network running.
Prof. Alan Hatton allowed me to schedule my attendance to the Chemical Engineering Practice School at the only time that did not conflict with my family’s plans. I also want to thank him for the opportunity to further my professional training as an assistant director of the Practice School at the Mitsubishi Chemicals station in Japan. I hope to be able to teach again sometime in the near future.
I want to express my sincere appreciation to Craig Abernethy, Elaine Aufiero, Maria Brennan, Jackie Donoghue, Janet Fischer, Carol Phillips, Cynthia Stewart, and Liz Webb for their support with all the administrative aspects of my life as a graduate student (such as making sure that I could come into the country legally and that I received my paychecks on time).
Taxpayers and donors in Mexico and the United States invested more than a quarter million dollars over the last six years to bring this research project to completion. It is my hope that as the ideas presented here are applied in industry, society will be able to earn a generous return on its investment. Specific sources of funding included: a Fulbright/García Robles scholarship from the U.S. Institute of International Education and Mexico's Science and Technology Council (CONACYT), a Person's fellowship, as well as grants from the U.S. National Science Foundation, the U.S. Environmental Protection Agency, and the National Center for Supercomputing Applications.
Last but not least, I want to thank my family and friends for filling my life with joy during the last 6 years. My sisters, Mali and Minchu made sure that I never took myself or my endeavors too seriously. Kate and Gordon Baty have been my parents away from home ever since I came to MIT as a freshman in 1987. The students at German House provided me and my family not only with a home during the last three years, but also with their wonderful friendship. We will miss you guys. To my wife Andrea, the love of my life, thank you for your patience and understanding during all those periods of high stress. To my daughter Ana Gabriela, I hope that through this and related efforts our generation will learn to manage this planet responsibly, so that you, your children, and your children’s children may enjoy the Earth’s many beauties for years to come. Of the two main projects that have occupied my life during the last twelve months, you are, without question, the most important one.
CHAPTER 1 INTRODUCTION... 29
1.1 THESIS STATEMENT... 29
1.2 STRUCTURE OF THESIS... 30
1.3 SUMMARY OF CONTRIBUTIONS... 35
1.4 READING GUIDE... 36
CHAPTER 2 ENVIRONMENTALLY CONSCIOUS CHEMICAL PROCESS DESIGN... 39
2.1 CHALLENGES FOR CHEMICAL PROCESS DESIGN IN THE 21ST CENTURY... 39
2.2 THE DESIGN PROCESS... 42
2.3 FRAMING OF THE DESIGN PROBLEM WITH THE ENVIRONMENT AS AN OBJECTIVE... 45
2.4 APPROACHES TO THE GENERATION OF ENVIRONMENTALLY SUPERIOR DESIGN ALTERNATIVES... 49
2.4.1 Use of documented pollution prevention solutions as a source of design alternatives ... 51
2.4.2 Design by case study ... 51
2.4.3 Hierarchical design approaches and other methods of structured thinking ... 51
2.4.4 Pinch analysis and other targeting techniques ... 52
2.4.5 Mathematical programming... 55
2.4.6 Expert systems and other Artificial Intelligence approaches... 56
2.5 ANALYSIS OF DESIGN ALTERNATIVES... 57
2.6 APPROACHES TO THE EVALUATION OF DESIGN ALTERNATIVES... 59
2.6.1 Environmental concerns as constraints on economic optimization ... 60
2.6.2 Environmental concerns as objectives ... 61
Minimization of emissions of pollutants of concern...62
Minimization of mass of waste generated ...62
Minimization of contributions to specific environmental problems ...63
Minimization of overall indicators of environmental impact...65
Industrial perspective ...66
2.6.3 Trading off environmental objectives against other design objectives... 66
2.7 THE ROLE OF SENSITIVITY ANALYSIS... 69
2.8 RESEARCH NEEDS... 70 Generation of alternatives...71 Analysis of alternatives ...71 Evaluation of alternatives ...72 Sensitivity analysis ...72 2.9 CONCLUSIONS... 72 2.10 LITERATURE CITED... 73
3.1 INTRODUCTION... 85
3.2 ECONOMIC VALUATION MODELS... 88
3.2.1 The total annualized profit economic valuation model ... 89
3.2.2 Capital charge factor models... 92
Annuity formula ...93
Douglas Model ...93
3.2.3 Installed equipment cost annualization factor model... 95
3.2.4 Uncertainties in economic valuation models ... 98
Uncertainties in prices ...99
Uncertainties in equipment cost ...101
Uncertainties in installation cost factors...103
Uncertainties in annualization factors...106
Summary ...116
3.2.5 The impact of widely used heuristics on the resolution of the operating vs. capital cost tradeoff .... 116
Example: Sizing a heat exchanger...120
3.3 ENVIRONMENTAL VALUATION MODELS... 125
3.3.1 Introduction... 125
3.3.2 Uncertainties in environmental valuation models... 127
Uncertainties in the estimation of environmental exchanges...129
Uncertainties in characterization factors...130
Uncertainties in weighting factors ...131
Default environmental valuation factors used in this work ...137
Summary ...139
3.4 CONCLUSIONS... 139
3.5 NOMENCLATURE... 140
3.6 LITERATURE CITED... 141
CHAPTER 4 DECISION MAKING UNDER UNCERTAINTY ... 145
4.1 INTRODUCTION... 145
4.2 UNCERTAINTIES IN PROCESS DESIGN... 145
4.3 APPROACHES TO DECISION MAKING UNDER UNCERTAINTY... 148
4.4 DECREASING DECISION UNCERTAINTY BY PRESERVING CORRELATION STRUCTURE... 150
4.5 CONFIDENCE LIMITS ON THE OPTIMUM VALUES OF DECISION VARIABLES... 156
4.6 UTILITY FUNCTIONS... 157
4.6.1 Introduction... 157
4.6.2 Single-attribute utility functions... 158
4.6.3 Multiple-attribute utility functions ... 163
4.7 EXAMPLES... 166
Introduction ...166
Analysis...167
Results...170
4.7.2 Sizing a heat exchanger ... 176
Introduction ...176
Analysis...177
Results...185
4.8 CONCLUSION... 191
4.9 LITERATURE CITED... 191
CHAPTER 5 SENSITIVITY ANALYSIS... 193
5.1 INTRODUCTION... 193
5.2 IDENTIFICATION OF IMPROVEMENT OPPORTUNITIES... 193
5.3 UNCERTAINTY ANALYSIS... 195
5.3.1 Introduction... 195
5.3.2 Variance contribution methods ... 196
5.3.3 Correlation methods... 197
5.4 EXAMPLE: RETROFIT OF A SOLVENT RECOVERY SYSTEM... 201
5.4.1 Original process... 201
5.4.2 Process with heat exchanger... 203
Sensitivity analysis results...204
Uncertainty analysis results...205
5.4.3 Process with steam stripping column... 209
Introduction ...209
Analysis...210
Results...219
5.5 LITERATURE CITED... 222
CHAPTER 6 EVALUATION OF THE ENVIRONMENTAL IMPACT OF TOXIC RELEASES ... 223
6.1 INTRODUCTION... 223
6.2 TOXICITY INDICATORS... 224
6.2.1 Introduction... 224
6.2.2 Uncertainties in toxicity indicators ... 226
6.3 SPREADSHEET-BASED MODEL FOR THE GENERATION OF TOXICITY INDICATORS UNDER UNCERTAINTY... 232
6.3.1 Multi-media fate and transport model... 233
Model structure ...234
Compartment properties ...237
Intermedia transport equations ...240
Solution method ...247
6.3.2 Human exposure model... 255
Exposure pathways and exposure media contact rates ...255
Environmental media concentrations ...258
Concentrations of chemicals in irrigated soil ...259
Concentration of chemicals in aboveground crops...260
Concentration in root crops ...273
Farm animal intake doses ...276
Fish bioconcentration models...276
Milk biotransfer models ...278
Beef biotransfer models...281
Egg biotransfer model ...283
Concentration of chemicals in tap water...286
Concentration of chemicals in bathroom air...286
6.3.3 Toxicity endpoints ... 287
Cancer effects...287
Chronic non-cancer effects...288
Aggregation of cancer and non-cancer impacts...290
6.3.4 Chemical-specific input data requirements... 291
6.3.5 Modeling results... 295
Human exposure potentials ...295
Human toxicity potentials...297
6.4 MANAGEMENT OF UNCERTAINTY IN TOXICITY IMPACT INDICATORS... 301
6.4.1 Ranking of model uncertainties through the analysis of relative indicator distributions... 301
Method ...301
Results...303
Discussion ...305
6.4.2 Assessment of the information content of indicators... 305
Illustrative examples...307
Comparison to other indicators of information content ...309
Applications ...311
6.5 CASE STUDY: APPLICATION OF THE HUMAN TOXICITY POTENTIAL INDICATOR TO THE TOXIC RELEASE INVENTORY... 317
6.5.1 Introduction... 317
6.5.2 Analysis ... 319
Environmental releases...319
Fate, transport, and exposure modeling...320
Sources of Information ...320
Uncertainty propagation ...320
Choice of uncertain outputs...320
Year-to-year comparisons ...321
Chemical comparisons...324
A risk-based assessment of the 33/50 Program ...327
Industrial sector comparisons ...330
6.5.4 Discussion ... 333
Comparison with other results based on chronic toxicity indicators...334
Case study conclusions...348
6.6 LITERATURE CITED... 349
CHAPTER 7 PROCESS BY PRODUCT INPUT-OUTPUT LIFE CYCLE ASSESSMENT... 355
7.1 INTRODUCTION... 355
7.1.1 Life cycle assessment... 356
7.1.2 Input-output analysis... 357
7.2 ILLUSTRATIVE EXAMPLE... 359
7.3 THE PIO-LCA METHOD... 360
7.3.1 Input data ... 360
7.3.2 The inventory analysis stage of PIO-LCA ... 369
7.3.3 The impact analysis stage of PIO-LCA ... 377
7.3.4 The improvement analysis stage of PIO-LCA ... 381
7.4 ILLUSTRATIVE APPLICATIONS... 383
7.4.1 Obtaining a life-cycle inventory and life-cycle environmental indicators for chlorine production. . 383
7.4.2 Identifying the main drivers for environmental impact in chlorine production. ... 383
7.4.3 Obtaining unit indicators for process design evaluation. ... 384
7.4.4 Comparing three processes for manufacturing chlorine... 386
7.4.5 Impact of changing input suppliers. ... 389
7.4.6 Comparison between chlorine production in the United States and Western Europe ... 391
7.5 UNCERTAINTY PROPAGATION... 393
7.5.1 Introduction... 393
7.5.2 Sensitivity analysis ... 397
Analysis of contributions to the environmental impact indicator ...397
Analysis of contributions to uncertainty...401
7.5.3 Implementation in practice: Generation of correlated unit impact distributions... 407
7.6 DISCUSSION... 408
7.6.1 Computational cost of refining the analysis... 408
7.6.2 Relationship to linear programming formulations... 409
Derivation of LP formulation from PIO-LCA matrices and vectors...409
Comparison with other LP formulations ...411
7.6.3 Specifying appropriate market shares... 412
7.8 APPENDIX: VECTOR AND MATRIX GLOSSARY... 415
7.9 LITERATURE CITED... 383
CHAPTER 8 UNCERTAINTY PROPAGATION STRATEGIES... 419
8.1 INTRODUCTION... 419
8.2 DEVELOPMENT OF SPREADSHEET METAMODELS FOR STOCHASTIC OPTIMIZATION OF FLOWSHEET MODELS 420 8.2.1 Introduction to the deterministic equivalent modeling method ... 420
8.2.2 Extension to generate models that respond to decision variables as well as to uncertain inputs ... 424
8.2.3 Example: generating DEMM metamodels for the solvent recovery case study ... 426
8.3 GENERATION OF MULTIVARIATE DISTRIBUTIONS TO INTERFACE PROCESS MODELS WITH VALUE MODELS.. 431
8.3.1 Introduction... 431
8.3.2 Preserving correlation structure through direct use of Monte Carlo results... 432
8.3.3 Preserving correlation structure through the use of copula multivariate distributions... 433
Example...435
8.4 CONCLUSION... 440
8.5 LITERATURE CITED... 441
CHAPTER 9 KNOWLEDGE REPRESENTATION AND DATA MANAGEMENT STRATEGIES... 443
9.1 INTRODUCTION... 443
9.2 DATA CHARACTERISTICS... 443
9.3 SYSTEM REQUIREMENTS... 446
9.4 ENVEVALTOOL: A TOOL FOR MANAGING ENVIRONMENTAL EVALUATION INFORMATION... 447
9.4.1 Data model... 447
9.4.2 Sources of data... 452
9.4.3 System functions... 457
Generation of toxicity indicator distributions...457
Generation of input data for the PIO-LCA method ...457
Other functions...458
9.5 SUGGESTED IMPLEMENTATION WITHIN ORGANIZATIONS... 458
9.6 SOURCES OF INFORMATION CITED... 461
CHAPTER 10 RECOMMENDATIONS FOR FUTURE WORK... 465
10.1 ENVIRONMENTALLY CONSCIOUS GENERATION OF DESIGN ALTERNATIVES... 465
10.2 ENVIRONMENTALLY CONSCIOUS PROCESS SIMULATION... 465
10.3 INTEGRATION OF PROCESS SIMULATION WITH ENVIRONMENTAL VALUATION MODELS... 466
10.4 ENVIRONMENTAL VALUATION METHODS... 466
10.5 ECONOMIC VALUATION METHODS... 466
10.6 UNCERTAINTY PROPAGATION AND UNCERTAINTY ANALYSIS... 467
10.8 CASE STUDIES... 468
CHAPTER 11 CONCLUSIONS... 469
APPENDIX A SOLVENT RECOVERY SYSTEM DESIGN CASE STUDY... 471
A.1 PROBLEM STATEMENT... 471
A.2 PROCESS MODELS... 474
A.3 VALUATION MODELS... 475
A.4 ASSESSMENT OF UNCERTAINTIES... 477
A.4.1 Uncertainty in process model parameters... 477
NTRL parameters ...477
Heat transfer coefficient ...479
Overall tray efficiency...480
A.4.2 External uncertainties ... 481
Uncertainties in prices over the life of the project...482
Uncertainty in regulatory environment...482
A.4.3 Valuation model uncertainties ... 483
A.5 LITERATURE CITED... 487
APPENDIX B ENVEVALTOOL DATABASE DOCUMENTATION... 489
B.1 DATA TABLE STRUCTURES AND RELATIONSHIPS... 489
B.2 QUERIES AND VISUAL BASIC CODE USED TO EXPORT DATA TO THE HUMAN EXPOSURE MODEL... 532
B.2.1 Overview ... 532
Software required ...532
Execution sequence ...532
B.2.2 Visual Basic code implemented within the Access database... 534
B.2.3 Queries and auxiliary tables ... 536
B.2.4 Visual Basic code implemented within the Excel workbook... 539
B.3 QUERIES AND VISUAL BASIC CODE USED TO EXPORT DATA TO THE PIO-LCA MODEL... 541
B.3.1 Overview ... 541
Software required ...541
Execution sequence ...541
B.3.2 Visual Basic code implemented within the Access database... 542
B.3.3 Queries, forms, and auxiliary tables ... 545
B.3.4 Visual Basic code implemented within the Excel workbook... 563
APPENDIX C PIO-LCA METHOD SPREADSHEET IMPLEMENTATION... 575
C.1 INPUT REQUIREMENTS... 575
FIGURE 1-1: STRUCTURE OF THESIS. PART I: THE DESIGN PROCESS... 31
FIGURE 1-2: STRUCTURE OF THESIS. PART II: ENVIRONMENTAL EVALUATION TOOLS... 33
FIGURE 2-1: U.S. CHEMICAL INDUSTRY ENVIRONMENTAL EXPENDITURES IN PERSPECTIVE (1999 DATA)... 40
FIGURE 2-2: THE DESIGN PROCESS... 43
FIGURE 2-3: EVOLUTION IN THE FRAMING OF THE CHEMICAL PROCESS SYNTHESIS PROBLEM. ... 47
FIGURE 2-4: MATERIAL FLOWS IN A CHEMICAL PROCESS... 50
FIGURE 3-1: ELEMENTS OF AN ECONOMIC VALUATION MODEL... 89
FIGURE 3-2: HISTORICAL DATA AND FUTURE UNCERTAINTY FOR METHYLENE CHLORIDE PRICES... 101
FIGURE 3-3: HISTORICAL DATA AND FUTURE UNCERTAINTY FOR NATURAL GAS PRICES... 101
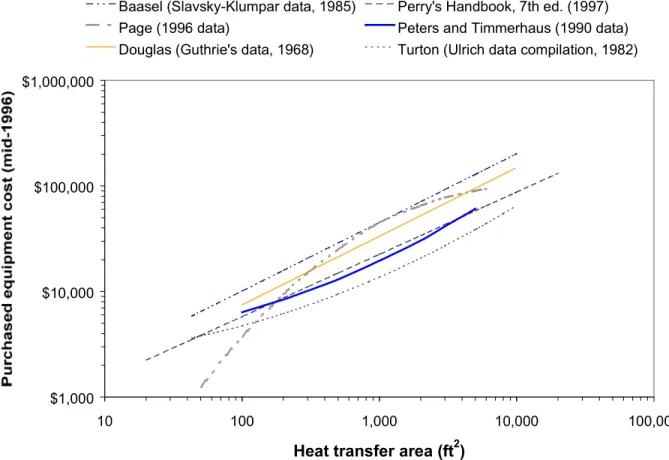
FIGURE 3-4: CORRELATIONS FOR THE ESTIMATION OF PURCHASED EQUIPMENT COST OF FLOATING-HEAD SHELL AND TUBE HEAT EXCHANGERS... 102
FIGURE 3-5: GUTHRIE'S INSTALLATION FACTORS FOR HEAT EXCHANGERS... 105
FIGURE 3-6: MARGINAL CONTRIBUTIONS TO INSTALLED EQUIPMENT COST WITH RESPECT TO PURCHASED EQUIPMENT COST FOR HEAT EXCHANGERS (BASED ON GUTHRIE'S DATA)... 105
FIGURE 3-7: ANNUALIZATION FACTOR PROBABILITY DENSITY DISTRIBUTIONS (DOUGLAS MODEL)... 110
FIGURE 3-8: PROBABILITY DENSITY DISTRIBUTIONS FOR INSTALLED EQUIPMENT COST ANNUALIZATION FACTORS CALCULATED USING THE DOUGLAS MODEL FOR THREE DIFFERENT DESIGN SCENARIOS, USING A DISCOUNT RATE OF 15%... 113
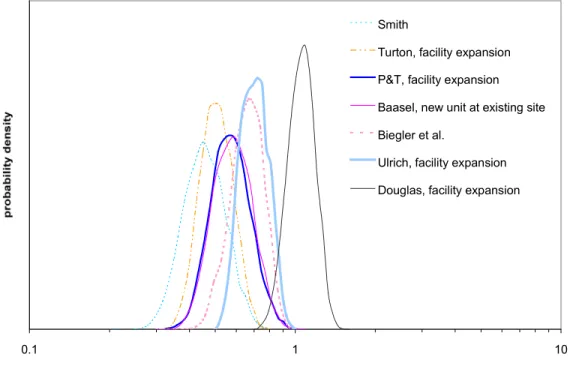
FIGURE 3-9: INSTALLED EQUIPMENT COST ANNUALIZATION FACTOR DISTRIBUTIONS OBTAINED FROM THE ECONOMIC EVALUATION ASSUMPTIONS OF VARIOUS PROCESS DESIGN BOOKS. ... 114
FIGURE 3-10: RESULTS OF THE ENERGY AND WASTE REDUCTION CONTESTS AT DOW CHEMICAL (LOUISIANA DIVISION)... 117
FIGURE 3-11: HEAT EXCHANGER SIZING EXAMPLE FLOWSHEET... 121
FIGURE 3-12: EQUIPMENT COST CORRELATIONS USED IN THE HEAT EXCHANGER SIZING EXAMPLE... 123
FIGURE 3-13: COMPONENTS OF AN ENVIRONMENTAL VALUATION MODEL... 127
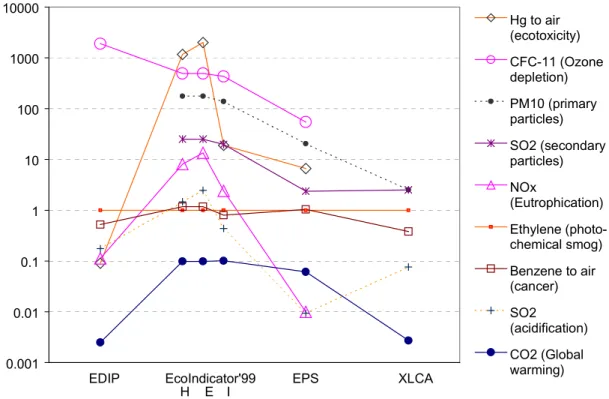
FIGURE 3-14: COMPARISON OF RELATIVE WEIGHTING FACTORS FOR VARIOUS ENVIRONMENTAL IMPACT CATEGORIES ACROSS FOUR ENVIRONMENTAL VALUATION METHODS. ... 135
FIGURE 4-1: AVAILABILITY OF INFORMATION, DESIGN FREEDOM, AND PORTION OF PROCESS PERFORMANCE FIXED BY DESIGN DECISIONS AS A FUNCTION OF THE PROCESS DEVELOPMENT STAGE... 146
FIGURE 4-2: DISTRIBUTIONS OF ABSOLUTE VALUATIONS FOR THE ILLUSTRATIVE EXAMPLE... 152
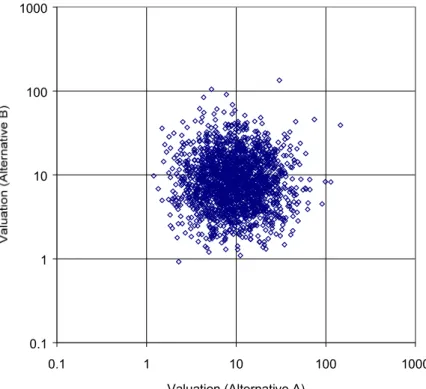
FIGURE 4-3: SCATTER PLOT OF VALUATIONS FOR THE ILLUSTRATIVE EXAMPLE, UNDER THE ASSUMPTION OF INDEPENDENCE BETWEEN VALUATION DISTRIBUTIONS... 152
FIGURE 4-4: SCATTER PLOT OF ACTUAL VALUATIONS FOR THE ILLUSTRATIVE EXAMPLE... 153
FIGURE 4-5: RELATIVE VALUATIONS FOR THE ALTERNATIVES IN THE ILLUSTRATIVE EXAMPLE... 154
FIGURE 4-7: INDIFFERENCE CURVES FOR A TWO ATTRIBUTE UTILITY FUNCTION OVER RELATIVE COST AND RELATIVE ENVIRONMENTAL IMPACT WITH α=0.1... 164 FIGURE 4-8: ZERO-UTILITY INDIFFERENCE CURVES FOR THE ATTRIBUTES RELATIVE COST AND RELATIVE
ENVIRONMENTAL IMPACT BASED ON THE PROPOSED LOGARITHMIC UTILITY FUNCTION... 165 FIGURE 4-9: FLOWSHEET FOR THE CONCENTRATION SET POINT SELECTION EXAMPLE... 167 FIGURE 4-10: STEAM CONSUMPTION AS A FUNCTION OF EFFLUENT CONCENTRATION SET POINT FOR THE SET POINT
SELECTION EXAMPLE... 168 FIGURE 4-11: JOINT PROBABILITY DENSITY DISTRIBUTION OF THE UNIT ENVIRONMENTAL INDICATORS FOR STEAM AND METHYLENE CHLORIDE DISCHARGES... 170 FIGURE 4-12: VARIABLE COSTS AS A FUNCTION OF EFFLUENT CONCENTRATION SET POINT... 171 FIGURE 4-13: ENVIRONMENTAL IMPACT INDICATOR DISTRIBUTIONS FOR THE CONCENTRATION SET POINT SELECTION
EXAMPLE... 172 FIGURE 4-14: RELATIVE ENVIRONMENTAL IMPACT DISTRIBUTIONS WITH RESPECT TO A 100 PPM BASE CASE FOR THE
CONCENTRATION SET POINT SELECTION EXAMPLE... 172 FIGURE 4-15: RELATIVE ENVIRONMENTAL IMPACT DISTRIBUTIONS VS. RELATIVE VARIABLE COST (100 PPM BASE
CASE) FOR THE CONCENTRATION SET POINT SELECTION EXAMPLE... 173 FIGURE 4-16: RELATIVE ENVIRONMENTAL IMPACT DISTRIBUTIONS WITH RESPECT TO A 25 PPM BASE CASE FOR THE
CONCENTRATION SET POINT SELECTION EXAMPLE... 174 FIGURE 4-17: PROBABILITY DENSITY PLOT FOR THE ENVIRONMENTAL IMPACT INDICATOR OF THE 18 PPM
ALTERNATIVE RELATIVE TO THE 25 PPM ALTERNATIVE... 175 FIGURE 4-18: FLOWSHEET FOR THE HEAT EXCHANGER SIZING EXAMPLE... 176 FIGURE 4-19: PROBABILITY DISTRIBUTIONS USED IN THE TAC ECONOMIC VALUATION FUNCTION FOR THE HEAT
EXCHANGER SIZING EXAMPLE... 181 FIGURE 4-20: PROBABILITY DISTRIBUTIONS USED IN THE ENVIRONMENTAL VALUATION FUNCTION FOR THE HEAT
EXCHANGER SIZING... 183 FIGURE 4-21: TOTAL ANNUALIZED COST DISTRIBUTIONS FOR THE HEAT EXCHANGER SIZING EXAMPLE... 186 FIGURE 4-22: RELATIVE TOTAL ANNUALIZED COST DISTRIBUTIONS FOR THE HEAT EXCHANGER SIZING EXAMPLE... 187 FIGURE 4-23: PROBABILITY DENSITY PLOT FOR THE TAC OF THE 2900 FT2 ALTERNATIVE RELATIVE TO THE 3500 FT2
BASE CASE ALTERNATIVE... 187 FIGURE 4-24: ENVIRONMENTAL IMPACT INDICATOR DISTRIBUTIONS FOR THE HEAT EXCHANGER SIZING EXAMPLE.. 188 FIGURE 4-25: RELATIVE ENVIRONMENTAL IMPACT DISTRIBUTIONS FOR THE HEAT EXCHANGER SIZING EXAMPLE.... 189 FIGURE 4-26: RELATIVE ENVIRONMENTAL IMPACT VS. RELATIVE TOTAL ANNUALIZED COST FOR A SUBSET OF THE
ALTERNATIVES CONSIDERED IN THE HEAT EXCHANGER SIZING EXAMPLE... 190 FIGURE 5-1: SCATTER PLOT OF 1000 PAIRS (X1, Y) FROM THE MODEL DEFINED IN EQ (5-10)... 198
FIGURE 5-2: FLOWSHEET FOR THE CONCENTRATION SET POINT SELECTION EXAMPLE... 202 FIGURE 5-3: DISTRIBUTIONS FOR THE CONTRIBUTION OF PROCESS INPUTS AND PROCESS OUTPUTS TO THE
FIGURE 5-4: FLOWSHEET FOR THE HEAT EXCHANGER SIZING EXAMPLE... 204 FIGURE 5-5: DISTRIBUTIONS FOR THE CONTRIBUTION OF PROCESS INPUTS AND PROCESS OUTPUTS TO (A) TOTAL
ANNUALIZED COST, AND (B) ENVIRONMENTAL IMPACT INDICATOR FOR THE 3500 FT2 HEAT EXCHANGER
ALTERNATIVE... 205 FIGURE 5-6: UNCERTAIN FACTOR CONTRIBUTIONS TO THE UNCERTAINTY IN TOTAL ANNUALIZED COST FOR THREE
DIFFERENT CHOICES OF HEAT EXCHANGER SIZE... 206 FIGURE 5-7: UNCERTAIN FACTOR CONTRIBUTIONS TO THE UNCERTAINTY IN ENVIRONMENTAL IMPACT VALUATIONS
FOR THREE DIFFERENT HEAT EXCHANGER SIZE CHOICES... 207 FIGURE 5-8: UNCERTAIN FACTOR CONTRIBUTIONS TO THE UNCERTAINTY IN RELATIVE TOTAL ANNUALIZED COST FOR
TWO DIFFERENT CHOICES OF HEAT EXCHANGER SIZE (BASE CASE ALTERNATIVE HAS A 3,500 FT2 HEAT
EXCHANGER)... 208 FIGURE 5-9: UNCERTAIN PARAMETER CONTRIBUTIONS TO THE UNCERTAINTY EN RELATIVE ENVIRONMENTAL IMPACT
VALUATIONS FOR TWO DIFFERENT CHOICES OF HEAT EXCHANGER SIZE (BASE CASE ALTERNATIVE HAS A
3,500 FT2 HEAT EXCHANGER) ... 209 FIGURE 5-10: FLOWSHEET FOR THE STRIPPING COLUMN RETROFIT EXAMPLE... 210 FIGURE 5-11: RELATIVE NPC DISTRIBUTIONS FOR TWO STRIPPING COLUMN DESIGNS RELATIVE TO THE
ECONOMICALLY OPTIMUM DESIGN... 220 FIGURE 5-12: RELATIVE ENVIRONMENTAL IMPACT DISTRIBUTIONS FOR TWO STRIPPING COLUMN DESIGNS RELATIVE
TO THE ECONOMICALLY OPTIMUM DESIGN... 220 FIGURE 5-13: PROBABILITY DENSITY PLOTS OF DISCOUNTED CASH FLOW FOR THE ORIGINAL AND THE RETROFITTED
SOLVENT RECOVERY PROCESSES... 221 FIGURE 5-14: PROBABILITY DENSITY PLOT FOR THE RELATIVE ENVIRONMENTAL IMPACT OF THE RETROFITTED
SOLVENT RECOVERY PROCESS RELATIVE TO THE ORIGINAL PROCESS... 221 FIGURE 6-1: CORRELATION BETWEEN HOFSTETTER DALYS AND EDF TEP CANCER INDICATORS (AIR EMISSIONS) 228 FIGURE 6-2: CORRELATION BETWEEN HOFSTETTER DALYS AND EDF TEP CANCER INDICATORS (WATER
DISCHARGES)... 229 FIGURE 6-3: LINKAGE OF EMISSIONS TO HUMAN DOSE THROUGH A COMBINED MULTIMEDIA FATE, TRANSPORT, AND
EXPOSURE MODEL... 232 FIGURE 6-4: COMPARISON BETWEEN THE CONTINUOUS AND INTERMITTENT RAIN APPROACHES TO ESTIMATING RAIN
DISSOLUTION TRANSPORT RATES (PERSISTENCE OF EMISSIONS OF TRI SUBSTANCES TO AIR)... 244 FIGURE 6-5: SENSITIVITY OF THE FATE AND TRANSPORT MODEL TO THE EXCLUSION OF THE RAIN DISSOLUTION
MECHANISM (PERSISTENCE OF EMISSIONS OF TRI SUBSTANCES TO AIR). ... 245 FIGURE 6-6: COMPARISON BETWEEN TWO METHODS OF ESTIMATING IRRIGATED SOIL CONCENTRATIONS (1000 KG/HR
DISCHARGES TO WATER OF TRI CHEMICALS INTO A 10 MILLION KM2 LANDSCAPE)... 260 FIGURE 6-7: RELATIONSHIP BETWEEN THE PLANT-SOIL BIOCONCENTRATION FACTOR AND OCTANOL-WATER
FIGURE 6-8: RELATIONSHIP BETWEEN THE STEM CONCENTRATION FACTOR AND THE OCTANOL-WATER PARTITION
COEFFICIENT... 264
FIGURE 6-9: RELATIONSHIP BETWEEN THE TRANSPIRATION STREAM CONCENTRATION FACTOR AND THE OCTANOL -WATER PARTITION COEFFICIENT... 265
FIGURE 6-10: FIT OF THE OPTIMIZED BRIGGS ET AL. PLANT-SOIL BIOCONCENTRATION FACTOR TO THE EXPERIMENTAL DATA OF TRAVIS AND ARMS. ... 266
FIGURE 6-11: FIT OF THE OPTIMIZED BRIGGS ET AL. STEM CONCENTRATION FACTOR MODEL TO THE EXPERIMENTAL DATA OF BRIGGS ET AL... 266
FIGURE 6-12: RELATIONSHIP BETWEEN LEAF AIR CONDUCTANCE AND THE OCTANOL-AIR PARTITION COEFFICIENT. 270 FIGURE 6-13: COMPARISON BETWEEN TWO METHODS FOR ESTIMATING CHEMICAL CONCENTRATIONS IN ABOVE -GROUND CROPS... 273
FIGURE 6-14: ROOT-SOIL WATER BIOCONCENTRATION MODELS... 275
FIGURE 6-15: ROOT-DRY SOIL BIOCONCENTRATION MODELS. ... 275
FIGURE 6-16: COMPARISON OF FISH BIOCONCENTRATION FACTOR CORRELATIONS WITH EXPERIMENTAL DATA... 277
FIGURE 6-17: COMPARISON OF MILK BIOTRANSFER FACTOR MODELS WITH EXPERIMENTAL DATA... 280
FIGURE 6-18: COMPARISON OF BEEF BIOTRANSFER CORRELATIONS WITH EXPERIMENTAL DATA... 282
FIGURE 6-19: CORRELATION BETWEEN BEEF AND MILK BIOTRANSFER FACTORS... 283
FIGURE 6-20: CORRELATION BETWEEN POULTRY AND CATTLE FAT-DIET BIOACCUMULATION FACTORS... 284
FIGURE 6-21: COMPARISON OF CHICKEN EGG BIOTRANSFER FACTOR CORRELATION WITH EXPERIMENTAL DATA... 286
FIGURE 6-22: CORRELATION BETWEEN TLV VALUES AND CHRONIC NON-CANCER HEALTH EFFECTS RISK ASSESSMENT VALUES. ... 293
FIGURE 6-23: DISTRIBUTION OF GEOMETRIC MEANS FOR THE EXPOSURE INDICATOR OF 1,318 CHEMICALS INCLUDED IN THE WMPT DATABASE... 296
FIGURE 6-24: DISTRIBUTION OF UNCERTAINTY FACTORS FOR THE EXPOSURE INDICATOR OF 1,318 CHEMICALS INCLUDED IN THE WMPT DATABASE... 297
FIGURE 6-25: DISTRIBUTION OF CANCER RISK INDICATORS FOR EMISSIONS TO AIR OF 263 SUBSTANCES WITH REPORTED TRI EMISSIONS IN 1988-1997 AND SOME INFORMATION REGARDING CARCINOGENICITY. ... 298
FIGURE 6-26: DISTRIBUTION OF CHRONIC TOXICITY INDICATORS (EXPRESSED AS CANCER RISK EQUIVALENTS) FOR EMISSIONS TO AIR OF 505 SUBSTANCES WITH REPORTED TRI EMISSIONS IN 1988-1997. ... 299
FIGURE 6-27: DISTRIBUTION OF UNCERTAINTIES IN CANCER RISK INDICATORS FOR EMISSIONS TO AIR OF 263 SUBSTANCES WITH REPORTED TRI EMISSIONS IN 1988-1997 AND SOME INFORMATION REGARDING CARCINOGENICITY... 300
FIGURE 6-28: DISTRIBUTION OF UNCERTAINTIES IN CHRONIC RISK INDICATORS FOR EMISSIONS TO AIR OF 505 SUBSTANCES WITH REPORTED TRI EMISSIONS IN 1988-1997 ... 300
FIGURE 6-29: INFORMATION CONTENT CHART FOR EXAMPLE 1 ... 308
FIGURE 6-31: NON-CANCER INHALATION ROUTE RISK ASSESSMENT FACTOR -- INFORMATION CONTENT CHART FOR TRI CHEMICALS WITH REPORTED EMISSIONS IN THE PERIOD 1988-1997... 312 FIGURE 6-32: HUMAN HEALTH CONCERN SCORING ALGORITHM USED IN EPA’S WASTE MINIMIZATION PRIORITIZATION
TOOL... 313 FIGURE 6-33: INFORMATION CONTENT CHART FOR THE WMPT CASE STUDY (SET OF 363 CHEMICALS WITH TOXICITY
DATA IN THE WMPT DATABASE) ... 314 FIGURE 6-34: INFORMATION CONTENT CHART FOR THE HUMAN EXPOSURE INDICATOR (SET OF 1318 CHEMICALS IN THE WMPT DATABASE)... 315 FIGURE 6-35: INFORMATION CONTENT CHART FOR THE TRI INDICATORS CASE STUDY (SET OF 505 CHEMICALS WITH
REPORTED EMISSIONS TO AIR IN 1987-1997) ... 316 FIGURE 6-36: INFORMATION CONTENT CHART FOR THE USE OF HTP (CANCER) TO RANK CHEMICALS IN THE TRI (SET
OF 263 CHEMICALS WITH CANCER INFORMATION)... 316 FIGURE 6-37: TRI 1988-1995. COMBINED AIR EMISSIONS, WATER DISCHARGES, AND WASTEWATER TREATMENT
PLANT TRANSFERS: (A) AGGREGATED BY MASS, (B) COMBINED CANCER AND NON-CANCER CHRONIC EFFECTS HEALTH RISK INDICATOR, (C) CHRONIC RISK INDICATOR RELATIVE TO 1988. ... 322 FIGURE 6-38: TRI 1988-1995. CHRONIC HEALTH RISK INDICATOR FROM COMBINED AIR EMISSIONS, WATER
DISCHARGES, AND WASTEWATER TREATMENT PLANT TRANSFERS, RELATIVE TO 1995... 323 FIGURE 6-39: INDIVIDUAL CHEMICAL CONTRIBUTIONS TO (A) TOTAL REPORTED QUANTITIES, AND (B) COMBINED
CANCER AND NON-CANCER CHRONIC TOXICITY INDICATOR (TRI CHEMICALS WITH MORE THAN 10 MILLION POUNDS OF REPORTED RELEASES IN 1997) ... 325 FIGURE 6-40: INDIVIDUAL CHEMICAL CONTRIBUTIONS TO (A) COMBINED CANCER AND NON-CANCER CHRONIC
TOXICITY INDICATOR, AND (B) TOTAL REPORTED QUANTITIES (TRI CHEMICALS WITH MORE THAN A 5% CHANCE OF CONTRIBUTING AT LEAST 1/100 OF THE TOTAL CHRONIC HEALTH RISK)... 326 FIGURE 6-41: REPORTED TRI RELEASES AND TRANSFERS OF 33/50 PROGRAM CHEMICALS, 1988-1997 ... 328 FIGURE 6-42: CHRONIC TOXICITY RISK FROM REPORTED TRI RELEASES AND TRANSFERS OF 33/50 PROGRAM
CHEMICALS, 1988-1997 (RELATIVE TO 1988)... 328 FIGURE 6-43: 33/50 PROGRAM CHEMICAL CONTRIBUTIONS TO (A) CHRONIC TOXICITY RISK, AND (B) TOTAL QUANTITY RELEASED, (1988 TRI)... 331 FIGURE 6-44: INDUSTRY CONTRIBUTIONS TO (A) TOTAL MASS AND (B) TOTAL CHRONIC HEALTH INDICATOR (1997
REPORTED TRI AIR EMISSIONS, WATER DISCHARGES, AND TRANSFERS TO WASTEWATER TREATMENT PLANTS) ... 332 FIGURE 6-45: UNIT CANCER RISK INDICATORS FOR COMPOUNDS IN THE POLYCYCLIC AROMATIC COMPOUNDS (PAC)
CHEMICAL GROUP... 333 FIGURE 6-46: COMPARISON BETWEEN EDF CANCER TOXIC EQUIVALENT POTENTIALS AND DISTRIBUTIONS FOR THE
CONTRIBUTION TO THE TOTAL CANCER RISK INDICATOR (TOP 50 CHEMICALS WITH REPORTED 1997 RELEASES OR TRANSFERS TO AIR, SURFACE WATER, AND WASTEWATER TREATMENT PLANTS, SORTED BY EDF CANCER SCORE). ... 336
FIGURE 6-47: COMPARISON BETWEEN EDF CANCER TOXIC EQUIVALENT POTENTIALS AND DISTRIBUTIONS FOR THE CONTRIBUTION TO THE TOTAL CANCER RISK INDICATOR (TOP 50 CHEMICALS WITH REPORTED 1997 RELEASES OR TRANSFERS TO AIR, SURFACE WATER, AND WASTEWATER TREATMENT PLANTS, SORTED BY MEDIAN
CONTRIBUTION TO CANCER RISK). ... 337 FIGURE 6-48: COMPARISON BETWEEN EDF NON-CANCER TOXIC EQUIVALENT POTENTIALS AND DISTRIBUTIONS FOR
THE CONTRIBUTION TO THE TOTAL NON-CANCER CHRONIC TOXICITY INDICATOR (TOP 50 CHEMICALS WITH REPORTED 1997 RELEASES OR TRANSFERS TO AIR, SURFACE WATER, AND WASTEWATER TREATMENT PLANTS, SORTED BY EDF NON-CANCER SCORE)... 338 FIGURE 6-49: COMPARISON BETWEEN EDF NON-CANCER TOXIC EQUIVALENT POTENTIALS AND DISTRIBUTIONS FOR
THE CONTRIBUTION TO THE TOTAL NON-CANCER CHRONIC TOXICITY INDICATOR (TOP 50 CHEMICALS WITH REPORTED 1997 RELEASES OR TRANSFERS TO AIR, SURFACE WATER, AND WASTEWATER TREATMENT PLANTS, SORTED BY MEDIAN CONTRIBUTION TO NON-CANCER TOXICITY INDICATOR)... 339 FIGURE 6-50: PLOT OF CONTRIBUTION TO CANCER RISK INDICATOR VS. EDF CANCER TOXIC EQUIVALENT POTENTIAL
SCORE (ALL TRI RECOGNIZED OR SUSPECTED CARCINOGENS WITH REPORTED 1997 RELEASES OR TRANSFERS TO AIR, WATER, AND WASTEWATER TREATMENT PLANTS) ... 341 FIGURE 6-51: PLOT OF CONTRIBUTION TO NON-CANCER CHRONIC TOXICITY INDICATOR VS. EDF NON-CANCER TOXIC
EQUIVALENT POTENTIAL SCORE (ALL TRI CHEMICALS WITH REPORTED 1997 RELEASES OR TRANSFERS TO AIR, WATER, AND WASTEWATER TREATMENT PLANTS)... 342 FIGURE 6-52: COMPARISON BETWEEN OPPTEIM SCORES AND CONTRIBUTION TO COMBINED CHRONIC TOXICITY
INDICATOR (TOP 50 TRI CHEMICALS WITH 1997 REPORTED EMISSIONS TO AIR, SORTED BY OPPTEIM SCORE) ... 345 FIGURE 6-53: COMPARISON BETWEEN OPPTEIM SCORES AND CONTRIBUTION TO COMBINED CHRONIC TOXICITY
INDICATOR (TOP 50 TRI CHEMICALS WITH 1997 REPORTED EMISSIONS TO AIR, SORTED BY MEDIAN
CONTRIBUTION TO TOXICITY INDICATOR)... 346 FIGURE 6-54: PLOT OF CONTRIBUTION TO COMBINED CHRONIC TOXICITY INDICATOR VS. OPPTEIM SCORE (ALL TRI
CHEMICALS WITH REPORTED 1997 EMISSIONS TO AIR) ... 347 FIGURE 6-55: CORRELATION BETWEEN OPPTEIM SCORES AND POUNDS EMITTED WEIGHTED BY TOXICITY (TRI
CHEMICALS WITH REPORTED 1997 STACK OR FUGITIVE AIR EMISSIONS). ... 348 FIGURE 7-1: PROCESS TREE REPRESENTATION OF CHLORINE PRODUCTION IN THE LCA SOFTWARE SIMAPRO... 357 FIGURE 7-2: PROCESS AND PRODUCT CHAINS INVOLVED IN THE PRODUCTION OF CHLORINE... 358 FIGURE 7-3: TWO ALTERNATIVE APPROACHES FOR LISTING EMISSIONS OF COMBUSTION PRODUCTS ASSOCIATED WITH
THE COAL-FIRED POWER PLANT PROCESS... 365 FIGURE 7-4: CORRESPONDENCE BETWEEN PRODUCT-PROCESS FLOW DIAGRAMS AND INPUT-OUTPUT MATRICES... 370 FIGURE 7-5: ENVIRONMENTAL EXCHANGE CONTRIBUTIONS TO THE ENVIRONMENTAL IMPACT INDICATOR OF
CHLORINE PRODUCTION FOR THREE CHLOR-ALKALI PROCESSES... 388 FIGURE 7-6: PROCESS THROUGHPUT CONTRIBUTIONS TO THE ENVIRONMENTAL IMPACT INDICATOR FOR CHLORINE
FIGURE 7-7: COMPARISON BETWEEN THE U.S. NATIONAL GRID AND A GAS-FIRED COGENERATION PLANT AS SOURCES
OF ELECTRICITY FOR CHLORINE PRODUCTION USING THE MEMBRANE CELL PROCESS... 391
FIGURE 7-8: COMPARISON OF THE ENVIRONMENTAL IMPACT OF CHLORINE PRODUCTION IN UNITED STATES VS. WESTERN EUROPE... 393
FIGURE 7-9: UNCERTAINTY DISTRIBUTIONS FOR THE OVERALL ENVIRONMENTAL INDICATOR FOR CHLORINE PRODUCTION OBTAINED FROM MONTE CARLO SIMULATION OF THE PIO-LCA MODEL... 395
FIGURE 7-10: COMPARISON OF THREE CHLOR-ALKALI PROCESSES USING ABSOLUTE ENVIRONMENTAL IMPACT INDICATORS... 396
FIGURE 7-11: COMPARISON OF THREE CHLOR-ALKALI PROCESSES USING RELATIVE ENVIRONMENTAL IMPACT INDICATORS... 397
FIGURE 7-12: DISTRIBUTIONS FOR PROCESS CONTRIBUTIONS TO THE ENVIRONMENTAL IMPACT INDICATOR OF CHLORINE PRODUCTION... 399
FIGURE 7-13: DISTRIBUTIONS FOR EMISSION CONTRIBUTIONS TO THE ENVIRONMENTAL IMPACT INDICATOR OF CHLORINE PRODUCTION... 400
FIGURE 7-14: DISTRIBUTIONS FOR ENVIRONMENTAL PROBLEM CATEGORY CONTRIBUTIONS TO THE ENVIRONMENTAL IMPACT INDICATOR OF CHLORINE PRODUCTION... 401
FIGURE 7-15: RANK CORRELATION COEFFICIENTS FOR THE UNCERTAINTY IN THE ABSOLUTE VALUE OF THE OVERALL ENVIRONMENTAL EVALUATION INDICATOR FOR CHLORINE PRODUCTION... 403
FIGURE 7-16: RANK CORRELATION COEFFICIENTS FOR THE UNCERTAINTY IN THE RATIO OF THE LIFE-CYCLE UNIT ENVIRONMENTAL INDICATOR OF THE DIAPHRAGM CELL PROCESS TO THAT OF THE MEMBRANE CELL PROCESS404 FIGURE 7-17: RANK CORRELATION COEFFICIENTS FOR THE UNCERTAINTY IN THE RATIO OF THE LIFE-CYCLE UNIT ENVIRONMENTAL INDICATOR OF THE MEMBRANE CELL PROCESS TO THAT OF THE MERCURY CELL PROCESS... 405
FIGURE 7-18: RANK CORRELATION COEFFICIENTS FOR THE UNCERTAINTY IN THE CONTRIBUTION OF EMISSIONS OF MERCURY TO AIR TO THE OVERALL ENVIRONMENTAL IMPACT INDICATOR OF CHLORINE PRODUCTION... 406
FIGURE 7-19: RANK CORRELATION COEFFICIENTS FOR THE UNCERTAINTY IN THE CONTRIBUTION OF THE HUMAN CHRONIC TOXICITY POTENTIAL (NON-CANCER) CATEGORY TO THE OVERALL ENVIRONMENTAL IMPACT INDICATOR OF CHLORINE PRODUCTION... 407
FIGURE 7-20: IMPACT OF PRODUCT MARKET SHARE SPECIFICATIONS ON THE ENVIRONMENTAL IMPACT VALUATION OF CHLORINE PRODUCTION... 413
FIGURE 8-1: DEMM FLOW DIAGRAM (COLLOCATION APPROACH) ... 423
FIGURE 8-2: EXPLICIT ACCESS TO A MODEL RESPONSE SURFACE THROUGH THE MONTE CARLO METHOD... 425
FIGURE 8-3: USE OF DEMMUCOM TO GENERATE PCE METAMODELS OF PROCESS FLOWSHEET MODELS... 426
FIGURE 8-4: HEAT EXCHANGER SIZING EXAMPLE PROCESS FLOWSHEET... 427
FIGURE 8-5: INDEX OF AGREEMENT VS. ORDER OF APPROXIMATION USED TO BUILD THE PCE MODEL... 428
FIGURE 8-6: DETAIL VIEW OF THE INDEX OF AGREEMENT VS. LEVEL OF APPROXIMATION CHART... 429
FIGURE 8-7: NUMBER OF MODEL RUNS NEEDED TO BUILD AND EVALUATE THE GOODNESS OF FIT OF THE PCE MODEL ... 429
FIGURE 8-8: VARIANCE CONTRIBUTION ANALYSIS... 430 FIGURE 8-9: EXAMPLE OF @RISK REPRESENTATION OF A MULTIVARIATE NORMAL COPULA DISTRIBUTION... 435 FIGURE 8-10: SCATTER PLOT OF 2000 (STEAM, METHYLENE CHLORIDE DISCHARGE) UNIT ENVIRONMENTAL INDICATOR PAIRS OBTAINED FROM MONTE CARLO SIMULATION OF A PIO-LCA MODEL... 436 FIGURE 8-11: CONTOUR PLOT OF THE EMPIRICAL JOINT PROBABILITY DENSITY OF STEAM AND METHYLENE CHLORIDE
DISCHARGE UNIT ENVIRONMENTAL INDICATORS... 437 FIGURE 8-12: 3-DIMENSIONAL PLOT OF THE EMPIRICAL JOINT DENSITY OF THE UNIT INDICATORS OF STEAM AND
METHYLENE CHLORIDE... 437 FIGURE 8-13: CONTOUR PLOT OF THE BIVARIATE NORMAL COPULA DISTRIBUTION FOR STEAM AND METHYLENE
CHLORIDE DISCHARGES ESTIMATED FROM PARAMETER FITTING OF MONTE CARLO RESULTS... 438 FIGURE 8-14: 3-DIMENSIONAL PLOT OF THE BIVARIATE NORMAL COPULA DISTRIBUTION OF THE UNIT INDICATORS OF
STEAM AND METHYLENE CHLORIDE... 438 FIGURE 8-15: CONTOUR PLOT OF THE BIVARIATE NORMAL DISTRIBUTION FOR STEAM AND METHYLENE CHLORIDE
DISCHARGES UNIT ENVIRONMENTAL INDICATORS OBTAINED UNDER THE ASSUMPTION THAT THE UNIT
INDICATORS ARE INDEPENDENT FROM EACH OTHER. ... 439 FIGURE 8-16: 3-DIMENSIONAL PLOT OF THE JOINT DISTRIBUTION OF THE UNIT INDICATORS OF STEAM AND METHYLENE CHLORIDE, OBTAINED UNDER THE ASSUMPTION OF INDEPENDENCE AMONG THE UNIT INDICATOR DISTRIBUTIONS. ... 439 FIGURE 8-17: COMPUTATIONAL ADVANTAGES OF USING THE TOOLS DESCRIBED IN THIS CHAPTER IN THE
ENVIRONMENTAL EVALUATION OF PROCESS FLOWSHEETS UNDER UNCERTAINTY... 440 FIGURE 9-1: PROBABILITY DISTRIBUTIONS FOR THE VALUE OF THE HENRY'S LAW CONSTANT FOR
1,4-DICHLOROBENZENE... 445 FIGURE 9-2: COMPARISON OF PROBABILITY DISTRIBUTIONS FOR THE CANCER ORAL POTENCY FACTOR OF BENZENE446 FIGURE 9-3: ENVEVALTOOL DATA MODEL (INPUT-OUTPUT DATA AND ECONOMIC INFORMATION) ... 448 FIGURE 9-4: ENVEVALTOOL DATA MODEL (CHEMICAL PROPERTIES AND VALUATION FACTORS)... 449 FIGURE 9-5: SCATTER PLOT OF PHYSPROP DATABASE EXPERIMENTAL HENRY'S LAW CONSTANT VALUES VS.
EXPERIMENTAL VALUES FROM STAUDINGER ET AL. ... 456 FIGURE 9-6: SCATTER PLOT OF HENRY’S LAW CONSTANT VALUES ESTIMATED USING THE HENRYWINB BOND
CONTRIBUTION METHOD VS. EXPERIMENTAL VALUES FROM THREE DIFFERENT SOURCES... 456 FIGURE 9-7: INFORMATION FLOW DIAGRAM FOR THE IMPLEMENTATION OF THE AN ENVIRONMENTAL EVALUATION
KNOWLEDGE MANAGEMENT SYSTEM WITHIN A PRIVATE ORGANIZATION... 460 FIGURE A-1: FLOWSHEET FOR THE METHYLENE CHLORIDE RECOVERY SYSTEM... 472 FIGURE A-2: TRADEOFFS IN THE OPERATION OF THE METHYLENE CHLORIDE RECOVERY SYSTEM... 473 FIGURE A-3: COMPARISON OF EXPERIMENTAL DATA TO INFINITE DILUTION COEFFICIENTS CALCULATED USING THE
FIGURE A-4: MONTE CARLO SIMULATION RESULTS FOR THE METHYLENE CHLORIDE INFINITE DILUTION ACTIVITY COEFFICIENT IN WATER CALCULATED USING THE NRTL MODEL AND THE JOINT DISTRIBUTION OF PARAMETERS GIVEN BY EQ (A-7) ... 479 FIGURE A-5: O’CONELL’S CORRELATION FOR OVERALL TRAY EFFICIENCY... 481 FIGURE A-6: DISTRIBUTIONS FOR FUTURE EFFLUENT CONCENTRATION STANDARDS... 483 FIGURE A-7: ENVIRONMENTAL EXCHANGE CONTRIBUTIONS TO THE ENVIRONMENTAL IMPACT INDICATOR OF
METHYLENE CHLORIDE RELEASES... 485 FIGURE A-8: IMPACT CATEGORY CONTRIBUTIONS TO THE ENVIRONMENTAL IMPACT INDICATOR FOR METHYLENE
CHLORIDE DISCHARGES... 486 FIGURE A-9: ENVIRONMENTAL EXCHANGE CONTRIBUTIONS TO THE ENVIRONMENTAL IMPACT INDICATOR OF STEAM
(WITH NATURAL GAS USED AS BOILER FUEL)... 486 FIGURE A-10: IMPACT CATEGORY CONTRIBUTIONS TO THE ENVIRONMENTAL IMPACT INDICATOR FOR STEAM (WITH
NATURAL GAS USED AS BOILER FUEL) ... 487 FIGURE B-1: LAYOUT OF THE CHEMICAL PROPERTIES DATA ENTRY OF THE FATE, TRANSPORT AND EXPOSURE
SPREADSHEET MODEL... 533 FIGURE C-1: LAYOUT OF SHEET1 IN THE PIO-LCA WORKBOOK... 576 FIGURE C-2: LAYOUT OF SHEET2 IN THE PIO-LCA WORKBOOK... 577 FIGURE C-3: LAYOUT OF SHEET3 IN THE PIO-LCA WORKBOOK... 577 FIGURE C-4: LAYOUT OF SHEET4 IN THE PIO-LCA WORKBOOK... 578
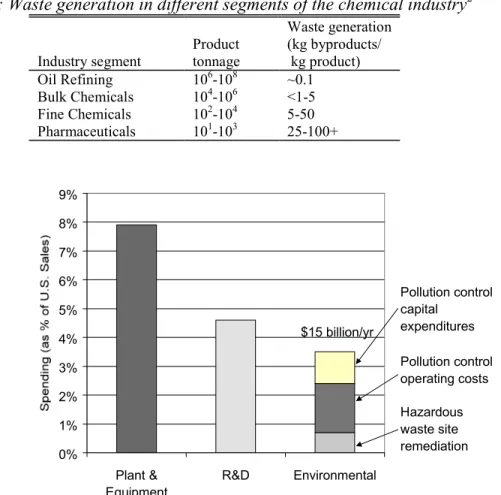
TABLE 2-1: WASTE GENERATION IN DIFFERENT SEGMENTS OF THE CHEMICAL INDUSTRY... 40 TABLE 2-2: APPROACHES TO ENVIRONMENTAL ISSUES IN CHEMICAL PROCESS DESIGN BOOKS. ... 41 TABLE 2-3: PROCESS SYNTHESIS TASKS AND REFERENCES TO EXAMPLES OF THEIR APPLICATION TO WASTE
MINIMIZATION PROBLEMS USING THE MATHEMATICAL PROGRAMMING APPROACH... 55 TABLE 2-4: TOXICITY-BASED INDICATORS FOR THE EVALUATION OF ENVIRONMENTAL RELEASES... 65 TABLE 2-5: ENVIRONMENTAL INDICATORS USED FOR PROCESS EVALUATION IN THE CHEMICAL INDUSTRY... 67 TABLE 3-1: COMPARISON OF APPROACHES TO THE ESTIMATION OF INSTALLATION COST FACTORS... 104 TABLE 3-2: PARAMETRIC UNCERTAINTIES IN THE CAPITAL COST ESTIMATION MODEL OF DOUGLAS... 107 TABLE 3-3: PARAMETRIC UNCERTAINTIES IN THE TOTAL PRODUCT COST MODEL... 108 TABLE 3-4: UNCERTAIN FACTORS IN THE CAPITAL CHARGE FACTOR MODEL... 109 TABLE 3-5: IMPACT OF PARAMETRIC UNCERTAINTY ON ANNUALIZATION FACTORS... 110 TABLE 3-6: CHANGES MADE TO THE PARAMETERS IN THE DOUGLAS ANNUALIZATION FACTOR MODEL FOR THE
PURPOSE OF DERIVING AN ANNUALIZATION FACTOR APPROPRIATE FOR SIZING EQUIPMENT... 112 TABLE 3-7: EFFECT OF INDIRECT COST FACTOR ASSUMPTIONS ON THE ANNUALIZATION FACTORS OBTAINED FROM THE
DOUGLAS MODEL... 113 TABLE 3-8: INSTALLED EQUIPMENT COST ANNUALIZATION FACTOR MODEL ASSUMPTIONS AND RESULTS FOR VARIOUS
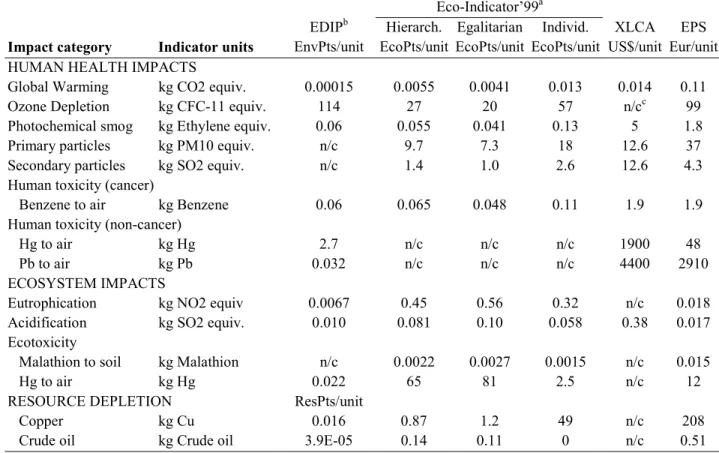
PROCESS DESIGN TEXTBOOKS. ... 115 TABLE 3-9: VALUES OF THE ANNUALIZATION FACTOR USED IN THE HEAT EXCHANGER SIZING EXAMPLE... 122 TABLE 3-10: RESULTS FOR THE HEAT EXCHANGER SIZING EXAMPLE... 124 TABLE 3-11: WIDELY USED ENVIRONMENTAL IMPACT METRICS FOR SPECIFIC ENVIRONMENTAL PROBLEMS... 128 TABLE 3-12: TYPICAL UNCERTAINTIES IN AIR POLLUTANT EMISSION FACTORS... 130 TABLE 3-13: EXAMPLES OF THE UNCERTAINTIES IN CHARACTERIZATION FACTORS... 131 TABLE 3-14: ENVIRONMENTAL PROBLEM WEIGHTING FACTORS USED IN FOUR DIFFERENT ENVIRONMENTAL
VALUATION MODELS... 134 TABLE 3-15: IMPLIED TRADEOFFS IN THE ECO-INDICATOR'99 MODEL... 137 TABLE 3-16: ENVIRONMENTAL VALUATION FACTORS USED IN THIS THESIS... 138 TABLE 4-1: DATA FOR THE ILLUSTRATIVE EXAMPLE... 151 TABLE 4-2: EXAMPLES OF THE APPLICATION OF THE SINGLE ATTRIBUTE LOGARITHMIC UTILITY FUNCTION OVER
DISTRIBUTIONS OF RELATIVE MEASURES OF PERFORMANCE (RATIO INDICATORS)... 162 TABLE 4-3: EXPECTED UTILITY MINIMIZATION RESULTS FOR THE CONCENTRATION SET POINT SELECTION EXAMPLE175 TABLE 4-4: UNCERTAINTY DISTRIBUTIONS USED TO BUILD THE SPREADSHEET-BASED PROCESS METAMODEL... 179 TABLE 5-1: UNCERTAINTY ANALYSIS RESULTS FOR THE EXAMPLE WITH CORRELATED UNCERTAIN INPUTS... 201 TABLE 5-2: STRUCTURE OF DEMM METAMODELS USED TO PROPAGATE UNCERTAINTY IN THE STRIPPING COLUMN
RETROFIT EXAMPLE... 212 TABLE 5-3: UNCERTAINTY DISTRIBUTIONS USED TO BUILD THE SPREADSHEET-BASED PROCESS METAMODEL... 213
TABLE 5-4: UNCERTAINTY DISTRIBUTIONS USED IN THE ECONOMIC VALUATION MODEL... 216 TABLE 5-5: STOCHASTIC OPTIMIZATION RESULTS FOR THE RETROFIT EXAMPLE... 219 TABLE 6-1: HIERARCHY OF TOXICITY INDICATORS, BASED ON THE RISK ASSESSMENT PARADIGM... 225 TABLE 6-2: TOXICITY INDICATORS AVAILABLE IN THE OPEN LITERATURE... 227 TABLE 6-3: UNCERTAINTY FACTORS FOR CANCER INDICATORS BASED ON CORRELATIONS AMONG INDICATOR SYSTEMS ... 230 TABLE 6-4: UNCERTAINTY FACTORS FOR NON-CANCER INDICATORS BASED ON CORRELATIONS AMONG INDICATOR
SYSTEMS... 230 TABLE 6-5: UNCERTAINTY FACTORS FOR CHRONIC TOXICITY INDICATORS (COMBINED CANCER AND NON-CANCER)
BASED ON CORRELATIONS AMONG INDICATOR SYSTEMS... 230 TABLE 6-6: COMPARTMENTS INCLUDED IN THE MULTI-MEDIA FATE AND TRANSPORT MODEL... 234 TABLE 6-7: CHEMICAL TRANSPORT AND TRANSFORMATION PROCESSES INCLUDED IN THE FATE AND TRANSPORT
MODEL... 236 TABLE 6-8: PURE PHASE FUGACITY CAPACITY DEFINITIONS... 238 TABLE 6-9: BULK COMPARTMENT FUGACITY CAPACITY DEFINITIONS... 238 TABLE 6-10: ADJUSTMENTS TO Z VALUES REQUIRED FOR CHEMICALS WITH NEGLIGIBLE VAPOR PRESSURE... 239 TABLE 6-11: ADVECTION D VALUE DEFINITIONS... 239 TABLE 6-12 : DEGRADATION D VALUE DEFINITIONS... 239 TABLE 6-13: INTERMEDIA TRANSPORT D VALUE DEFINITIONS... 240 TABLE 6-14: MASS TRANSFER COEFFICIENT DEFINITIONS... 242 TABLE 6-15: DISTRIBUTIONS FOR THE PARAMETERS DESCRIBING THE LOWER ATMOSPHERE COMPARTMENT... 250 TABLE 6-16: DISTRIBUTIONS FOR THE PARAMETERS DESCRIBING THE SURFACE WATER COMPARTMENT... 251 TABLE 6-17: DISTRIBUTIONS FOR THE PARAMETERS DESCRIBING THE SOIL COMPARTMENTS... 252 TABLE 6-18: DISTRIBUTIONS FOR THE PARAMETERS DESCRIBING THE SEDIMENTS COMPARTMENT... 252 TABLE 6-19: DISTRIBUTIONS FOR THE PARAMETERS DESCRIBING THE TERRESTRIAL VEGETATION COMPARTMENT.. 253 TABLE 6-20: DISTRIBUTIONS FOR THE PARAMETERS USED TO CALCULATE TRANSPORT RATES... 254 TABLE 6-21: EXPOSURE MEDIA CONTACT RATE EXPRESSIONS... 256 TABLE 6-22: DISTRIBUTIONS FOR THE PARAMETERS IN THE EXPOSURE MEDIA CONTACT RATE EXPRESSIONS... 256 TABLE 6-23: EXPOSURE PATHWAYS IN THE EXPOSURE MODEL... 257 TABLE 6-24: ENVIRONMENTAL MEDIA CONCENTRATIONS USED IN THE HUMAN EXPOSURE MODEL... 258 TABLE 6-25: PURE PHASE VOLUME FRACTIONS IN PLANT LEAVES... 261 TABLE 6-26: PLANT-SOIL BIOCONCENTRATION FACTOR MODEL PARAMETERS... 263 TABLE 6-27: LITERATURE VALUES FOR THE PARAMETERS IN THE TRAPP AND MATTHIES AERIAL PLANT PARTS
BIOACCUMULATION MODEL... 268 TABLE 6-28: LITERATURE VALUES FOR THE PARAMETERS IN THE LEAF CONDUCTANCE MODEL... 269 TABLE 6-29: PARAMETER VALUES USED IN THE ABOVE-GROUND CROPS BIOCONCENTRATION MODEL... 272 TABLE 6-30: FARM ANIMAL EXPOSURE MEDIA CONTACT RATES... 276
TABLE 6-31: VALUES FOR THE PARAMETERS USED IN THE BATHROOM AIR CONCENTRATION MODEL... 287 TABLE 6-32: SAFETY FACTORS APPLIED TO NON-CANCER TOXICITY DATA FOR THE DERIVATION OF REFERENCE DOSES
... 290 TABLE 6-33: EXPRESSIONS USED TO PROVIDE ESTIMATES FOR REQUIRED CHEMICAL-SPECIFIC PARAMETERS WITH
MISSING DATA... 292 TABLE 6-34: DATA ELEMENTS USED TO DERIVE PROBABILITY DISTRIBUTIONS FOR NON-CANCER CHRONIC TOXICITY
REFERENCE CONCENTRATIONS (TRI CHEMICALS WITH EMISSIONS TO AIR, DISCHARGES TO WATER, OR
TRANSFERS TO WASTEWATER TREATMENT PLANTS IN 1988-1997) ... 294 TABLE 6-35: STRUCTURAL UNCERTAINTIES IN THE COMBINED MULTIMEDIA EXPOSURE MODEL... 302 TABLE 6-36: SENSITIVITY RESULTS FOR STRUCTURAL UNCERTAINTIES... 304 TABLE 6-37: SENSITIVITY ANALYSIS RESULTS (TOP 20 PARAMETRIC UNCERTAINTIES) ... 305 TABLE 6-38: SENSITIVITY RESULTS FOR EXPOSURE PATHWAYS... 306 TABLE 6-39: HERTWICH’S RESOLUTION METRIC RESULTS FOR EXAMPLES 1 AND 2. ... 310 TABLE 6-40: LIST OF CHEMICALS IN THE 33/50 PROGRAM, COMPARED WITH LISTS CREATED ON THE BASIS OF
CHEMICAL CONTRIBUTIONS TO RISK FROM 1988 AND 1997 TRI RELEASES... 329 TABLE 6-41: AVAILABILITY OF INDICATORS TO SCORE 1997 REPORTED TRI RELEASES... 334 TABLE 6-42: DEFAULT TOXICITY DISTRIBUTIONS USED... 335 TABLE 7-1: USE AND MAKE MATRICES FOR THE CHLORINE LCA EXAMPLE... 361 TABLE 7-2: ENVIRONMENTAL EXCHANGES MATRIX FOR THE CHLORINE LCA EXAMPLE... 364 TABLE 7-3: MARKET SHARE MATRIX FOR THE CHLORINE LCA EXAMPLE... 366 TABLE 7-4: PRICE AND DEMAND VECTORS FOR THE CHLORINE LCA EXAMPLE... 367 TABLE 7-5: ALLOCATION MATRIX FOR THE CHLORINE LCA EXAMPLE... 368 TABLE 7-6: PROCESS BY PRODUCT THROUGHPUT MATRIX FOR THE CHLORINE LCA EXAMPLE... 369 TABLE 7-7: PRODUCT-BY-PRODUCT DIRECT REQUIREMENTS MATRIX FOR THE CHLORINE LCA EXAMPLE... 371 TABLE 7-8: PRODUCT-BY-PRODUCT TOTAL REQUIREMENTS MATRIX FOR THE CHLORINE LCA EXAMPLE... 372 TABLE 7-9: VECTORS OF PRODUCT REQUIREMENTS AND EQUIVALENT PRODUCTION REQUIREMENTS FOR THE
CHLORINE LCA EXAMPLE... 373 TABLE 7-10: THROUGHPUT REQUIREMENTS VECTORS FOR THE CHLORINE LCA EXAMPLE... 374 TABLE 7-11: LIFE CYCLE ENVIRONMENTAL EXCHANGES INVENTORY AND MATRICES OF PROCESS CONTRIBUTIONS TO
THE INVENTORY FOR THE CHLORINE LCA EXAMPLE... 375 TABLE 7-12: CHARACTERIZATION AND VALUATION FACTORS USED IN THE CHLORINE LCA EXAMPLE... 378 TABLE 7-13: LIFE-CYCLE IMPACT VALUATION FOR THE CHLORINE LCA EXAMPLE, SHOWING ENVIRONMENTAL
EXCHANGE AND IMPACT CATEGORY CONTRIBUTIONS... 380 TABLE 7-14: LIFE-CYCLE IMPACT VALUATION FOR THE CHLORINE LCA EXAMPLE, SHOWING PROCESS AND IMPACT
CATEGORY CONTRIBUTIONS... 381 TABLE 7-15: ENVIRONMENTAL INDICATORS PER UNIT OF PRODUCT FOR THE CHLORINE LCA EXAMPLE... 384
TABLE 7-16: ENVIRONMENTAL IMPACT VALUATIONS PER UNIT OF ENVIRONMENTAL EXCHANGE FOR THE CHLORINE LCA EXAMPLE... 385 TABLE 7-17: ENVIRONMENTAL INDICATORS PER UNIT OF PROCESS THROUGHPUT FOR THE CHLORINE LCA EXAMPLE
(DIRECT AND INDIRECT IMPACTS)... 386 TABLE 7-18: ENVIRONMENTAL INDICATORS PER UNIT OF PROCESS THROUGHPUT FOR THE CHLORINE LCA EXAMPLE
(DIRECT IMPACTS ONLY)... 387 TABLE 7-19: TECHNICAL COEFFICIENT MATRICES FOR THE CHLORINE LCA EXAMPLE, INCORPORATING A
COGENERATION PROCESS INTO THE PROCESS NETWORK... 390 TABLE 7-20: MARKET SHARE MATRIX FOR THE PRODUCTION OF CHLORINE UNDER CA. 1990 WESTERN EUROPEAN
CONDITIONS... 392 TABLE 7-21: LINEAR PROGRAMMING RESULTS FOR THE CHLORINE LCA EXAMPLE... 411 TABLE 9-1: LISTING OF RECORDS IN THE DISTRIBUTIONS TABLE OF THE ENVEVALTOOL DATABASE... 451 TABLE 9-2: CORRELATIONS AMONG PROBABILITY DISTRIBUTIONS FOR IMPACT CATEGORY VALUATION FACTORS
DERIVED FROM THE EPS METHOD... 452 TABLE 9-3: SOURCES OF DATA FOR PHYSICAL PROPERTIES USED IN EXPOSURE MODELING... 453 TABLE 9-4: SOURCES OF DATA FOR FACTORS CHARACTERIZING THE CONTRIBUTIONS OF CHEMICALS TO SPECIFIC
ENVIRONMENTAL PROBLEMS... 453 TABLE 9-5: RANK ORDER OF SOURCES OF HENRY'S LAW CONSTANT DATA USED IN THE ENVEVALTOOL DATABASE455 TABLE A-1: INPUT DATA FOR THE METHYLENE CHLORIDE RECOVERY OPTIMIZATION PROBLEM... 472 TABLE A-2: UNIT OPERATION MODELS USED... 474 TABLE A-3: NOMINAL VALUES FOR THE PARAMETERS IN THE NRTL MODEL... 475 TABLE A-4: NRTL PARAMETER DATA SETS STORED IN THE ASPEN PLUS DATA BANKS... 475 TABLE A-5: PRODUCTS AND PROCESSES IN THE PIO-LCA MODEL USED FOR THE ENVIRONMENTAL EVALUATION OF
THE ALTERNATIVES IN THE SOLVENT RECOVERY EXAMPLE... 476 TABLE A-6: OVERALL HEAT TRANSFER COEFFICIENTS FOR HEAT EXCHANGERS TRANSFERRING HEAT BETWEEN TWO
AQUEOUS STREAMS... 480 TABLE A-7: METHYLENE CHLORIDE EFFLUENT CONCENTRATION LIMITS FOR SEVERAL U.S. JURISDICTIONS... 482 TABLE A-8: MARGINAL DISTRIBUTIONS FOR THE UNIT ENVIRONMENTAL IMPACT OF KEY INPUTS AND OUTPUTS IN THE
SOLVENT RECOVERY CASE STUDY... 484 TABLE A-9: RANK CORRELATION MATRIX OBTAINED FOR THE SOLVENT RECOVERY CASE STUDY UNIT
1.1 Thesis
Statement
This thesis focuses on the development of systematic procedures for incorporating knowledge and concerns about environmental impacts into the design of chemical processes, recognizing and managing the uncertainties associated with the evaluation of potential environmental impacts. This dissertation aims to tackle the challenge of linking traditional process design (modeling within the plant), with environmental assessment (modeling of the interactions of a chemical process with the environment), while recognizing the diversity of value judgements regarding the environment (building value models).
Several benefits can be expected from an explicit incorporation of environmental objectives in chemical process design:
• Lower environmental impacts from new and retrofitted processes as compared with processes designed only with environmental compliance in mind.
• Anticipation and avoidance of future regulations that could impact a process, since new regulations are typically introduced years after knowledge regarding environmental hazards first becomes available.
• Discovery of design alternatives with superior economic performance, since superior environmental performance is often associated with materials and energy efficiency. Typically a designer will consider a very narrow set of alternatives within the possible universe of design alternatives. Procedures that identify design features leading to environmental problems, in conjunction with procedures that identify the major contributors to process costs, should be useful in focusing the attention of process designers on a richer set of design alternatives.
• Improved allocation of environmental protection resources within an organization that operates chemical processes.
• Improved relations with the communities that implicitly or explicitly give a corporation the license to build and operate chemical processes, since the major concerns of outside
stakeholders can be incorporated into the environmental value models used to evaluate designs.
The research problem examined here is a special case of the more general problem of designing a system when the designer is uncertain about (but not indifferent to) the tradeoffs among conflicting objectives, and about how to measure the extent to which an objective is met. The procedures developed in this project should be applicable in many other multi-criteria design settings.
1.2 Structure
of
Thesis
The thesis is organized into two parts. The first part (Chapters 2 to 5) concentrates on the design process itself. Figure 1-1 shows a flow diagram for the activities in the design process. Given a problem statement, design teams will generate alternatives, analyze them (perhaps through the use of process models), and evaluate their merit. Several iterations will be undertaken (inner loop) until no further opportunities to improve the design are perceived within the current problem framing. The term problem framing is used here to refer to the set of explicit or implicit decisions that set the scope for the design effort. Sensitivity analysis can be used to assess the impact of these decisions, and refine them if necessary (outer loop). A proposed design will emerge from this process once the design team is satisfied that no further significant improvement opportunities are available to them within the time framework allocated to the project.
Chapter 2 reviews the literature on design procedures for chemical processes that
explicitly consider environmental issues. The organizational framework for the review is the design process itself, as shown in Figure 1-1.
Chapter 3 highlights the role of design as a tradeoff resolution exercise. The chapter
discusses how designers use economic valuation models for guidance in the resolution of the tradeoffs inherent to process design. Every design implies a set of material and energy flows, as well as a set of processing equipment specifications. Economic value models map this information into widely understood metrics (revenues, operating costs, and capital costs) and summarize them into indicators that can be used to rank alternatives (e.g. net present value, internal rate of return, or total annualized cost). The chapter discusses how the widely used
economic value models introduce a bias against capital expenditures in the conceptual phase of process design, which in turn leads to material use, energy consumption, and waste generation rates that are in excess of those that would be economically optimum. This finding is consistent with published accounts of the abundance of overlooked energy conservation and waste reduction projects with rates of return in excess of 100%/year. The second half of the chapter introduces environmental valuation models. Environmental valuation models are a necessary requirement for incorporating environmental concerns as design objectives. These models map the information on equipment and material and energy flows implied by a design into environmental impact metrics. An environmental problem oriented framework is advocated for the structuring of environmental value models. The framework recognizes explicitly that value judgments are needed to generate an indicator of overall environmental performance. Conceptually, there is no difference between economic and environmental value functions. The main distinction comes from differences in data availability and precision.
Problem Statement Generation of Alternatives Analysis Evaluation and Optimization Sensitivity Analysis Design Concept definition Technology choices Analysis boundaries Level of detail Level of accuracy Treatment of uncertainty Objectives Objective function Constraints Stopping rules Problem Framing
ch 4
ch 5
ch 3
ch 2
Given the uncertainties inherent to the data used in environmental valuation models,
Chapter 4 discusses decision making under uncertainty in the context of process design. After
reviewing the types of uncertainty present in process design, the chapter shows that even if there is significant uncertainty associated with the absolute value of a design metric, there might be considerable less uncertainty in the selection of a superior design among various alternatives based on that metric. The reason is the potential for a high degree of correlation among distributions for the performance metrics of competing alternatives. It follows that the key to the successful use of environmental value models in process design is to structure the models and the decision procedures in a way that preserves the underlying correlation structure. The procedures described in this chapter enable the designer to select superior designs and to assess the confidence with which a design can be judged to be superior to other alternatives. In some cases, the uncertainties in a valuation function will not permit the distinction among competing design alternatives, based upon the criteria the valuation function is trying to measure. This is also a useful result, since it tells the designer that other criteria should be used to distinguish among alternatives.
Chapter 5 describes two important types of sensitivity analysis. The first type of
analysis is used to identify the features of a design that have the largest contribution to its performance. This analysis consists of propagating the uncertainty in the relative contribution of individual design features to the overall measure of performance of a design. This type of analysis is very useful for establishing promising directions in the generation of new alternatives. The second type of sensitivity analysis examines the contribution of model uncertainties and value function uncertainties to the uncertainty in the discrimination between two competing alternatives. This type of sensitivity analysis provides guidance for allocating resources to collect the data that would be most helpful to decision making. A key conclusion obtained in this chapter is that even though an environmental valuation model might contain hundreds of uncertain factors, only a few of them are typically significant contributors to design choice uncertainty. Generous uncertainty bounds may be placed on uncertain data elements at a first iteration, followed by careful examination of the minority of factors that turn out to be important in decision-making.
design decisions material flows utility demands equipment specs emissions environmental concentrations exposures environmental performance indicators Environmental knowledge base physical properties potency factors Input output factors Design parameters
ch 6
ch 7
ch 9
Process Model Input Output LCA model Fate, transport and exposure model Environmental value functionch 8
Uncertainty propagation
Figure 1-2: Structure of Thesis. Part II: Environmental Evaluation Tools
The second part of thesis (chapters 6 to 9) describes the set of computer-aided tools used to compute uncertainty distributions for the environmental impact valuation indicator of process design alternatives. The computation of environmental indicators corresponding to a set of design decisions requires several modeling steps. First, a process model is used to compute mass and energy balances, as well as basic equipment design specifications. This information then needs to be translated into a vector of environmental interventions (e.g. air emissions) associated with each process input and output. For the case of raw materials and services, emissions should include estimates of the emissions associated with upstream processes (life-cycle view). Information about emissions can then be converted into estimates of environmental concentrations and estimates of exposure through the use of multimedia fate, transport and exposure models. Finally, indicators for the contribution of each chemical to each environmental problem of interested can be computed. Aggregation of individual environmental impact category scores into a final indicator is done using weighting factors derived from the preferences of decision-makers or organizations.
Chapter 6 argues that the evaluation of the potential environmental impact of toxic
releases should be given high priority within the environmental evaluation of chemical process designs. The chemical industry is responsible (directly or indirectly) for a large fraction of the releases of toxic chemicals to the environment. In addition, the public is more concerned about toxic releases from chemical plants than about other environmental impacts the chemical industry might cause. Available indicators of toxicity potential are reviewed, and it is argued that most of them are inadequate for use in the procedures described in chapters 4 and 5 because they either include too few chemicals, or do not provide information regarding the uncertainty in the indicators. It is widely accepted that risk due to exposure to toxic chemicals is proportional to exposure and toxicity. A spreadsheet-based model of chemical fate, transport and exposure that allows propagation of uncertainties while preserving correlation structure was developed as part of this dissertation. The model is needed to relate emissions to impacts. The human exposure model includes improved models for bioaccumulation through the terrestrial food chain (the most widely used models currently in use have the potential for grossly overestimating terrestrial food chain bioconcentration of chemicals with high octanol-water and octanol-air partition coefficients, since these models are not constrained by mass balances). The fate, transport and exposure models are applied to a data set of 1300 chemicals to identify the model and parametric uncertainties that have the largest impact on the distribution of relative exposures. This analysis provides a roadmap for advancing research in exposure modeling. The chapter also describes the development of a tool for assessing the information content of indicators. This tool is applied to the assessment of the information content of the indicators in EPA’s Waste Minimization Prioritization Tool (WMPT). The WMPT assigns toxicity, persistence and bioaccumulation scores to chemicals based on a fence line approach, in which chemicals receive a discrete score of 1, 2 or 3 on each criterion. The EPA adopts this approach in order to be able to combine data of different levels of quality. The example shows that the fence line procedure dilutes the quality of the data to the lowest common denominator, resulting in an indicator with significantly less information content than the one developed in this work using the same underlying data. The chapter closes with a comprehensive assessment of the potential environmental impact of the releases to the environment reported in the Toxics Release Inventory.
Chapter 7 develops the process-by-product input-output life cycle assessment
methodology (PIO-LCA) as a way to manage uncertain life-cycle assessment data in a way that enables the generation of uncertain life-cycle impact indicators without sacrificing correlation structure. Life-cycle assessment tools are needed in the context of environmental evaluation of chemical processes in order to take into account the impacts generated by the upstream processes that provide the inputs used by a design. A key feature of the procedure is the transparent and consistent treatment of multiproduct processes and products produced in multiple processes through economic allocation rules.
Chapter 8 shows how economic and environmental valuation models with uncertain
parameters can be integrated with the flowsheet models that are the main tool used by chemical process designers today. The deterministic equivalent modeling method (DEMM) is used to generate spreadsheet-based polynomial chaos expansion metamodels of the process flowsheet models. The metamodels capture the impact of uncertainties in physical parameters on process performance, which can be combined with spreadsheet-based economic and environmental valuation models. The resulting combined model can be used for stochastic optimization and sensitivity analysis, enabling the designer to identify the parameters (physical, economic, or environmental) that have the largest impact on the ranking of competing alternatives.
Chapter 9 discusses needs and strategies for managing the available knowledge that is
relevant to environmental valuation models. It describes the data model, data sources, and system functions of the database application developed in this project. The chapter closes with recommendations for implementing systems of this kind within organizations, as well as recommendations to public generators and providers of environmental evaluation data (governmental and academic organizations).
1.3 Summary of Contributions
The following list contains the major contributions made to enable designers to include environmental concerns as an explicit objective in their designs.
• Explicit use of uncertainty propagation and uncertainty analysis as a means to cope with partial information regarding environmental impacts.