3. The Cost to Developing Countries of Adapting to Climate Change: New Methods and Estimates
Country Case Studies:
1. Bangladesh: Economics of Adaptation to Climate Change
2. Bolivia: Adaptation to Climate Change: Vulnerability Assessment and Economic Aspects 3. Ethiopia : Economics of Adaptation to Climate Change
4. Ghana: Economics of Adaptation to Climate Change 5. Mozambique: Economics of Adaptation to Climate Change 6. Samoa: Economics of Adaptation to Climate Change 7. Vietnam: Economics of Adaptation to Climate Change
Discussion Papers:
1. Economics of Adaptation to Extreme Weather Events in Developing Countries 2. The Costs of Adapting to Climate Change for Infrastructure
3. Adaptation of Forests to Climate Change
4. Costs of Agriculture Adaptation to Climate Change 5. Cost of Adapting Fisheries to Climate Change
6. Costs of Adaptation Related to Industrial and Municipal Water Supply and Riverine Flood Protection
7. Economics of Adaptation to Climate Change-Ecosystem Services
8. Modeling the Impact of Climate Change on Global Hydrology and Water Availability 9. Climate Change Scenarios and Climate Data
10. Economics of Coastal Zone Adaptation to Climate Change
11. Costs of Adapting to Climate Change for Human Health in Developing Countries 12. Social Dimensions of Adaptation to Climate Change in Bangladesh
13. Social Dimensions of Adaptation to Climate Change in Bolivia 14. Social Dimensions of Adaptation to Climate Change in Ethiopia 15. Social Dimensions of Adaptation to Climate Change in Ghana 16. Social Dimensions of Adaptation to Climate Change in Mozambique 17. Social Dimensions of Adaptation to Climate Change in Vietnam
18. Participatory Scenario Development Approaches for Identifying Pro-Poor Adaptation Options 19. Participatory Scenario Development Approaches for Pro-Poor Adaptation: Capacity
©2010 Th e International Bank for Reconstruction and Development/Th e World Bank 1818 H Street NW
Washington DC 20433 www.worldbank.org
socialdevelopment@worldbank.org All rights reserved.
Th is paper has not undergone the review accorded to offi cial World Bank publications. Th e fi ndings, interpretations, and conclusions expressed herein are those of the author(s) and do not necessarily refl ect the views of the International Bank for Reconstruction and Development / Th e World Bank and its affi liated organizations, or those of the Executive Directors of Th e World Bank or the governments they represent.
Th e World Bank does not guarantee the accuracy of the data included in this work. Th e boundaries, colors, denominations, and other information shown on any map in this work do not imply any judgement on the part of Th e World Bank concerning the legal status of any territory or the endorsement or acceptance of such boundaries.
RI G H T S A N D P ER M I S S I O N S
Th e material in this publication is copyrighted. Copying and/or transmitting portions or all of this work without permission may be a violation of applicable law. Th e International Bank for Reconstruction and Development / Th e World Bank encourages dissemination of its work and will normally grant permission to reproduce portions of the work promptly.
For permission to photocopy or reprint any part of this work, please send a request with complete information to the Copyright Clearance Center, Inc., 222 Rosewood Drive, Danvers, MA 01923, USA, telephone 978-750-8400, fax 978-750-4470, www.copyright.com. All other queries on rights and licenses, including subsidiary rights, should be addressed to the Offi ce of the Publisher, Th e World Bank, 1818 H Street NW, Washington, DC 20433, USA, fax 202-522-2422, e-mail pubrights@worldbank.org
Abbreviations and Acronyms ix Acknowledgments xi Executive Summary xv I. Introduction 1 Context 1 Objectives 1
Approaches: the two parallel tracks 2
The Synthesis Report 2
II. Concepts, methodology, and limitations 5
Concepts 5
Dealing with uncertainty 8
Methodology 10
Limitations 13
Future Work 16
III. Results from the global analyses 19
Putting a price tag on adaptation 19
Putting the fi ndings in context 23
Lessons 25
IV. Results from the country analyses 29
Mozambique 30 Ethiopia 38 Ghana 47 Bangladesh 54 Bolivia 63 Vietnam 70 Samoa 80
V. Lessons 89
The costs of adapting to climate change 89
Economic development and adaption to climate change 90
Climate uncertainty: the need for robust strategies 91
Current climate vulnerabilities 93
Hard vs. soft approaches to adaptation 94
Conclusion 96
References 97
Notes 100
Figures
Figure ES-1 Pulling Together the Key Findings xvi
Figure ES-2 A Two-Track Approach xvii
Figure ES-3 Adaptation in Mozambique Entails Greater Climate Resilience xxiii Figure ES-4 Adaptation Signifi cantly Lowers Welfare Losses in Ethiopia xxiv
Figure 1 Study Structure: Global and Country Tracks 2
Figure 2 Study Methodology: Global and Country Tracks 11 Figure 3 Total Annual Cost of Adaptation and Share of Costs, 20
NCAR and CSIRO Scenarios, by Region
Figure 4 Total Annual Cost of Adaptation for the National Centre 21 For Atmospheric Research (NCAR) Scenario, by Region and Decade Figure 5 Total Annual Cost of Adaptation for the National Centre for 21
Atmospheric Research (NCAR) Scenario, by Region and Decade
Figure 6 Development Lowers the Number of People Killed by Floods and 25 Affected by Floods and Droughts, 2000–50
Figure 7 Population Density and Coastal Area 32
Figure 8 Agriculture: Effects on Yield in 2050 Compared to Baseline 34 Figure 9 Decomposition of Impact Channels From a Macroeconomic Perspective 34
Figure 10 Reduction in CC Damages, 2003–50 35
Year-To-Year Growth Rates
Figure 12 Agroecological Zones in Ethiopia 39
Figure 13 Deviations of GDP From Base Scenario 40
Figure 14 Agricultural Year-to-Year Growth Rates: Standard Deviations 40 Figure 15 Regional GDP, Deviation From Base, Wet2 Standard Deviations 41 Figure 16 Net Present Value (NPV) of Welfare Differences 42 Figure 17 Standard Deviation of Year-To-Year Agriculture GDP Growth Rates, 43
with and without Adaptation
Figure 18 Benefi t/Cost Ratio of Upgrading Road Standards 45 Figure 19 Surface Flow Average Difference from the No-Climate-Change
Scenario, 2010–50
Figure 20 Deviation of Real Total and Agricultural GDP from Base, 49 Terminal Year
Figure 21 Maps of Poverty, Flooding and Tidal Surges 55 Figure 22 Inundation Risk from Storm Surges in Coastal Areas With and 57
Without Climate Change in Relation to Current Population Density
Figure 23 Inundation Risk From Storm Surges in Coastal Areas with and 58 without Climate Change In Relation to Current Poverty Rates
Figure 24 Change In Inundation Depth (CM) From Monsoon Flooding 59 (with and without CC)
Figure 25 Projected National Rice Production with and without Climate Change 60 Figure 26 Annual Percent Change in Agricultural GDP 64
from El Niño and La Niña Effects
Figure 27 Projected Precipitation Changes to 2050 under 64 Different Climate Scenarios
Figure 28 Changes In Runoff for the Red River and Mekong Delta 75 by Climate Scenario
Figure 29 Regions of Samoa Used in the Climate-Economy Model 81
Tables
Table ES-1 East Asia and Pacifi c Will Shoulder the Biggest Burden xix Table ES-2 Infrastructure, Coastal Zones, and Water Capture xx
Table ES-3 Getting a Better Picture xxii
Table ES-4 Key Adaptation Options in Mozambique xxiii
Table ES-5 Better Road Design Standards Are a High Priority for Ghana xxiv Table ES-6 Polders and Cyclone Shelters are Key for Bangladesh’s xxv
Cyclone-Induced Storm Surges
Table ES-7 Agricultural Adaptation in Vietnam Reduces xxvi Inequalities and Helps Gdp
Table ES-8 Better Design Standards Would Enhance Samoa’s Resilience xxvii
Table 1 Recommendations for Future Work 17
Table 2 Total Annual Costs of Adaptation for All Sectors, by Region, 2010–50 19 Table 3 Comparison of Adaptation Cost Estimates by the Unfccc 24
and the Eacc, $ Billions
Table 4 Sector Analyses Carried Out in Each Country Case Study 30
Table 5 Key Adaptation Options in Mozambique 37
Table 6 Adaptation Costs 42
Table 7 Adaptation Costs and Residual Damage 43
Table 8 Gcm Scenarios for the Ghana Case Study 48
Table 9 Real Welfare Impacts with No Adaptation Investments 51 Table 10 Deviations of Real Welfare from Baseline under Alternative 52
Adaptation Strategies
Table 11 Cost of Adapting to Tropical Cyclones and Storm Surges by 2050 61 Table 12 Total Adaption Cost for Inland Flooding by 2050 61 Table 13 Cost-Benefi t Analysis of Adaptation Measures in the Agriculture 69
and Water Sectors
Table 14 Regional Vulnerability to Climate Change 72
Table 15 Change In Crop Production In 2050 Due To Climate Change 75 with no Adaptation
Table 16 Macroeconomic Effects of Climate Change 77
without/with Adaptation in 2050
Table 17 Deviations in Precipitation and Temperature in 2050 82 by Climate Scenario
Table 18 Losses Due to Climate Change without and with Adaptation 83 Table 19 Average Adaptation Costs by Decade, High Scenario, 86
Boxes
Box 1 Cge Models—Partial and General Equilibrium Analysis 31 Box 2 Methodology and Field Work of Social Component in Mozambique 38 Box 3 Past Experience Adapting to Extreme Climate Events in Bangladesh 56 Box 4 Local Factors Infl uence Local Adaptation Preferences in Bolivia 71
Abbreviations and Acronyms
AR4 Fourth Assessment Report of the Intergovernmental Panel on Climate Control
BAP Bali Action Plan
CGE Computable general equilibrium (model)
CLIRUN Climate and runoff (model)
CMIP3 Coupled Model Intercomparison Project phase 3
CSIRO Commonwealth Scientifi c and Indus-trial Research Organization (climate model)
DALY Disability-adjusted life years
DIVA Dynamic and interactive vulnerability assessment (model)
EACC Economics of Adaptation to Climate Change
EAP East Asia and Pacifi c (World Bank region)
ECA Europe and Central Asia (World Bank region)
ENSO El Niño Southern Oscillation
GCM General circulation model
GDP Gross domestic product
IMPACT International model for policy analysis of agricultural commodities and trade
IPCC Intergovernmental Panel on Climate Change
LAC Latin America and Caribbean (World Bank Region)
MIP Mixed integer programming (model)
MIROC Model for interdisciplinary research on climate
MNA Middle East and North Africa (World Bank Region)
NAPA National Adaptation Plans of Action
NCAR National Centre for Atmospheric Research (climate model)
NGO Nongovernmental organization
ODA Offi cial development assistance
OECD Organisation for Economic Co-operation and Development
PNC National Watershed Program (by its Spanish acronym)
PPM Parts per million
PSD Participatory scenario development
SAR South Asia (World Bank region)
SRES Special Report on Emissions Scenarios (of the IPCC)
SSA Sub-Saharan Africa (World Bank region)
UN United Nations
UNDP United Nation Development Program
UNFCCC United Nations Framework
Conven-tion on Climate Change
WCRP World Climate Research Programme
WHO World Health Organization
Note: Unless otherwise noted, all dollars are U.S.
Th e Economics of Adaptation to Climate Change (EACC) study has been a large, multiyear undertaking managed by a core team of the World Bank’s Envi-ronment Department led by Sergio Margulis (Task Team Leader) and comprising Urvashi Narain, Kiran Pandey, Laurent Cretegny, Ana Bucher, Robert Sch-neider, Gordon Hughes, and Timothy Essam. Robin Mearns, Anne Kuriakose, and Carina Bachofen coor-dinated the social dimensions of the study. Th e study would not have been possible without the exceptional administrative support from Hawanty Page, Jasna Vukoje, Grace Aguilar, Hugo Mansilla, Arathi Sun-daravadanan, and Patricia Noel.
Since the beginning, the EACC team has had intense interaction with the Environment Depart-ment’s management, particularly Warren Evans and Michele de Nevers, who are an integral part of the EACC team. Th e team is also immensely grateful to Ravi Kanbur, Sam Fankhauser, and Joel Smith for serving on the advisory committee, providing overall guidance to the team, and resolving critical technical and strategic issues.
A very large number of people have directly worked on the various reports and background studies, and an even larger number of people have provided direct and indirect support and advice to the teams. It will be hard to do justice individually to all people, so we simply list the main teams of the EACC study and acknowledge indirect contributions in the end.
Synthesis Report. Sergio Margulis, Gordon Hughes,
Robert Schneider, Kiran Pandey, and Urvashi Narain with editorial services from Bruce Ross-Larson, Laura Wallace, and Robert Livernash and adminis-trative support from Hugo Mansilla. Contributions to the country case studies were provided by the respective country teams listed below.
Global Track Report. Sergio Margulis and Urvashi
Narain (coordinators), Laurent Cretegny, Anne Kuriakose, Glenn Marie Lange, and Kiran Pandey (World Bank), as well as Paul Chinowsky, Gordon
Hughes, David Johnson, Paul Kirshen, Gerald Nel-son, James Neumann, Robert Nicholls, Jason Price, Adam Schlosser, Robert Schneider, Roger Sedjo, Kenneth Strzepek, Rashid Sumaila, Philip Ward, and David Wheeler (consultants). Major contributions were made by Carina Bachofen, Brian Blankespoor, Ana Bucher, David Corderi, Susmita Dasgupta, Timothy Essam, Robin Mearns, Siobhan Murray, Hawanty Page, and Jasna Vukoje (World Bank), and Jeroen Aerts, Steve Commins, William Farmer, Eihab Fathelrahman, Prodipto Ghosh, Dave Johnson, James Juana, Tom Kemeny, Benoit Laplante, Larissa Leony, Linh Phu, Mark Rosegrant, Klas Sanders, Arathi Sundaravadanan, Timothy Th omas, and Tingju Zhu (consultants). Sally Brown and Susan Hanson made important contributions to the coastal sector report; Miroslac Batka, Jawoo Koo, David Lee, Marilia Magalhaes, Siwa Msangi, Amanda Palazzo, Claudia Ringler, Richard Robertson, and Timothy Sulser to the agriculture sector report; William Cheung to the fi shery sector report; and Pieter Pauw and Luke M. Brander to the water sector report (consultants).
Africa Country Case Studies. Overall coordination
by Raff aello Cervigni and Aziz Bouzaher (former coordinator), with contributions by Stephen Mink and Stephen Ling (World Bank).
Ethiopia. Raff aello Cervigni (coordinator), Aziz
Bouzaher (former coordinator); Principal authors were Kenneth Strzepek, Sherman Robinson, Len Wright and Raff aello Cervigni; additional experts on the team were Paul Block, Brent Boehlert, Paul Chi-nowsky, Chas Fant, William Farmer, Alyssa McClus-key, Michelle Minihane, Niko Strzepek, and Gete Zeleke. Th e World Bank team comprised Marie Ber-nadette Darang, Susmita Dasgupta, Edward Dwum-four, Achim Fock, Francesca Fusaro, Anne Kuriakose, Stephen Ling, Sergio Margulis (team leader of the overall EACC study), Stephen Mink, Kiran Pandey, Dawit Tadesse, and Fang Xu.
Mozambique. Jean-Christophe Carret
Chinowsky, Anne Kuriakose (World Bank), James Neumann, Robert Nicholls, James Th urlow, and Len Wright with support from Carina Bachofen (World Bank), Sally Brown, Charles Fant, Adèle Faure, Susan Hanson, Abiy Kebede, Jean-Marc Mayotte, Michelle Minihane, Isilda Nhantumbo, and Raphael Uaiene (all Consultants except as noted) authored the report. Inputs were also provided by Aziz Bouzaher, Raf-faello Cervigni, Sergio Margulis(team leader of the overall EACC study), Stephen Mink, and Antonio Nucifora (all World Bank).
Ghana. Peter Kristensen (coordinator) and Robin
Mearns (World Bank); Channing Arndt, Dirk Willenbockel, Kenneth Strzepek, Eihab Fathelrah-man, Robert Nicholls, Len Wright, Chas Fant, Paul Chinowsky, Alyssa McCluskey, Sherman Robinson, Michelle Minihane, William Farmer, Brent Boehlert, Jean-Marc Mayotte, Tony Dogbe, Joseph Yaro, David Pessey, Emilia Arthur, George Ahiable, Tia Yahaya, Kamil Abdul Salam, Samantha Boardley, Simon Mead, and Livia Bizikova (consultants). Other con-tributors include Aziz Bouzaher, Raff aello Cervigni, Anne Kuriakose, Sergio Margulis, Stephen Mink, Urvashi Narain, Kiran Pandey, and John Fraser Stew-art (World Bank) as well as Saadia Bobtoya, John Asafu-Adjaye, Dyson Jumpah, Daniel Bruce Sar-pong, Philip Acquah, Robert Schneider,and Victoria Bruce-Goga (consultants).
Bangladesh. Kiran Pandey (coordinator), Nilufar
Ahmad, Susmita Dasgupta, Shakil Ferdausi, Anne Kuriakose, Khawaja M. Minnatullah, Winston Yu (World Bank), Mainul Huq, Zahirul Huq Khan, Manjur Murshed Zahid Ahmed, Ainun Nishat, Nandan Mukherjee, Malik Fida Khan, and Zulfi qar Iqbal (consultants).
Th e Plurinational State of Bolivia (hereafter referred to as Bolivia). Ana Bucher
(coordina-tor), Carina Bachofen, Robert Schneider, Laurent Cretegny, David Corderi, Morten Blomqvist, Anne Kuriakose, and Ruth Llanos (World Bank);Magali García Cárdenas, Jorge Cusicanqui, Bruno Condori
Alí, Victoria Parra Goitia, Gladys Tesoro Michel, Carmen Rosa Del Castillo Gutierrez, Consuelo Luna, Claudia Canedo, Carlos Cabrera, Alvaro Lambert, Victor Vazquez, Erwin Kalvelagen, Miguel Morales, Fernando Cossio, and Valeria Sanchez (consultants).
Samoa. Laurent Cretegny and Sergio
Margu-lis (coordinators), Gordon Hughes (consultant) with contributions from Timothy Essam (World Bank); Simon Bannock, Michele Daly, Erwin Kalvelagen, Peter King, Th akoor Persaud, Isikuki Punivalu, Graeme Roberts, and Fernanda Zermoglio (consultants).
Vietnam. Benoit Laplante (coordinator), David
Corderi, Laurent Cretegny, Douglas Graham, Steve Jaff ee, Robin Mearns, and Anne Kuriakose (World Bank), Gordon Hughes (consultant) with contribu-tions from Huynh Th uy (consultants); Tingju Zhu and Zhe Guo (IFPRI); Le Heng Nam, Nguyen Th uy Hang, Ha Le Th anh, and Th uy Dung (Insti-tute of Water Resources Planning); Do Duc Dung (Southern Institute of Water Resources planning); Philip Adams, James Giesecke, Michael Jerie, and Nhi Hoang Tran (Centre of Policy Studies, Monash University); To Trung Nghia, Le Hung Nam, Le Hong Tuan, Truong Trong Luat, and Vu Dinh Huu (Institute of Water Resources and Planning); Pham Quang Ha, Mai Van Trinh, Tran Van Th e, and Vu Duong Quynh (Institute for Agricultural Envi-ronment); Bao Th anh, Luong Van Viet, Nguyen Th i Phuong, and Bui Chi Nam (Sub-Institute of Hydrometeorology and Environment of South Viet Nam); Tuyen Nghiem, Hue Le, and Huoung Vu Dieu (Center for Natural Resources and Envi-ronmental Studies); Pamela McElwee (Arizona State University); Dang Th u Phuong (Challenge to Change); Nguyen Van Be, Le Canh Dung, Nyuyen Hieu Trung and Sinh Le Xuan(Can Th o University); Suan Pheng Kam, Marie Caroline Badjeck, Michael Phillips, and Robert Pomeroy(World Fish Center); Louise Teh and Lydia Th e (University of British Columbia); Be Nam Vo Th i (Sub-National Institute for Agricultural Planning and Projection); and Hien
Th an Th i and Hue Nguyen Th u (Centre for Marine-life Conservation and Community Development). Th e team is also grateful for both general and specifi c comments received from the following colleagues: Julia Bucknall, Shanta Devarajan, Marianne Fay, Gherson Feder, Armin Fidler, Kirk Hamilton, Tamer Rabie, Peter Rogers, Jim Shortle, Michael Toman, Gary Yohe, Vahid Alavian, Jan Bojö, Henrike Brecht, Kenneth Chomitz, Vivian Foster, Alexander Lotsch, Kseniya Lvovsky, Chopp Margulis, Dominique van Der Mensbrughe, John Nash, Ian Noble, Giovanni Ruta, Apurva Sanghi, Robert Townsend, Walter Ver-gara, and Winston Yu. From outside the Bank, they include Marten van al Aast, Shailaja Annamraju, Roy Brouwer, Maureen Cropper, Anton Hilbert, Chris-tine Pirenne, Tamsin Vernon, Peter Wooders, and Vincent-van Zeijst. None of these colleagues and reviewers are in any way responsible for the contents and eventual errors of this report, which remain the sole responsibility of the study team.
Th e EACC study was conducted by a partnership consisting of the World Bank (leading its techni-cal aspects); the governments of the Netherlands, the United Kingdom, and Switzerland (funding the study); and the participating case study countries. Th e team would like to thank the partnership that initiated, funded, and actively engaged with the study team through its multiyear journey.
As developing countries weigh how best to revitalize their economies and craft a sustainable development path to boost living standards, they will have to factor in the reality that the global annual average tempera-ture is expected to be 2º C above pre-industrial levels by 2050. A 2º warmer world will experience more intense rainfall and more frequent and more intense droughts, fl oods, heat waves, and other extreme weather events. As a result, it will have dramatic implications for how countries manage their econo-mies, care for their people and design their develop-ment paths. Countries will need to adopt measures to adapt to climate change. Th ese measures off er a way to make the eff ects of climate change less disruptive and spare the poor and the vulnerable from shoulder-ing an unduly high burden.
Against this backdrop, the global community adopted the Bali Action Plan at the 2007 United Nations Cli-mate Change Conference. Th e plan calls for devel-oped countries to allocate “adequate, predictable, and sustainable fi nancial resources and new and additional resources, including offi cial and concessional funding for developing country parties”1 to help them adapt to climate change. It also underscores that interna-tional cooperation is essential for building capacity to integrate adaptation measures into sectoral and national development plans.
How high will the price tag be? Studies to date have provided only a wide range of estimates, from $4 bil-lion to $109 bilbil-lion a year. Th at is why the Economics of Adaptation to Climate Change (EACC) study was initiated in early 2008 by the World Bank in partner-ship with the governments of Bangladesh, Plurina-tional State of Bolivia, Ethiopia, Ghana, Mozambique, Samoa, and Vietnam, and funded by the governments of Th e Netherlands, Switzerland, and Th e United Kingdom. Its objectives are twofold: to develop a global estimate of adaptation costs for informing the interna-tional community’s eff orts in the climate negotiations, and to help decision-makers in developing countries assess the risks posed by climate change and design national strategies for adaptation.
To address these objectives, the study was conducted on two parallel tracks: (1) a global track—a top-down approach, in which national databases were used to generate aggregate estimates at a global scale, draw-ing on a wide variety of sector studies; and (2) a
country level track—a bottom-up approach, in which
sub-national data were aggregated to generate esti-mates at economywide, sectoral, and local levels. Th is Synthesis Report integrates and summarizes the key fi ndings of a global study report and seven country
case study reports—covering Bangladesh, Bolivia,
Ethiopia, Ghana, Mozambique, Samoa, and Vietnam (Figure ES-1). By providing information on lessons learned and insights gained on adaptation to climate change from global, country, and sector-level analyses, the hope is to help policymakers worldwide prioritize actions, along with developing a robust, integrated approach for greater resilience to climate risks. Th e Report begins with the concepts and methodology used for analyses in both the global and the country case studies, including a discussion of study limita-tions. Th is is followed by a synthesis of key results from the global and country tracks and a conclusion with lessons learned.
A Call to Change Course
What are the key fi ndings of the Report? To begin with, economic development is perhaps the best hope for
adaptation to climate change. Development enables an
economy to diversify and become less reliant on sec-tors such as agriculture that are more vulnerable to climate change eff ects. It also makes more resources available for minimizing risk, and similar measures often promote development and adaptation.
Th at said, it cannot be development as usual. Adaptation will require a diff erent kind of development—such as breeding crops that are drought and fl ood tolerant, climate-proofi ng infrastructure to make it resilient to climate risks and accounting for the inherent uncer-tainty in future climate projections in development planning. And it will cost to adapt. Our global study estimates that the price tag between 2010 and 2050 for
adapting to an approximately 2oC warmer world by
2050 will be in the range of $70 billion2 to $100
bil-lion a year (World Bank 2010a).Our country studies
suggest that costs could be even higher, once cross-sectoral impacts are taken into account.
However, there are numerous “low-regret” actions— typically policies that would be priorities for devel-opment even without climate change—especially in water supply and fl ood protection. Economists regularly urge policymakers to adopt mechanisms for managing water resources that recognize the scarcity value of raw water, advice that is almost invariably ignored because of deeply embedded political inter-ests. Th e reality is that the costs of misallocation of water resources will escalate even without climate change and could be overwhelming with it. At the same time, steps must be taken to identify and help
the poor and most vulnerable—including soliciting
their views on adaptation priorities and ensuring an enabling environment (for example, providing
farmers with the tools and resources to respond to climate change) (World Bank 2010a).
Finally, given the uncertainty surrounding both cli-mate outcomes and longer-term projections of social and economic development, countries should try
to delay adaptation decisions as much as possible and
focus on low-regret actions. Th ey should also build
the resilience of vulnerable sectors. In agriculture,
for example, this would mean better management of water resources and access to extension services to give policymakers greater fl exibility in handling either droughts or waterlogging caused by fl oods.
How the Studies were Done
Th e intuitive approach to costing adaptation involves comparing a future world without climate change with a future world with climate change. Th e diff er-ence between the two worlds entails a series of actions to adapt to the new world conditions. And the costs GLOBAL STUDY
EACC SYNTHESIS REPORT
7 COUNTRY CASE STUDIES
SE C T ORS SE C T ORS Agriculture MOZAMBIQUE Sector Sector 2 Sector 3 Sector 4 ... others Water Health Coastal Infrastructure ...Others Sector Sector 2 Sector 3 Sector 4 ... others ETHIOPIA Sector Sector 2 Sector 3 Sector 4 ... others GHANA Sector Sector 2 Sector 3 Sector 4 ... others VIETNAM Sector Sector 2 Sector 3 Sector 4 ... others SAMOA Sector Sector 2 Sector 3 Sector 4 ... others BOLIVIA Sector Sector 2 Sector 3 Sector 4 ... others BANGLADESH
PULLING TOGETHER THE KEY FINDINGS
FIGURE ES-1
of these additional actions are the costs of adapting to climate. Figure ES-2 summarizes the methodological approaches of the two tracks.
For the global study, the following four steps were taken:
Picking a baseline. For the timeframe, the world in 2050 was chosen, not beyond (forecasting climate change and its economic impacts becomes even more uncertain beyond this period). Development
baselines were crafted for each sector, essentially
establishing a growth path in the absence of climate change that determines sector-level per-formance (such as stock of infrastructure assets,
level of nutrition, and water supply availability). Th e baselines used a consistent set of GDP and population forecasts for 2010–2050.
Choosing climate projections. While there is con-siderable consensus among climate scientists that climate change is unequivocal, accelerating and human-induced (IPCC 2007), there is much less agreement on how climate change will aff ect natural and social systems. For that reason, two climate scenarios were chosen to capture as large as possible a range of model predictions—from extreme wet to extreme dry.
Predicting impacts. An analysis was done to predict what the world would look like under
Sectors Agriculture Forestry Fisheries Infrastructure Water Resources Health Ecosystem Services Projections Climate Water Run-off Baseline GDP/Population Decision Rule
Economic, Social and Environmental Impacts Identification of Adaptation Measures Cost of Adaptation Cross-Sectors Coastal Zones
Extreme Weather Events
Global Track Country Track
Decision Rule Global Data Sets
Sectors Agriculture Forestry Fisheries Infrastructure Water Resources Projections Climate Water Run-off Baseline GDP/Population Participatory Scenarios w/vunerable groups
Economic, Social and Environmental Impacts Identification of Adaptation Measures Cost of Adaptation Cross-Sectors Coastal Zones
Extreme Weather Events
National Macroeconomic Analysis Sub-national Data Sets A TWO-TRACK APPROACH FIGURE ES-2
the new climate conditions. Th is meant trans-lating the impacts of changes in climate on the various economic activities (agriculture, fi sheries), on people’s behavior (consumptions, health), on environmental conditions (water availability, for-ests), and on physical capital (infrastructure).
Identifying and costing adaptation alternatives.
Adaptation actions were selected to off set the predicted impacts and to restore welfare in each of the major economic sectors analyzed—infra-structure, coastal zones, water supply and fl ood protection, agriculture, fi sheries, human health, and forestry and ecosystem services. Th e costs of these actions together with the cost implications of changes in the frequency of extreme weather events were also estimated. But a cross-sectoral analysis of costs was not feasible.
For the country studies, two additional steps were taken:
Evaluating economywide impacts. A macroeco-nomic modeling framework—known as a Com-putable General Equilibrium (CGE) model—was used to facilitate the analysis of macroeconomic and cross-sectoral eff ects of the impacts and adaptation to climate change.
Evaluating social impacts. A social component was used to gather information on preferred adaptation strategies and sequence strategies from a bottom-up, local–level perspective. It also provided new evidence on how vulnerability is socially diff erentiated, and on the importance of social accountability and good governance for achieving pro-poor, climate-resilient devel-opment. It went beyond planned adaptation, weighing the potential of adaptation taken by households, collective action, nongovernmental organizations, and the private sector.
For all of the studies, a number of concepts had to be agreed upon:
How much to adapt. Th e studies assumed that countries would fully adapt—that is, adapt up to the level at which they enjoy the same level
of welfare in the (future) world as they would have without climate change. Th is in principle overstates the costs of adaptation. Of course, governments can choose to not adapt at all, incurring all damage from climate change, or adapt to the point where benefi ts from adapta-tion equal their costs, at the margin (“optimal” adaptation).
What exactly is “adaptation”? Countries face not only a defi cit in adapting to current climate varia-tion, let alone future climate change, but also def-icits in providing education, housing, health, and other services. Th us, many countries face a more general “development defi cit,” of which the part related to climate events is termed the “adapta-tion defi cit.” Th is study makes the adaptation defi cit a part of the development baseline, so that adaptation costs cover only the additional costs to cope with future climate change.
Soft versus hard measures. “Hard” options (capital intensive) were favored over “soft” options (insti-tutions and policies)—because they are easier to quantify.
Public versus private adaptation. Th e focus was on planned adaptation (deliberate public deci-sion) rather than autonomous or spontaneous adaptation (households or communities acting on their own without public interventions but within an existing public policy framework).
How to include benefi ts. Some countries and some sectors may benefi t from changes in climate. Th e question is how to account for these gains. A number of diff erent approaches were used to account for these gains.
How to handle uncertainty. Total adaptation costs for a specifi c climate projection assume that policymakers know with certainty that a particular climate projection will materialize. Th us, the use of two extreme scenarios, wettest and driest, provides a range of estimates for a world in which decision-makers have perfect foresight. If decision-makers end up having to hedge their bets and consider both scenarios at the same time, costs will be higher.
The Global Picture
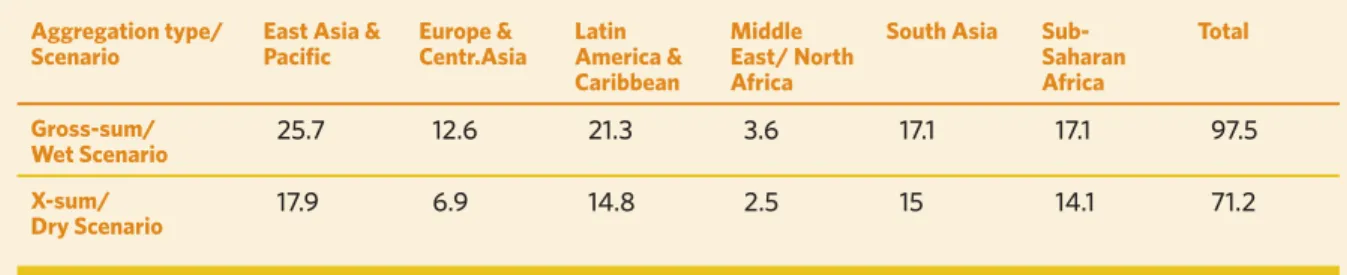
Overall, the global study estimates that the cost between 2010 and 2050 of adapting to an approxi-mately 2oC warmer world by 2050 is in the range of $70 billion3 to $100 billion a year. Th is sum is the same order of magnitude as the foreign aid that devel-oped countries now give developing countries each year. But it is still a very low percentage (0.17 percent) of the income of countries (measured by their GDP, which was roughly $60 trillion in 2009). Th e costs vary by climate scenario and whether benefi ts from climate change are used to off set adaptation costs (see Table ES-1).
Th e driest scenario (Commonwealth Scientifi c and Industrial Research Organization, CSIRO) requires lower total adaptation costs than does the wettest scenario (National Centre for Atmospheric Research, NCAR), largely because of the sharply lower costs for infrastructure, which outweigh the higher costs for water and fl ood management. In both scenarios, infrastructure, coastal zones, and water supply and fl ood protection account for the bulk of the costs. On a regional basis, for both climate scenarios, the East Asia and Pacifi c Region bears the highest
adaptation cost, and the Middle East and North Africa the lowest. Latin America and the Carib-bean and Sub-Saharan Africa follow East Asia and Pacifi c in both scenarios. On a sector breakdown, the highest costs for East Asia and the Pacifi c are in infrastructure and coastal zones; for Sub-Saha-ran Africa, water supply and fl ood protection and agriculture; for Latin America and the Caribbean, water supply and fl ood protection and coastal zones; and for South Asia, infrastructure and agriculture. Not surprisingly, both climate scenarios show costs increasing over time, although falling as a percent-age of GDP—suggesting that countries become less vulnerable to climate change as their economies grow. Th ere are considerable regional variations, however. Adaptation costs as a percentage of GDP are considerably higher in Sub-Saharan Africa than in any other region, in large part because of the lower GDPs but also owing to higher costs of adaptation for water resources, driven by changes in precipitation patterns.
On the sectoral level, the EACC fi ndings off er insights for policymakers who must make tough choices in the face of great uncertainty (see Table ES-2).
TABLE ES-1
EAST ASIA AND PACIFIC WILL SHOULDER THE BIGGEST BURDEN
(Global costs of adaptation by region)
Aggregation type/
Scenario East Asia & Pacifi c Europe & Centr.Asia Latin America & Caribbean
Middle East/ North Africa
South Asia
Sub-Saharan Africa Total Gross-sum/ Wet Scenario 25.7 12.6 21.3 3.6 17.1 17.1 97.5 X-sum/ Dry Scenario 17.9 6.9 14.8 2.5 15 14.1 71.2
Note: Gross-sum is the sum of the positive costs of adaptation in all sectors and all countries, excluding gains (negative costs) from climate
change. X-sum deducts these eventual gains in countries with overall positive costs of adaptation.
Infrastructure.4 Th is sector has accounted for the
largest share of adaptation costs in past studies and takes up a major share in the EACC study—in fact, the biggest share for the NCAR (wettest) scenario because the adaptation costs for infrastructure are especially sensitive to levels of annual and maximum monthly precipitation. Urban infrastructure—drain-age, public buildings, and similar assets—accounts for about 54 percent of the infrastructure adapta-tion costs, followed by railways at 18 percent, and roads (mainly paved) at 16 percent. East Asia and the Pacifi c and South Asia face the highest costs, refl ecting their larger populations. Sub-Saharan Africa experiences the greatest increase over time.
Coastal zones.5 Th ese zones are home to an
ever-growing concentration of people and economic activity, yet they are also subject to a number of climate risks, including sea-level rise and storm surges, and possible increased intensity of tropi-cal storms and cyclones. Th e study shows that adaptation costs are signifi cant and vary with the magnitude of sea-level rise, making it essential for policymakers to plan while accounting for the uncertainty. One of the most striking results is that Latin America and the Caribbean and East Asia and the Pacifi c account for about two-thirds of the total adaptation costs.
Water supply.6 In some parts of the world, water
avail-ability has risen and will continue to do so, but in others, it has fallen and will continue to do so—and the frequency and magnitude of fl oods are expected to rise. Th e EACC study shows that water supply and fl ood management ranks as one of the top three adaptation costs in both the wetter and drier sce-narios, with Sub-Saharan Africa footing by far the highest costs. Latin America and the Caribbean also sustain high costs under both models, and South Asia sustains high costs under CSIRO.
Agriculture.7 Climate change aff ects production by
altering yields and areas where crops can be grown. Th e EACC study shows that temperature and pre-cipitation changes in both climate scenarios will signifi cantly lower crop yields and production— with irrigated and rainfed wheat and irrigated rice aff ected the most. Developing countries fare worse for almost all crops compared to developed countries, with South Asia shouldering the biggest production declines. Moreover, the changes in trade fl ow patterns are dramatic—with exports for developed countries rising and South Asia becoming a much larger food importer under both scenarios. Th at said, the total costs for the agricultural sector relative to other sec-tors is lower than would have been expected, in part because welfare is restored through trade rather than TABLE ES-2
INFRASTRUCTURE, COASTAL ZONES, AND WATER CAPTURE THE BULK OF ADAPTATION COSTS
(Global costs of adaptation by sector, X-Sum)
Sector Wet Dry
Infrastructure 27.5 13.0
Coastal zones 28.5 27.6
Water supply and fl ood protection 14.4 19.7
Agriculture, forestry, fi sheries 2.5 3.0
Human health 2.0 1.5
Extreme weather events 6.7 6.4
Total 81.5 71.2
by restoring yields within countries. Yet, it is impor-tant to note that larger population shares, and among them, the poorer of the poor, are highly vulnerable because of their dependence on agriculture.
Human health.8 Climate change can trigger increases
in the incidence of vector-born diseases, water-borne diseases, heat- and cold-related deaths, injuries and deaths from fl ooding, and the prevalence of malnu-trition. Th e EACC study, which focuses on malaria and diarrhea, fi nds adaptation costs falling in absolute terms over time to less than half the 2010 estimates of adaptation costs—thanks to improvements in basic health conditions that accompany higher incomes and development. While the declines are consistent across regions, the rates of decline in South Asia and East Asia and Pacifi c are faster than in Sub-Saharan Africa—a continent that will shoulder more than 80 percent of the health sector adaptation costs by 2050.
Extreme weather events.23 Without reliable data on emergency management costs, the EACC study tries to shed light on the role of socioeconomic development in increasing climate resilience. It asks: As climate change increases potential vulner-ability to extreme weather events, how many addi-tional young women would have to be educated to neutralize this increased vulnerability? And how much would it cost? Th e fi ndings show that by 2050, neutralizing the impact of extreme weather events requires educating an additional 18 million to 23 million young women at a cost of $12 billion to $15 billion a year. For 2000–50, the tab reaches about $300 billion in new outlays. Th is means that in the developing world, neutralizing the impact of worsening weather over the coming decades will require educating a large new cohort of young women at a cost that will steadily escalate to sev-eral billion dollars a year. But it will be enormously worthwhile on other margins to invest in education for millions of young women who might otherwise be denied its many benefi ts.
Putting Global Findings in Context
How does this study compare with earlier studies? Th e EACC estimates are in the upper end of estimates by the UNFCCC (2007), the study closest in approach to this study, though not as high as suggested by a recent critique of the UNFCCC study by Parry and others (2009). A comparison of the studies is limited by methodological diff erences—in particular, the use of a consistent set of climate models to link impacts to adaptation costs and an explicit separation of costs of development from those of adaptation in the EACC study. But the major diff erence between them is the nearly six-fold increase in the cost of coastal zone management and defense under the EACC study. Th is diff erence refl ects several improvements to the earlier UNFCCC estimates under the EACC study: better unit cost estimates, including maintenance costs, and the inclusion of costs of port upgrading and risks from both sea-level rise and storm surges.9 Th e bottom line: calculating the global cost of adap-tation remains a complex problem, requiring projec-tions of economic growth, structural change, climate change, human behavior, and government invest-ments 40 years in the future. Th e EACC study tried to establish a new benchmark for research of this nature, as it adopted a consistent approach across countries and sectors and over time. But in the process, it had to make important assumptions and simplifi cations, to some degree biasing the estimates.
Important shortcomings of this study relate to three broad categories: uncertainty, institutions, and mod-eling limitations (Table ES-3). Th ey are natural entry points for thinking about future work and knowledge needs. Th e highest priority in the immediate future must be to reduce the range of uncertainty about future climate impacts and to identify forms of adap-tation that are robust across the range of uncertainty that will remain.
The Country Picture
As for the EACC country studies, seven countries were selected based on overall vulnerability to major climate change impacts; diff ering environmental, social, and economic conditions and adequate data at the national level. Government interest at the highest level was also important. Mozambique, Ghana, and Ethiopia represent nearly the full range of agricultural systems in Africa. Vietnam and Bangladesh—Asian countries with most of their economic activity and population concentrated along the coast and in low-lying deltas—are among the world’s most vulnerable to climate change, especially from extreme weather events and fl ooding. Bolivia is a poor Latin American country traditionally dependent on the Andean gla-ciers to supply good portions of water demand, and it consists of a wide range of agro-ecosystems. Samoa represents a low-lying Pacifi c island at increased risk to sea level rise and storm surge.
Mozambique is subject to frequent droughts, fl oods,
and tropical cyclones—events that threaten the coun-try’s economic performance, which is already highly
aff ected by high rainfall variability. Th e most vulnera-ble sectors from climate change are agriculture, which employs over 70 percent of the Mozambique popu-lation; energy, particularly hydropower generation, which is dependent on water runoff ; transport infra-structure, notably roads; and coastal areas. Findings from the social component suggest that livelihood activities most sensitive to climate change continue to take place in areas most exposed to climate change. On adaptation, the EACC Mozambique country study shows that with small additional costs, sealing unpaved roads—a low-regret option—would restore about one-fi fth of the welfare loss owing to climate change (see Figure ES-3). Remaining welfare losses could be regained with better agricultural produc-tivity or human capital accumulation (education). Irrigation investments appear to be a poor alterna-tive. Investment costs are likely to be about US$400 million per year over 40 years. As part of the social component, participants in scenario development workshops were asked to draft preferred adaption options for the government (planned) and non-gov-ernment entities (autonomous) (see Table ES-4). For TABLE ES-3
GETTING A BETTER PICTURE
STUDY LIMITATION RECOMMENDATION
Use of mathematical models and no effi ciency criterion
Include institutional, social, cultural and political perspectives to identify good policies. Find simpler rules for policymaking
Climate uncertainty Consider more scenarios, Monte Carlo simulations and other probabilistic approaches
Growth uncertainty Hard to improve other than through sensitivity analyses
Technological uncertainty Incorporate better information from sector specialists and simulate the impact of potential advances.
Non-consideration to institu-tional issues
Context specifi c institutional capacity has to be assessed and considered to make recommendations realistic and feasible
Limited focus on migration and urbanization
Work with outside projections; limited current knowledge on cities and climate change
Limited range of adaptation Include a broader range of strategies, including more local level No environmental services Pull better information and introduce more consistent estimates
Note: In the worst scenario: NPV of damages without adaptation is
$7.6 billion discounted at 5%)
Source: World Bank 2010g.
ADAPTATION IN MOZAMBIQUE ENTAILS GREATER CLIMATE RESILIENCE
(Reduction in climate change damages, 2003-2050; 5 percent discount rate, constant 2003 US$)
FIGURE ES-3
TABLE ES-4
KEY ADAPTATION OPTIONS IN MOZAMBIQUE
Planned Adaptation Autonomous Adaptation
Hard ■ Flood control dikes and levies ■ Coastal fl ood control gates ■ Dams and irrigation channels ■ Improved roadways
■ Improved communication infrastructure ■ Improved hospitals and schools
■ More robust buildings
■ Farm-scale water storage facilities ■ Deep wells to provide drinking water for people and animals
■ Grain storage facilities
■ Improved food processing equipment Soft ■ Improved early warning of climatic hazards,
and of dam releases
■ Better planning and management of forest, fi sh, and other natural resources
■ Resettlement of populations to lower risk zones
■ More credit and fi nancial services for small busi-nesses and rural development
■ Better education and information for the rural areas
■ Improved health care, social services, and social support for all people
■ Better utilization of short season, drought resistant crops to prepare for drought, fl oods, and cyclones
■ Diversifi cation of fl ood and drought risk by maintaining fi elds in both highland and lowland areas ■ Better household and community management and use of natural resources, including wild fruits ■ Practice of soil conservation agriculture ■ Migration to lower risk areas
■ Diversifi cation of livelihoods away from agriculture
■ Better planning of how much grain to save for personal consumption, and how much to sell for income generation
Note: The options in plain text respond directly to climate hazards, while those in italics represent measures to increase the population’s
adaptive capacity, or make them more resilient to shocks to their livelihoods.
Source: World Bank 2010g.
the hard options, more resources will be needed, and for the soft options, an enabling economic and politi-cal environment.
Ethiopia is heavily dependent on rain-fed
agricul-ture, and its geographical location and topography in combination with low adaptive capacity entail a high vulnerability to the impacts of climate change. Historically the country has been prone to extreme weather variability, resulting in seven major droughts since the early 1980s—fi ve of which led to famines. Th e primary losses owing to climate change in Ethio-pia arise from the eff ect of extreme weather events, both droughts and fl ooding, on agricultural produc-tion and infrastructure.
Adaptation strategies considered in Ethiopia build on current government programs—such as increas-ing the irrigated cropland area and investincreas-ing in
Agriculture R&D
or Education Irrigation Sealing Unpaved Roads 8 7 6 5 4 3 2 1 0 1.5 Transport Infrastructure (3) Expanding Irrigation (4) 1.5 0.6 Agriculture R&D (5) 6.1 1.5 Primary Education (6) 6.1 1.5
agricultural research and development; boosting the share of paved and hardened roads; and altering the scale and timing of planned hydropower projects. Th e EACC Ethiopia country study shows that with-out adaptation Ethiopia’s GDP would be lower by 2 to 8 percent for the four diff erent climate scenarios analyzed. Adaptation reduces welfare losses by about 50 percent (see Figure ES-4) and also lowers income variability. It also highlights the potential benefi ts of accelerating the diversifi cation of the economy away
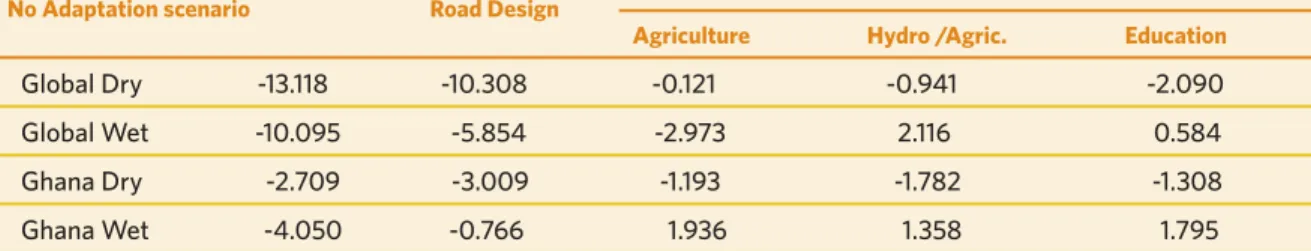
TABLE ES-5
BETTER ROAD DESIGN STANDARDS ARE A HIGH PRIORITY FOR GHANA
(NPV of deviations of real welfare from baseline under alternative adaptation strategies, US$ billions)
No Adaptation scenario Road Design
Adaptation Investment in
Agriculture Hydro /Agric. Education
Global Dry -13.118 -10.308 -0.121 -0.941 -2.090
Global Wet -10.095 -5.854 -2.973 2.116 0.584
Ghana Dry -2.709 -3.009 -1.193 -1.782 -1.308
Ghana Wet -4.050 -0.766 1.936 1.358 1.795
Note: The options in plain text respond directly to climate hazards, while those in italics represent measures to increase the population’s
adaptive capacity, or make them more resilient to shocks to their livelihoods.
Source: World Bank 2010f.
Note: NPV of absorption, difference from base (percent of NPV of
GDP). Absorption is defi ned as GDP, plus imports minus exports. Wet 1 and Dry 1 are the two secnarios used in the global analysis, and Wet 2 and Dry 2 are the wettest and driest scenarios in Ethiopia.
Source: World Bank 2010e.
ADAPTATION SIGNIFICANTLY LOWERS WELFARE LOSSES IN ETHIOPIA
(Net present value (NPV) of absorption diff erences) FIGURE ES-4 0.0 -2.0 -4.0 -6.0 -8.0 -10.0 Ratio (%) to NP V of Base GDP Adaptation No Adaptation Dry 2
Wet 2 Wet 1 Dry 1
from climate sensitive sectors, such as agriculture; upgrading road design; strengthening hydropower development; and accelerating absorption of the rural labor force into non-agriculture activities—including through skills-upgrading programs and encourage-ment of growth poles around medium-size munici-palities. Total adaptation costs range from US$1.22 billion (wet) to $5.84 billion (dry) per year over 40 years, though it may be possible to reduce these costs through a labor-upgrading program.
Ghana is highly vulnerable to climate change and
variability because it is heavily dependent on climate-sensitive sectors such as agriculture—largely rain-fed with a low-level of irrigation development—forestry, and hydropower. Th e country has a 565 kilometer long coastline that is inhabited by about a quarter of the population and is the location of signifi cant physical infrastructure. Th e EACC Ghana country study esti-mates that climate change causes a reduction in real household consumption of 5-10 percent in 2050, with rural households suff ering greater reductions, primar-ily through its impact on agricultural production. Th e study evaluated adaptation options focused on roads, agriculture, hydropower, and coastal protection. It found that changes in road design standards alone provide signifi cant reductions in welfare losses in most scenarios. Th e combination of better road design and investments in agriculture or agriculture and hydro-power or education would minimize or even reverse the losses caused by climate change under the four climate scenarios analyzed (see Table ES-5).
Bangladesh is one of the most vulnerable countries
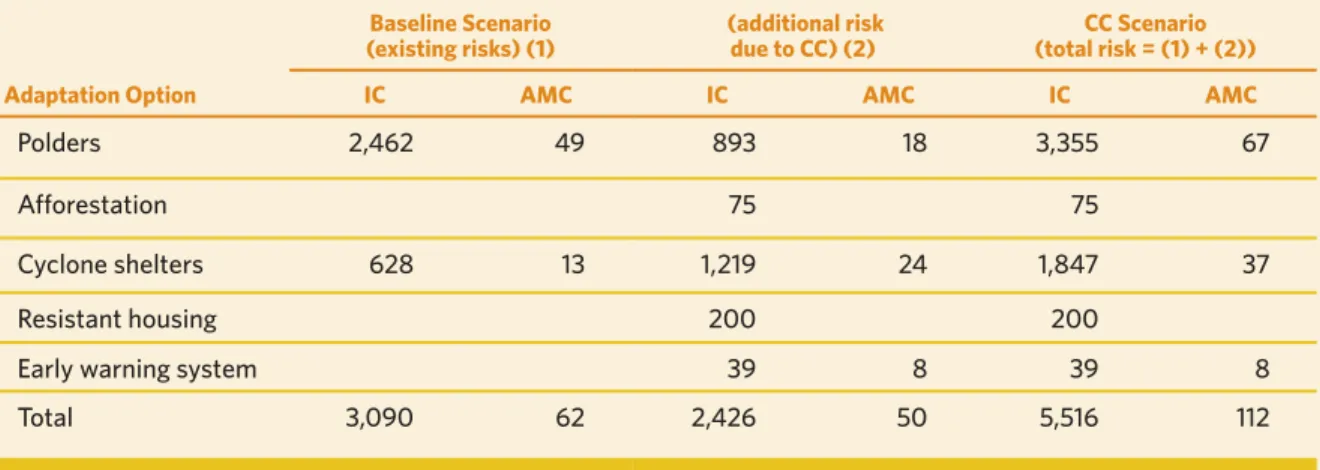
to climate risks. About two-thirds of the nation is less than 5 meters above sea level and is susceptible to river and rainwater fl ooding. Once every three to fi ve years, up to two-thirds of Bangladesh is inundated by fl oods. Cyclone-induced storm surges owing to climate change are expected to inundate an addi-tional 15 percent of the coastal area and increase the inundation depth in these areas. Th e damages from a single typical severe cyclone with a return period of 10 years is expected to rise nearly fi vefold to over $9 billion by 2050, accounting for 0.6 percent of GDP. Th e burden is likely to fall disproportionately on the rural poor in low-lying coastal areas who are also aff ected by other climate-related hazards such as saline water intrusion into aquifers and groundwater and land submergence.
For storm surges induced by tropical cyclones, the EACC Bangladesh country study evaluated adapta-tion measures such as embankments, aff orestaadapta-tion, cyclone shelters, and early warning systems. It found that the total estimated cost would be $2.4 billion in initial investment and $50 million in annual recur-rent costs (see Table ES-6). As for inland fl ooding, the focus was on infrastructure measures to avoid further damage from additional inundation—road network and railways, river embankments and
embankments to protect highly productive agricul-tural lands, drainage systems, and erosion control measures. Th e study found that the total estimated cost would be $2.7 billion in initial investment and $54 million in annual recurrent cost—with 80 percent of these costs stemming from road height enhancement. Given the large existing variability, a prudent near–term strategy for Bangladesh is to address the large adaptation defi cit while investing to reduce uncertainties about future climate change which will defi ne where additional investments are required. By 2050, the number of people living in cities will triple while the rural population will fall by 30 percent. Th e long-term challenge is to move people and economic activity into less climate-sensitive areas.
Bolivia is exposed to hydro-meteorological extremes
and climate variability, particularly because of the infl uence of the El Niño oscillation (ENSO), which, regardless of climate change, occurs periodically in diff erent parts of the country. Floods, landslides, and droughts—which seriously aff ect food security and the water supply—are also common. Given that Bolivia’s economic mainstays are minerals and gas, it is relatively insensitive to climate change. Yet most people are engaged in small-scale agriculture, a sec-tor that is quite vulnerable to climate changes.
TABLE ES-6
POLDERS AND CYCLONE SHELTERS ARE KEY FOR BANGLADESH’S CYCLONE-INDUCED STORM SURGES
(Total adaption cost for inland fl ooding by 2050, US$ Million)
Adaptation Option Baseline Scenario (existing risks) (1) (additional risk due to CC) (2) CC Scenario (total risk = (1) + (2))
IC AMC IC AMC IC AMC
Polders 2,462 49 893 18 3,355 67
Afforestation 75 75
Cyclone shelters 628 13 1,219 24 1,847 37
Resistant housing 200 200
Early warning system 39 8 39 8
Total 3,090 62 2,426 50 5,516 112
CC = climate change; IC = investment cost; AMC = annual maintenance cost
Th e EACC Bolivia country study focused on agricul-ture and water resources. Even in the more optimistic scenario of wetter conditions, agricultural productiv-ity can only increase if the capacproductiv-ity to store and use the needed additional water is available for farmers and poor peasants. Th us, “no-regrets” measures would include better water resources management and build-ing water storage and irrigation infrastructure. Th ese types of measure are already envisaged by Bolivia in its development agenda, but the study shows that the development agenda must now be accelerated.
Vietnam’s exposure to weather-related events and
disasters ranks among the highest among all developing countries. Storms and fl oods occasionally resulting from tropical cyclones have caused extensive and repeated damages to buildings and infrastructure, agriculture and fi sheries sectors, and resulted in a large number of fatali-ties. Climate change may well bring an increase in the frequency, intensity, and duration of fl oods, and greater drought problems in the dry season.
Th e EACC Vietnam country study focused on agriculture, aquaculture, forestry, and coastal ports.
In agriculture, adaptation measures ranged from autonomous actions by farmers (such as sowing dates, switching to drought-tolerant crops, and adoption of salinity-tolerant varieties of rice) to planned public actions (such as greater spending on research, devel-opment, and extension; and extending the areas of irrigated land).Th e study shows that the impacts of climate change on agriculture and related sectors, even with no adaptation, appear to be relatively modest— given that farmers are expected to change, without government interventions, the crops and crop vari-eties that they grow and their methods of farming. Th e CGE macroeconomic analysis suggests that the drop in real GDP and real consumption is much less severe with adaptation—and adaptation off sets most of the disproportionate impact of climate change on the poor (see Table ES-7). In fact, GDP would not only fall less but possibly also even increase. Th at said, a major concern is how much poorer households will suff er from lower agricultural incomes and higher food prices relative to the general cost of living.
Samoa is a country at extreme risk from a variety
of natural disasters including tropical cyclones and
TABLE ES-7
AGRICULTURAL ADAPTATION IN VIETNAM REDUCES INEQUALITIES AND HELPS GDP
(Percentage deviations in 2050 from baseline with no climate change)
No adaptation With adaptation Adaptation benefi ts
Dry Wet MoNRE Dry Wet MoNRE Dry Wet MoNRE
GDP -2.4% -2.3% -0.7% -1.1% -0.7% 0.7% 1.3% 1.6% 1.3%
Aggregate consumption -2.5% -2.5% -0.7% -1.4% -0.8% 0.6% 1.1% 1.7% 1.3%
Agricultural value-added -13.9% -13.5% -5.8% -3.8% -3.4% 5.4% 10.0% 10.1% 11.2%
Regional GDP
North Central Coast -6.6% -6.1% -2.6% 0.5% -0.3% 4.8% 7.1% 5.8% 7.4%
South East 1.1% 0.8% 1.0% 0.0% 1.1% 0.2% -1.1% 0.3% -0.9%
Rural household consumption
Bottom quintile -6.5% -6.3% -2.6% -1.9% -1.4% 2.4% 4.7% 4.9% 5.0%
Top quintile -1.6% -1.7% -0.4% -1.5% -1.0% 0.0% 0.1% 0.7% 0.4%
Note: MoNRE is Vietnam’s Ministry of Environment, which has established an “offi cial” climate change scenario that is roughly similar to the
Hadley Center (UK) projections.
tsunamis caused by earthquakes. It is also subject to inter-annual climate fl uctuations associated with El Nino (ENSO), which aff ect precipitations as well as air and sea temperatures. Many scientists believe that climate change will lead to some increase in the inten-sity of tropical cyclones accompanied by greater vari-ability of rainfall with more frequent episodes of heavy rainfall and drought. A major concern is that about 70 percent of the population lives in low-lying areas that would be vulnerable to inundation as a result of the combined eff ects of sea level rise, more severe storm surges, and fl ooding caused by heavier rainfall.
Th e EACC Samoa country study focuses on the implementation of design standards to ensure that buildings and other assets can cope with higher winds and more intense precipitation without dam-age. It found that the adoption of more stringent design standards today would reduce the impact of the climate change in future and the residual dam-age after adaptation (see Table ES-8). It also found
that extreme weather variability in the coastal zone will involve signifi cant costs for either investments in coastal protection or the relocation of assets. In the longer term, the relocation of assets—or even whole villages—may be the best option as it would shift economy activity such as tourism, crops, and other businesses away from the coast.
Lessons and Recommendations
Lesson 1: Th e cost of developing countries to adapt to climate change between 2010 and 2050 is estimated at US$70 billion to US$100 billion a year at 2005 prices. Th is amounts to about “only” 0.2 percent of the projected GDP of all developing countries in the current decade and at the same time to as much as 80 percent of total disbursement of ODA.
Th e averages across all developing countries hide a very uneven distribution of the burden of adaptation across regions as well as decades. Our estimates of the overall TABLE ES-8
BETTER DESIGN STANDARDS WOULD ENHANCE SAMOA’S RESILIENCE
(Impact of climate change with and without adaptation)
No adaptation With adaptation Benefi t of adaptation
NCAR CSIRO NCAR CSIRO NCAR CSIRO
Design standards for 10-year return period
Present value @ 5%, $ million 103.9 212.4 34.8 24.5 69.1 187.9
Annualized equivalent, $ million per year 5.9 12.1 2.0 1.4 3.9 10.7
Loss/benefi t as % of baseline GDP 0.6 1.3 0.2 0.2 0.4 1.2
Loss/benefi t as % of baseline consumption 0.9 1.9 0.3 0.2 0.6 1.7
Design standards for 50-year return period
Present value @ 5 %, $ million 19.9 37.0 4.5 5.4 15.4 31.6
Annualized equivalent, $ million per year 1.1 2.1 0.3 0.3 0.9 1.8
Loss/benefi t as % of baseline GDP 0.1 0.2 0.0 0.0 0.1 0.2
Loss/benefi t as % of baseline consumption 0.2 0.3 0.0 0.0 0.1 0.3
Note: NCAR is wettest scenario; CSIRO is driest scenario. Source: World Bank 2010h.
cost of adaptation are 0.6-0.7 percent of GDP for the Sub-Saharan Africa region in 2010-19 falling to about 0.5 percent of GDP in 2040-49. In contrast, the equivalent fi gures for the East Asia and Pacifi c region are 0.13-0.19 percent in 2010-19 and about 0.07 per-cent in 2040-49. Apart from Sub-Saharan Africa, the regions facing high relative costs of adaptation are the Latin America and Caribbean region and (under the dry climate scenario) the South Asia region. In addi-tion, the absolute costs of adaptation increase over time and will certainly continue to increase after 2050. Our projections suggest that real GDP will increase more rapidly than the costs of adaptation over the next four decades, even on quite conservative assumptions about growth in GDP per person. However, it would be unsafe to assume that this trend will continue into the second half of the current century.
Lesson 2: Economic development is a central element of adap-tation to climate change, but it should not be business as usual.
Economic development is the most basic and cost eff ective method of adaptation, provided that it is properly managed. It generates the resources and opportunities to adapt to climate change at a relatively low cost by ensuring that the design and location of new infrastructure, buildings, and other assets take account of the eff ects of climate change on their performance. Our country studies show that a failure to adapt to climate change may lead to very large weather-related losses—both in terms of the destruction of infrastruc-ture and foregone opportunities for fuinfrastruc-ture growth. In Ethiopia, robust growth based on infrastructure investment is the fi rst line of defense against climate change impacts. In Bolivia, development measures are not only robust to changes in climate impacts but also help reduce them by increasing local resilience.
Lesson 3: Invest in human capital, develop competent and fl exible institutions, focus on weather resilience and adaptive capacity, and tackle the root causes of poverty. Eliminating poverty is central to both development and adaptation, since poverty exacerbates vulnerability to weather variability as well as climate change.
Countries that reach the middle of the 21st century with large shares of their populations engaged in sub-sistence agriculture—with substantial illiteracy and lethargic or inept institutions—will be particularly vulnerable to the eff ects of climate change. Rapid development leads to a more fl exible and resilient society, so that building human and social capital— including education, social protection and health, and skills training—are crucial to adaptation.
In all of our country studies, the burden of existing climate variability is especially heavy in areas that have high concentrations of poor and socially vulnerable populations. Climate change exacerbates this pattern. In the Southern region of Bangladesh, for example, the rural poor are expected to face the largest declines in per capita consumption, declining productivity of the subsistence crops, and land losses owing to greater salinity brought forth by sea level rise.
Lesson 4: Do not rush into making long-lived investments in adaptation unless these are robust to a wide range of climate outcomes or until the range of uncertainty about future weather variability and climate has narrowed. Start with low-regret options.
For public policymakers, the fundamental prob-lem is one of uncertainty regarding both climate outcomes and longer–term projections of social and economic development (such as anticipated migration of people from rural areas to the cities). Th is uncertainty is particularly large for patterns of precipitation. Some country studies highlight cru-cial diff erences between alternative wet and dry sce-narios and their eff ects on agricultural production, water resources, and transport infrastructure. Other countries show large variation in the magnitude of increased precipitation. As a result, countries should try to delay adaptation decisions as much as possible and focus on low-regret actions—those actions that are robust under most climate scenarios. Th ese are typically policies or investments that can be iden-tifi ed as priorities for development even without climate change. For Africa, our studies show that