VIII. COMMUNICATIONS RESEARCH
A. MULTIPATH TRANSMISSION
Prof. L.B.Arguimbau J.Granlund
E.H.Gibbons, Jr. W.L.Hatton
1. Speech and Music
In the last quarterly period, most of the effort has been directed toward the electrical and mechanical design of a bandpass filter for the field-test receiver. The filter must be extremely flat in its pass band (150 kc centered at 4 Mc) and yet offer reasonable rejection of unwanted signals.
A threshold of 95 per cent has been agreed upon. That is, the receiver will give an essentially undistorted output when receiving two signals, provided the strength of the weaker signal is less than 95 per cent of the strength of the stronger signal. The output is then essentially the modulation of the stronger signal. As mentioned in the previous reports, the bandwidth after limiting should be quite large (ideally, infinite), and is determined by the desired threshold as follows:
Threshold 95% 96% 97%
Bandwidth 5.85 Mc 7.35 Me 9.85 Mc assuming + 75 kc deviation.
Any fractional deviation from flatness subtracts directly from the threshold. For a given threshold, the bandwidth following limiting must be increased as though the desired threshold were increasedby this
devia-tion from flatness.
In view of the rather serious requirements of bandwidth, a Butterworth characteristic with 1 per cent deviation from flatness was chosen for the filter. Its transfer impedance is
= 1
12 1 + F2n
where F is the fraction of half-bandwidth off center frequency (as usual, the bandwidth is measured between the half-power points of the filter). A reasonable configuration for a bandpass filter with n even is difficult to make. With n = 5, 1z1 21 is constant to within 1 per cent for IFI< 0.67,
(VIII. C~,fUNICATIONS RESEARCH)
while the attenuation with IFI = 2 x 0.67 is 13 db. With n = 7, Z121 is
constant to within 1 per cent for IFf<0.75, while the attenuation with SFj = Z x 0.75 is 25 db. Therefore, n = 7 seemed to be a reasonable compromise between inadequate filtering and complicated construction and alignment.
The Darlington procedure was used to synthesize a low-pass prototype. This was transformed into a band-pass structure which could be realized as a series of seven coupled tank circuits. All self-inductances are equal, and the tanks are alternately inductively and capacitively coupled.
2. Television
The principal effect of multipath transmission on television is the formation of ghosts and multiple images caused by reflections off buildings and other objects in the path of the transmitter. This project will set up a simple two-path system for the study of ghosts under both AM and FM
conditions.
In the AM system, as presently constituted, one path between trans-mitter and receiver consists of 1850 feet of coaxial cable which gives about 2 ILsec delay with respect to the other path, a variable attenuator.
After this two-path system was set up, it was found that the AM trans-mitter did not deliver sufficient power to overcome the attenuation of the cable. In addition, there was difficulty in maintaining the balance in the push-pull stage operating at 200 Mc. Consequently, a new AM transmitter, completely push-pull and tripling the frequency three times from a 7.407-Mc crystal, has been constructed. Grid modulation of the final stage is
being used, this being more conventional than plate modulation in television practice.
The AM transmitter and the associated modulator is now being adjusted. W.L.Hatton-B. MICROWAVE MODULATION TECHNIQUES
L.D.Smullin J.Jensen W.E.Vivian 1. Double-Tuned Oscillators
During the past few months an S-band oscillator circuit has been assembled, using a reflex klystron. A secondary cavity is line-coupled to the gap cavity to give a resonant structure having two degrees of freedom.
(VIII. COMMUITICATIONS RESEARCH)
Adjustable, measurable parameters such as the line length, cavity tuning and coupling provide a means for varying the passive admittance function of the resonant structure. The electronic admittance can be modulated through the reflector or beam grids. This circuit is the microwave
companion to the low-frequency transitron oscillator previously constructed, and is a good device for studying susceptance modulation.
Experiments show that phenomena such as sideband locking, sudden mode-shifting, and carrier-frequency instability occur when the modulating
frequency approaches the difference of frequency of the two normal modes. Measurements are now being made on this circuit.
Two approaches to the mathematical formulation have become evident. Both are based on the representation of the linear passive admittance (Y) of the resonant circuit as a function of (X = a + Jw), the complex fre-quency, and the representation of the electronic admittance (Ye) as a function of the amplitudes of several coexistant sinusoidal driving voltages.
By continuously matching passive and active admittances (Y = - Ye) at each voltage, and by using a step-by-step integration process to find the voltage variation (V = Veat) as a function of time in the modulation cycle,
the modulation process can be followed, and the spectrum computed. (a must be small compared to w.)
In the second approach, a linear-circuit distribution of voltages (carrier and sidebands) can be computed as a first approximation, and the effect of the nonlinear element accounted for by a perturbation based on the variation of admittance at one frequency caused by energy at another frequency. For example, in a reflex klystron this interaction appears,
(1)
under common conditions, as:Sy 2J(X 1) W1 2 e,l Y Jo(X ) X1 e, o 2 X1 X1 = kV 1 X = kV2 2 e Y J(Xl 2 1 (X) 2 e.2 0 1 X 2
At the present time an effort is being made to apply these two methods of attack to an explanation of the behavior observed in the breadboard units, and to check on the validity of the method. Since
1. W.H.Huggins, "Multifrequency Bunching in Reflex Klystrons", Proc I.R.E., May 1948.
(VIII. COMMUNICATIONS RESEARCH)
complicated (Y) and (Ye) functions occur, graphical (Y-plane) plotting and mechanical integration appear useful.
Experimental techniques are being used to find the admittance-voltage relations of some sample nonlinear elements (tubes) when excited by several
voltages. W.E.Vivian
2. Investigation of Freauency Modulation of a Reflex Klystron
A detailed series of measurements is being made to determine the kind and amount of distortion arising from the frequency modulation of a reflex klystron. Some of the sources of distortion are the asymmetry of the
reflector mode, hysteresis, and poor centering of the center frequency on the reflector mode.
Preliminary measurements are being made on the 2K28 and 707B klystrons. Figure VIII-1 shows the result of some measurements on sideband amplitude versus frequency of modulation for a given reflector swing. The modulating voltage on the reflector was maintained at 3 volts rms, which gave a peak
FREQUENCY IN MC/SEC m 13 z r" w it n" ," <I oX 0 z W a o0 -n I. 0 0 re
Fig. VIII-1. Ratio of carrier to lower sideband 2K28 klystron, modulated with 3 volts rms (± 6 Mc/sec peak deviation5.
deviation of + 6 Me/sec on the basis of a 60 c/sec calibration. The computed curve was obtained from the usual expansion of a frequency-modulated wave. The upper-sideband curve was essentially parallel to the one plotted, but about 2 db lower.
(VIII. COMMUNICATIONS RESEARCH)
3. Magnetron Reactance Tube
This work has been completed and a Report is in progress.
C. STATISTICAL THEORY OF COMMUNICATION
Prof. R.M.Fano N.H.Knudtzon
Prof. Y.W.Lee E.R.Kretzmer
Prof. J.B.Wiesner A.J.Lephakis
T.P.Cheatham,Jr. L.Levine
W.B.Davenport,Jr. H.E.Singleton
E.E.David,Jr. C.A.Stutt
L.Dolansky
1. Autocorrelation Function
a. Autocorrelation Functions of Random Noise
The electronic c.orrelator has been modified since the last quarterly report to increase its range and accuracy of operation for random time functions. A description of these changes will be included in a report on the general operation of the correlator.
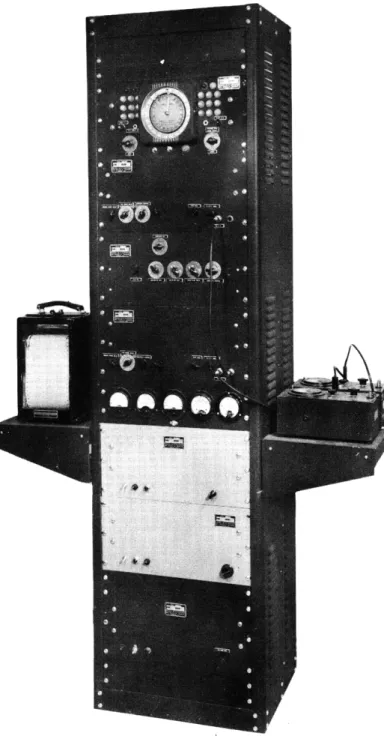
The noise distribution analyzer, described in the last progress report, has been completed with some equipment added to facilitate the taking of data. Figures VIII-2 and VIII-3 are photographs of the correlator and analyzer showing their general structure and the arrangment of parts.
During the past few weeks the two machines have been operated together in order to obtain autocorrelation functions of the noise source under study by the analyzer.
The purpose of these experiments has been mainly to acquire qualitative information on the flexibility and the limitations of the correlator and to obtain a qualitative estimate of the character of the noise source.
Some examples of the results of these experiments are given in
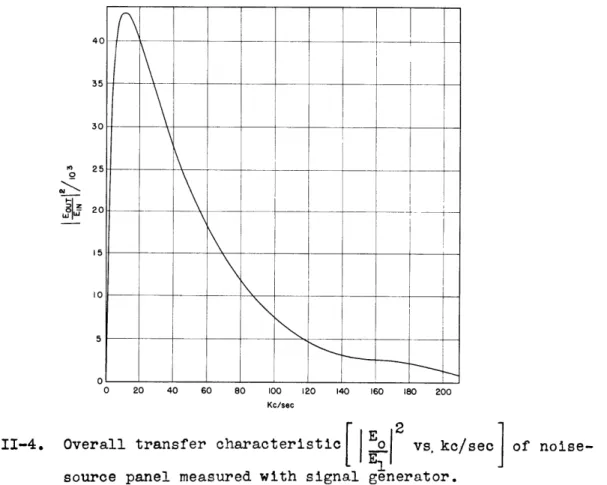
Figures VIII-5, VIII-6 and VIII-7. Figure VIII-4 is the overall transfer characteristic of the noise-source panel between the noise tube and the input to the slicer stage of the analyzer. Figure VIII-5 shows the auto-correlation function of the noise through this transfer characteristic. It should be noted that the large perturbation centered at - = 13
n
(-6 ILsec) corresponds in the power density spectrum to the energy mode just visible at =170 kc on Figure VIII-4. Figure VIII-6 is the auto-correlation function of the same noise source after insertion of a single tuned circuit centered at 20 kc (Q = 14) in the noise-source panel. The correlation curve checks reasonably well with theoretically derived
results, with the exception of an apparent crowding of the oscillations as Tn approaches zero. This may be explained in part (or completely) by
(VIII. COMMUNICATIONS RESEARCH)
Fig. VIII-2. Electronic correlator.
The chasses in the 8-foot rack are (from top to bottom):(l)level selector, (2) channel "A" boxcar generator,(3):ulti-plier, pulse-width generator, integrator, (channel "B" boxcar generator,(5) power supplies. Graphic recorder is on left shelf and input time function generator may be placed on right shelf.
Fig. VIII-?. Neise distribution analyser
The chasses in the 3-font, rack are(from top to bottom): noise source and ampiifier, slicer, level selector, timer,binary counter, power supplies.
(VIII. COMMUNICATIONS RESEARCH)
non-linearity in the sawtooth generators of the correlator. This possible defect is being checked and corrected. To illustrate the flexibility of the correlator and its limits of accuracy, Figure VIII-7 shows the first portion of Figure VIII-6 expanded and recorded using approximately ten times as many points per region of the curve.
As additional types of noise sources are added to the general
statistical studies being made with the analyzer, corresponding correla-tion curves will be measured. It is expected that as techniques of measure-ment improve, the data so recorded will become more and more quantitative in nature and the development of electronic computing devices as a principal effort will give way to their use as tools in the solution of basic communi-cation problems.
There has been greatly increased interest in the possible application of both the correlator and the distribution analyzer in the fields of chemistry, physiology, aeronautics and servomechanisms, in addition to the specific problems of communications for which these machines were developed.
Prof. J.B.Wiesner, Prof. Y.W.Lee, T.P.Cheatham, Jr., N.H.Knudtzon
0o
~z
0 20 40 60 80 100 120 140 160 180 200
Kc/sec
Fig. VIII-4. Overall transfer characteristic Eo vs kc/sec of noise-source panel measured with signal generator.
-- LIIIC1----
*---~-_-_-_-70
60
20
4 8 12 16 20 24 28 32 36 40 44 48 Tn
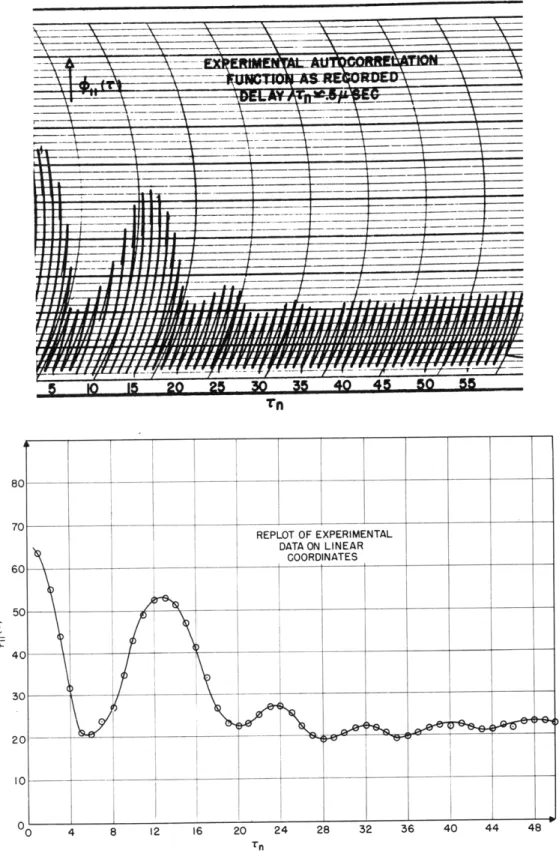
Fig. VIII-5. Autocorrelation function of noise from 884 gas tube after passing through transfer characteristic of Fig. VIII-4.
REPLOT OF EXPERIMENTAL DATA ON LINEAR COORDINATES I r
iair
i 1 _L"
-t- FB~B~ F' ~sge~(VIII. O0111UNICATIONS RESEARCH)
TiF F'TFRI INF.ANiIIS r-C INJ" ( in a I 1 P r UA"T l A"t? Y
z8 14 REPLOT OF EXPERIMENTAL DATA ON LINEAR 2 COORDINATES 10 8
6
\ T
2 15 20 5 30 35 5 50 55 60 65 7 75 -2 -4 -6 -101~~
1
1 11I
TnFig. VIII-6. Autocorrelation function of noise from 884 gas tube after passing through single tuned circuit (Q-14).
T r FTaI N ANr I C f*r I 0 5 10 15 20 25 30 35 40 45 50 55 T n Fig. VIII-7. passing portion
Autocorrelation function of noise from 884 gas tube after through single tuned circuit (Q=14) showing in detail first of curve of Fig. VIII-6.
10 REPLOT OF EXPERIMENTAL DATA ON LINEAR r'.nnnlINATEQ
K
K
A/
I IF-i
i
i
3
1111
c~LLer(
VVVI\YII ~I LCI(VIII. COMMUNICATIONS RESEARCH)
b. Digital Electronic Correlator
A second electronic correl±tor is being designed to provide further facilities for the study of correlation functions and their application to the statistical tneory of communication. The machine is intended to accept inout signals containing a wide band of frequencies (d-c to 10 megacycles) and to evaluate q,(T) arguments from 0 to 100 milliseconds. The value of T is to be controlled to an accuracy of about 0.01 jLsec. The need or
controlling -r to great accuracy has been demonstrated, particularly for (1)
values of T near zero . In order to obtain a high degree of stability and accuracy, the storage and computation are to be carried out digitally. The binary scale is to be used and, to provide an accuracy of one part in 1000, ten digits are necessary.
The upper limit of 100 milliseconds on 7 means that correlations in the input signals resulting from frequency components down to about 10 cps will be evaluated directly. Direct evaluation of c for larger values of T would require prohibitive amounts of time. Assuming 104 multiplications per value of T, about 20 minutes is required to evaluate q for -r = 100 milliseconds. For very slowly varying signals (having frequency com-ponnets less than about 10 cps) the circuits in the correlator can be used to record the signal in digital form on magnetic tape. The recorded signal can then be played back into the computing circuits of the machine at a higher speed, or spaced pickup heads can be used to obtain large values of -.
Overall planning of the machine and preliminary design work on its components are almost completed. Experimental models of important units have been built and tested.
A functional block diagram of the samoling, coding and storage circuits is shown in Figure VIII-8. The multiplication and summation circuits are not shown. The functional diagram may be followed with the aid of the waveforms shown in Figure VIII-9. Sampling pulses derived
from the timing circuits are applied to boxcar generators No. 1 and ~o.2, and to circuits for deriving channel-switching pulses. The leading edges of the channel-switching pulses are used to inititate a linear sawtooth and, through a flip-flop, to open a gate which allows pulses from a pulse generator to pass to a binary counter.
1. R.Cohen, RLE Technical Report o. 69, "Some Analytical and Practical Aspects of Wiener's Theory of Prediction".
-~--~-~--~-X~L1-Y----~-INPUT
* I
VIII-8. Sampling, coding and storage circuits of the digital electronic correlator.
I
I
I
I
,
I
I
I
I
I
I
I
I
I I
I
I
i
I
f
-
I
I
n
(VIII. COMMUNICATIONS RESEARCH)
The amplitude-modulated pulses produced in the boxcar circuits are successively channeled, under control of the channel-switching pulses, to a precision comparison circuit. Here the amplitude-modulated pulses are compared to the linear sawtooth, and the resultant time-modulated pulses are used to close the gate and prevent pulses from passing to the binary counter. The binary counter comprises a cascade of flip-flops and, because these are all initially in the same state, their condition after the gate is closed is a binary representation of the input amplitude-modulated pulse. The binary digits thus obtained for each channel are stored in separate storage circuits.
Prof. Y.W.Lee, H.E.Singleton, T.P.Cheatham,Jr. 2. Probability Distributions
a. Amplitude and Conditional Probability Distributions of a Quantized Time Function
The conditional probability analyzer discussed in the October
Progress Report has been constructed and is under test. As soon as tests are completed, the amplitude distribution and conditional probability analyzers will be used to obtain data on the human voice. It is proposed to take data both on "live" and recorded voices.
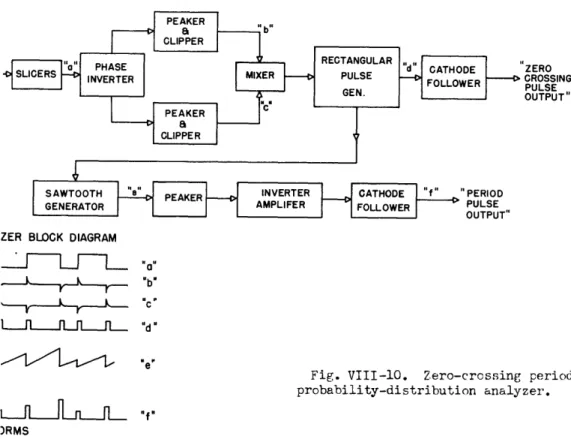
Apparatus extending these analyzers to enable the determination of the period-probability distributions of the zero-crossing periods of the voice is being designed. A block diagram of the system is shown in Figure VIII-10, as are also representative waveforms.
The method of operation of the system is as follows: The audio input wave is sliced until a rectangular waveform, of variable period is obtained (waveform "a"). Provision for supersonic bias, about 20 kcps, is included to reduce the effects of noise in the "quiet" periods of a
spoken message. Through a combination of phase-inversion, peaking,
clipping and mixing, a rectangular pulse chain (waveform "d") is obtained which contains a fixed-duration, fixed-amplitude pulse for every zero-crossing of' the inout speech wave. These pulses are then applied to a sawtooth generator. The amplitudes of the resultant sawtooth waveforms are then dependent upon the zero-crossing periods. Peaking then corrects this sawtooth chain into a succession of pulses whose amplitudes are proportional to the zero-crossing periods. These variable-amplitude pulses may then be applied to the level selector discussed in the July Progress Report. The output pulses of the level selector are then
counted as are the zero-crossing pulses (waveform "d"). Their ratio, if
(VIII. COMMUNICATIONS RESEARCH)
ZERO
CROSSING PULSE OUTPUT"
ZER BLOCK DIAGRAM
,, "b".
IA---
-
eFig. VIII-10. Zero-crossing period probability-distribution analyzer.
)RMS
over a sufficiently long period of time, may then be taken as lity of occurence of the zero-crossing period corresponding to ie of the pulse applied to the level selector.
W.B.Davenport,Jr. Optimum Prediction
ener's statistical theory of the design of linear transmission he aspect of prediction appears to be the easiest to verify lly. One of the requirements in a demonstration of prediction uction of a stationary random function which has at least one derivative. Narrow-band noise is a likely function of this may be readily produced by means of a gas-tube noise source in
with a tuned circuit (bandpass filter). After passing this gh a prediction circuit, the predicted noise may be compared t to the predictor by recording these functions simultaneously.
(VIII. COMMUNICATIONS RESEARCH)
or if the frequency components are low enough a two-pen recording voltmeter
should suffice. Prof. Y.W.Lee, C.A.Stutt
4. Theory of the Transmission of Information
The manuscript of Technical Report No. 65, "On the Transmission of Information", has been completed. This report presents a theoretical study of the transmission of information in the case of discrete messages and noiseless systems. The study begins with the definition of a unit of information (a selection between two choices equally likely to be selected), and this is then used to determine the amount of information conveyed by the selection of one of an arbitrary number of choices equally likely to be selected. Next, the average amount of information per selection is computed in the case of messages consisting of sequences of independent selections from an arbitrary number of choices with arbitrary probabilities of their being selected. A recoding procedure is also presented for
improving the efficiency of transmission by reducing, on the average, the number of selections (digits or pulses) required to transmit a message of given length and given statistical character. The results obtained in the case of sequences of independent selections are extended later to the general case of non-independent selections. Finally, the optimum condi-tion is determined for the transmission of informacondi-tion by means of
quantized pulses when the average power is fixed.
Most of the work presented in this Technical Report leads to results already published by Wiener and Shannon. However, the approach used by the author is perhaps sufficiently different to justify the rederivation of results already available in the literature. On the other hand,
additional work on the transmission of continuous signals in the presence of noise is not included in this Report because it was not believed to differ sufficiently from the corresponding work of Wiener and Shannon.
Prof. R.M.Fano 5. Pulse Modulation Studies
The study of two-station and two-path interference between pulse-duration-or pulse-position-modulated transmission has been completed. An
extensive report, "Interference Characteristics of Pulse-Time Modulation", is now being prepared. Prof. J.B.Wiesner, E.R.Kretzmer
6. Storage of Pulse-Coded Information
A circuit has been devised which is sufficiently flexible to meet a wide range of requirements. The pertinent parts of the circuit are shown
(VIII. COMMUNICATIONS
in Figure VIIISL The two cathode-ray storage tubes which are provided permit a continuous flow of information through the system. Thirty-two distinct vertical-deflection voltages are provided for each tube by a binary-weighted voltage-divider type of circuit; this circuit is
described in M.I.T.Servomechanisms Laboratory Report R-120. A linear-sweep generator provides horizontal deflection at two speeds; it is possible, however, that circuits similar to the vertical-deflection
circuits may be used, instead of the linear sweeps, for horizontal deflection.
The time required to fill a storage tube to capacity is larger than the time required to empty a tube. The circuit is so arranged that, at any given time, writing can take place in only one of the two storage tubes. When a tube, say tube 1, is filled to capacity, a pulse from point a of its vertical deflection circuit will cause flip-flop FF-J1 to be reset; this operation causes the grid of the storage tube to be blanked,
its horizontal sweep to return to the starting position and remain there, and FF-Il to change state. The positive signal from the latter flip-flop causes FF-H to be set; FF-H switches the signal circuits, deflection syn-chronizing circuits, sweep speeds and output circuits of the two storage tubes. After a time interval corresponding to DE-E1, the positive signal from FF-Il initiates the reading operation in tube 1 (FF-J1 will be set) and the writing operation in tube 2; DE-E1 is necessary to enable FF-H and the circuits it operates to become quiescent before writing or reading commences. Tube 1 will be emptied before tube 2 is filled. When tube 1 is empty, a pulse from point a of its vertical-deflection circuit resets FF-J1; the functions enumerated above will be performed by FF-Jl. FF-Il will stop the reading operation in tube 1, but it will not affect FF-H or FF-J2
because of the presence of crystal diodes at appropriate places. Tube 1 will be empty and will be ready to receive signal pulses. When tube 2 is
filled to capacity, a switching operation similar to the one first
described will cause tube 1 to start writing and tube 2 to start reading. The design of the circuit will be started after certain character-istics of the storage tubes have been obtained from the Servomechanisms Laboratory. It is possible that the use of a linear sweep for horizontal deflection may impose limitations on the attainable reading and writing times of the tubes, or may cause unwanted secondary-emission phenomena which will destroy the stored signal. The tubes are provided with holding guns; if a linear sweep is used for horizontal deflection, the holding guns
may have to be on constantly in order to prevent erasure of the stored signal. If this is the case, the intensity of the main electron beam and the sweep speed will have to be such as to override the holding-gun
action; an additional limitation will be imposed on the reading and writing timesof the tubes. Because of these conditions, it may be preferable to use a step type of circuit, instead of a linear sweep, for horizontal deflection. The only advantage of a linear-sweep circuit is that it
requires a considerably smaller number of tubes than the step type of
circuit. Prof. J.B.Wiesner, A.J.Lephakis
7. "Felix" (Sensory Replacement)
It is well known that each of the ordinary sounds associated with speech has a characteristic frequency pattern which patterns are related to articulation in hearing. It is believed that sensory replacement of the hearing mechanism in humans, therefore, may be accomplished, provided some other sense can be used to differentiate the speech patterns. A device has been designed which can transmit through the cutaneous sense
the necessary information for articulation.
The apparatus, as now built, consists of (a) a filter, which
separates speech into five frequency channels; (b) a vacuum-tube bridge circuit, which produces for each channel a constant-frequency output, the magnitude of which is proportional to the instantaneous signal level in
that channel, and (c) an amplifier and vibrator which applies the output of the bridge circuit to five different positions on the skin. By this means the frequency-pattern information is transmitted to the skin as
amplitude-position variations.
The necessary equipment has been assembled, and a working model is being tested. It is not felt that experiments have progressed to the
stage where any important conclusions can be drawn. Prof. N.Wiener, Prof. J.B.Wiesner, E.E.David,Jr., L.Levine 8. Low-Frequency Output Spectrum of Lock-In Amplifier
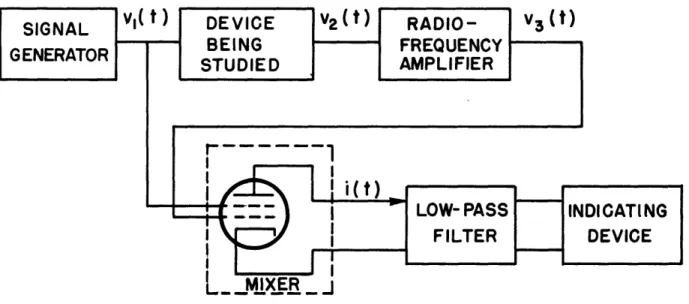
The ability to measure the strength of weak carrier signals in the presence of narrow-band noise is considerably increased through the use of a zero-frequency heterodyning device called a lock-in amplifier. In block form the measurement apparatus might be arranged as in Figure VIII-12.
A signal v1(t) = a cos w0t is supplied from a signal generator to a
device whose frequency behavior is being studied. This device is assumed to have a high insertion loss so that its output, v2(t) = b cos (w0t +IV) must be amplified to a measurable level by means of the indicated
(VIII. COMM NICATIONS RESEARCH)
Fig. VIII-12. Measurement set-up employing lock-in amplifier.
radio-frequency amplifier. The output of this amplifier may contain considerable random noise because of noise sources within the amplifier, and may be expressed as
v3(t) = cos(o t + 9) + Vn (t)
where v n(t) is the noise voltage. The separation of the carrier from the noise may be facilitated by mixing v3 with the signal-generator output v1. The mixer is indicated as a pentode in Figure VIII-12; if the circuit is properly designed and Iv 4<v i the mixer output will be proportional to v
3. In particular, the direct current increment in mixer plate current will be proportional to the amplitude of the carrier component of v2 . Much of the superposed noise can be eliminated by means of a lowpass filter.
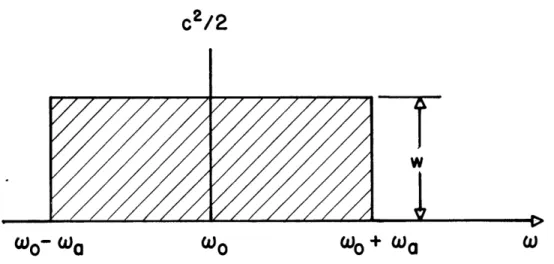
In the analysis, the r-f amplifier response has been idealized to the case of uniform response in a bandwidth of angular frequency 2wa centered at the carrier angular frequency w o . The spectral distribution of v3 then appears as in Figure VIII-13. The incremental current in the mixer plate circuit is given by
i(t) = gv 3(t), I PLI- 11II_~ ----~-I(_~I-. __ -~1. -1~-11111 ---..--_-.1.^ __l ~IP - .-L~-I.-I_^.---LIL- __-_IPLIIIYII- LLI
c
2/2
WO
w0
W
Wo+
Wa
Fig. VIII-13. Idealized spectral distribution of r-f amplifier output. where gm is a function of v (t), and may be expressed as a power series in
v 1(t). Because of the linear relation between i and v3, the components of v3 do not mix with each other, hence the uniform character of the input spectrum is preserved in the output. The low-frequency portion of the spectrum of i(t) is indicated in Figure VIII-14. The "carrier"-to-noise ratio may be computed from the spectrum line associated with the d-c component and the integrated continuous spectrum from w = 0 to w = w2.
For the case in which gm varies linearly with v1(t), the ratio of the carrier-to-noise ratio for the low-frequency output to the carrier-to-noise ratio of v3 is given by
(c/N)out
(c/N)out= 2 cos2e
where 9 is the phase angle between the carrier component of v3(t) and v (t).3 1
kc
2cos
29
2kw
0
Wa
W
(VIII. COMMUNICATIONS RESEARCH)
This result predicts a possible 3 db improvement in carrier-to-noise ratio for proper phasing at one extreme, and complete deterioration at the other extreme. It should be remembered that this result applies before noise energy is reduced by filtering.
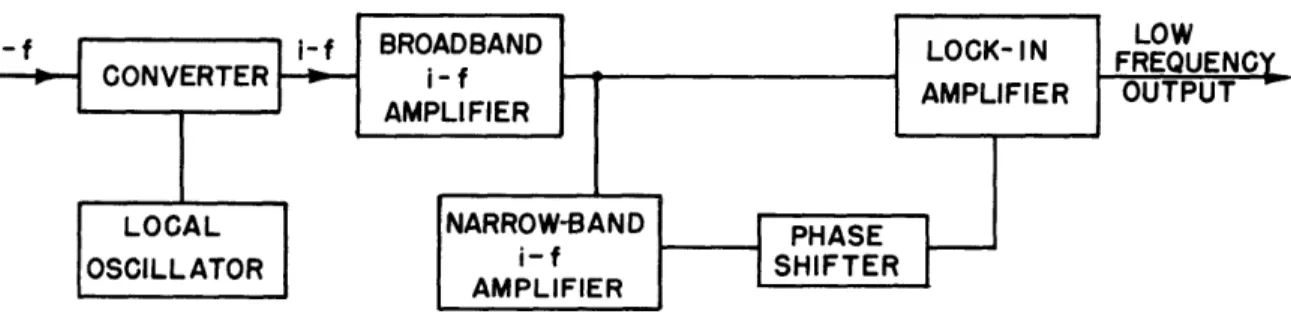
If the original carrier v (t) is sine-wave amplitude-modulated, it is found that the potential gain in "signal"-to-noise ratio of 3 db is retained. In this case the "signal" is the modulation frequency, not the carrier. This result suggests that it may be possible to achieve a small gain in signal-to-noise ratio in an amplitude-modulation receiver if a lock-in amplifier is used as a second detector. Though no strong carrier
source is present in a receiver, such a source night be approximated by using an auxiliary narrow-band intermediate-frequency amplifier. A
con-ceivable system of this type is shown in Figure VIII-15.
Prof. J.B.Wiesner, C.A.Stutt
Fig. VIII-15. Lock-in amplifier used as a second detector.
9. Pulse Code Magnetic Recorder
A pulse code magnetic recorder is being designed for use in conjunction with the digital auto-correlator. It has been decided to limit the machine
to an upper frequency of 10 kilocycles and to use 7 binary digits wrhich will establish a simple noise ratio of about 40 db. At the present time decoding circuits on the paper tape drive are being designed.
Prof. J.B.Wiesner, L.Dolansky
I~---(VIII. CO1MUNICATIONS RESEARCH)
D. TRASIENT PROBLEMS
Dr. M.V.Cerrillo
1. Envelope Studies
This project has been completed and its results will appear in full detail in Technical Report No. 55, the manuscript of which is already finished.
2. Transient Theories
The results of this investigation will be given with complete details in the Technical Report No. 55.
3. Theory of Synthesis of Networks for Specific Transient Response
The basic theory of network synthesis for prescribed transient response and transmission of a given signal, together with some new ideas about
filtering, is considered in this investigation on a completely new basis derived from the results of the general transient theories, given above in Section 2.
The fundamental ideas and concepts of this new approach cannot be simply presented without the understanding of some basic results which are given in the first part of Technical Report No. 55. These ideas will,
therefore, be omitted in this Progress Report. The reader will find
complete information and a detailed mathematical discussion on this subject in the second part of the above-mentioned Technical Report. The material presented in this second part covers only the fundamental and basic aspect
of the problem. Subsequent results will be given in future Progress Reports.
E. ACTIVE NETWORKS
Prof. E.A.Guillemin Dr. M.V.Cerrillo J.G.Linvill
1. General Theory
Since all effort has been concentrated on the preparation of the RLE Technical Report No. 55 and on work concerned with Section D-3, no progress
(VIII. COMMUNICATIONS RESEARCH)
2. Broadband Amplifiers with Active Interstages
The problems involved in designing a broadband amplifier with an active interstage of the form suggested in the progress reports of April and July, 1948, have been considered during this quarter. In Figure VIII-16 is shownm the equivalent circuit of an amplifier with an active interstage. Y includes a parasitic capacitance C, and Zil Zi2P - - Zin each include parasitic capacitances Ci. The basic idea of the method proposed in the
I t I
1
Fig. VIII-16. Equivalent circuit of an amplifier with active interstage;
I 1 a +
E Z = E E a p
progress reports of April and July can be summarized as follows: (a) It is the positive real character of passive impedances, coupled with the para-sitic capacitance, which restricts the level of magnitude which passive impedances can exhibit over prescribed frequency ranges. This positive real character accordingly restricts the level of amplification of anmpli-fiers with passive interstage impedance. (b) Active interstage impedances, not being restricted to positive real character, are not correspondingly limited by their parasitic capacitance; and amplifiers using such inter-stages should not have the same gain-bandwidth limitation.
The first design problem treated this quarter is the specification of an appropriate interstage impedance Z(I, Fig. VIII-16). Z must (a) be the ratio of Hurwitz polynomials, (b) behave at infinite frequency as the impedance of a capacitance in parallel with a positive conductance, and (c) possess a larger approximately constant magnitude up to w0 rad/sec (the cut-off frequency) than is possible with a passive impedance with the
(VIII. COIMMUNICATIONS RESEARCH)
associated capacitance. The second design problem treated is that of splitting the specified1 = Y into Y + Y (Figure VIII-16) where Y is a positive real function and Ya is indentifiable as Ia/E (Figure VIII-16) for a chain of amplifiers.
a. Specification of Appropriate Z
The function Z, being the ratio of Hurwitz polynomials, can be conveniently expressed in factored form
S- zl)( - Xz2) ( - zm
Si ( - p2 Xpm+1
where
(1)
zi zi + jWzi
are the zeros of Z and
pi pi + Jwpi
are the poles. Specifying the pole and zero positions (Figure VIII-17) is evidently equivalent to specifying Z. Further, the restrictions mentioned
on Z are easily translated into restrictions on the pole and zero positions.
x IMAGINARY +W x- INDICATES POLE S OF Z o-INDICATES ZERO OF Z REAL - (o
Fig. VIII-17. Examples of pole and zero configuration satisfying requirements on Z.
(VIII. COMMUJNICATIONS RESEARCH)
The method used for selecting Z is a method of successive approxima-tions, each successive approximation yielding a more satisfactory set of pole and zero positions. The magnitude of Z as a function of frequency is its characteristic of primary interest. The relationship between magnitude and individual pole and zero positions is most conveniently expressed by
m m+ 1
n IZI= IlnX - X - i Inl -n pil- In C (2)
i=1 i=l
To lead to the first approximation it is expedient to consider plots of lnAX -
X
1l vs.=Jw for real A1 or lnJ( A-l -1)
ifor complex Ai. Plots of these functions have been made for normalized values of A1(functions with the same dl/ 1 have the same form). By considering the normalized plots and the desired form of the sum (2), one can make a
reasonable guess at suitable values of zl' Az2 - - zm -- and Apm+l. By roughly computing lnZl for a trial selection of pole and zero positions, one can observe the points at which lnlZldeviates most from the desired characteristic, and in successive trials the approximation can be improved. After a few trials, further improvement by this cut-and-try process is difficult to obtain and the following more precise methods of adjustment of pole and zero positions are required.
In any process of adjustment it is helpful to consider the change in the quantity being adjusted as a function of the changes in the adjustable factors. This fact suggests that one consider the rate of change of lnlZI with changes in pole and zero coordinates. The derivatives (ln for example) are not rapidly varying over small changes in pole or z ro posi-tions, particularly if the pole or zero is not close to the imaginary axis of the complex frequency plane. Consequently,
Alniz
= _-I(Zaln
z
+aln IZl
A
+l 81InZ A
d + 8nZI AW ) (3)
i=1
a
pi
awzi
pi
m+il aiz
aniI
+
i=l
pi
pi
+awpi
.pi)
()
la~--I--PI~~I'~I~-~L-'
----
~--F ~ii~-^~-l--~^~----I-(--.
Cx.~^~C--
-r~-rr
^iuQusm~-
-lr~iar
_1-~I_~I.
.--
-~..~~.~.
COMIMNICATIONS RESEARCH)
which by (2) is also
m ai8nX - zi 81n I - X zil
8o
Azi+
wi
AWzi
)-i=1 zi zi
S0pi
d'pi
+ awpipi
both for the case where there are m zero and m+l poles. The derivatives in
(3) are simple functions of frequency which are easily normalized (the func-tions have the same form for fixed oai/wi). The change in lnJZlat any
specified frequency resulting when the poles and zeros are shifted by known small amounts from a given set of positions can easily be approximated through the use of (3). Alternately, if a function, In ZI (corresponding to a known set of zero and pole positions) approximates poorly to a desired characteristic (Figure VIII-18), one may apply relations of the form of (3) to determine suitable changes in the coordinates of zeros and poles. A simple procedure for effecting the adjustment is to choose an appropriate number of points on the characteristic at which a required change is speci-fied (WaWb and Wc, Figure VIII-18). A corresponding number of the pole and zero coordinates to be shifted are chosen, using those which are most
a C TIC TO BE APPROXIMATED---IGH APPROXIMATION
ED
A
In
IZI
(a) =
a,
Ain
IZI (Wb)
=o
AIn Izl
(Wc)
=c
Fig. VIII-18. Rough approximation to given characteristic with desired changes indicated.
(VIII. COMMUNICATIONS RESEARCH)
suited to the changes desired. A solution of simultaneous equations (three for Figure VIII-18) of the form of (3) then gives the required changes in pole and zero positions. In a particular application of this method, a Z which varied by 50 per cent in magnitude over the range in which it should be constant, was used for the first approximation. One shift of poles and
zeros by this method gave a second approximation having a magnitude constant to within less than 10 per cent over the prescribed range. Further refine-ments in the method are possible but, being unnecessary to the problem at hand, will not be investigated until other problems are solved.
b. Splitting Specified Y into
Ya + Yp
The second problem treated is the splitting of 1/Z = Y, found by the above process, into Y +Ya* Yp is a positive real function and Ya is identified with(-gm) Zil Z12 - -- Zingm, the n Zi's being positive real functions each of which approaches 1/XC as A approaches infinity. Hence Ya is the ratio of Hurwitz polynomials behaving at infinity like (-gm)n gm/(XC)n. The argument of Ya must vary from the zero frequency value by less than nr/2 over the whole real frequency spectrum. The.conditions just stated are suf-ficient for Y to be identified with the admittance of a chain of amplifiers.
a
In connection with the application here, splitting a Y into Ya + Yp, it is further necessary that Re Ya be algebraically less than Re Y. This condition insures that Y - Ya = Yp is a positive real function which can be realized by conventional procedures. A method of finding a Ya with the real part alge-braically less than the real part of Y was referred to in the July progress
report. Later, however, an error was discovered in the method proposed. Accordingly, work at the present is directed toward developing suitable
proc-ess for specifying Ya and for determining whether added restrictions on the magnitude of Z are imposed by the conditions which are sufficient for Ya to be associated with the admittance of a chain of amplifiers.
Prof. E.A.Guillemin, J.G.Linvill
3. Sinusoidal Oscillations in Nonlinear Systems
Work here on this project was halted when Professor J.B.Russell returned to ColuMbia University. The investigation is continuing there.
(VIII.' CoiU:ICATIO S RESEARCH)
F. HIGHER MODE PROBLEMS
Prof. L.J.Chu R.B.Adler T.Moreno
1. Steady-State Propagation of Electromagnetic Waves Along Cylindrical Structures
In the last Progress Report it was pointed out that certain difficulties had been encountered in connection with proving some elementary facts about
exponential modes on a bounded cylindrical structure. To a large extent these difficulties have been circumvented since that time. In addition, previous conclusions regarding the absence of true cutoff for modes on a lossless unbounded cylindrical system have been tentatively generalized be-yond the examples mentioned in the Progress Report for July 15, 1948. Some mathematical aspects of this generalization will require review, however, before the generality of the demonstration can be definitely stated.
An outline of additional results during the last quarterly period is given in the following paragraphs.
(A) The first result is an othogonality property of exponential modes on a cylindrical structure. The structure has the following basic properties:
(a) The internal medium is characterized by d , c and p, which may be any reasonable functions of the transverse coordinates.
(b) The boundary condition on the wall is taken to be a dyadic admittance in normal form:
H'. = yzzEz
(1)
Hz = -YTE
The subscript T refers to those field components in the transverse plane which are also tangential to the wall. The admittances y zz and Y7- may be functions of frequency, but not of guide wavelength at a given frequency.
With these restrictions, it was found that an orthogonality condition could be exhibited. The condition is convenient for the expansion of a given transverse electric and magnetic field distribution over any cross section, in terms of the transverse fields for the various exponential modes. If E ETI represents the transverse electric field of a mode whose z-dependence is e-" z, and HT2 is the transverse magnetic field of another mode whose z-dependence is e-2 z, then the orthogonality relation may be written
(VIII. COM1UNICATIONS RESEARCH)
z T1 x H2 d = 0 (2)
provided yl 7 2 # 0. The integral is extended over the guide cross section A, and it must be understood that ET and HT are, by definition, functions only of the transverse coordinates. The surprising aspect of this condition is that it holds for a system with losses. It was thought origi-nally that the orthogonality property would be a consequence of Poynting's
theorem, restricted to lossless cases (see the Progress Reports for April 15 and October 15, 1948). In fact, however, it turns out to be a result of the reciprocity theorem and the assumption (implicit in the form chosen for the boundary conditions) that the structure is unchanged electrically when turned end-for-end.
(B) The second result is really a special case of the first when the system becomes lossless. Explicity, two new restrictions must be imposed:
(c) a = 0 everywhere
(d) Yzz = jbzz and y = jb,7 , with bzz and bTT
real auantities.
It then becomes possible to state that in addition to condition (2) (which still remains valid)
f
T x HT] dd 0. (3)provided 'Y1 +t Y 0.
It is to be observed that although the relation exhibited above appears to be a vector-power restriction, it does not represent the cross-term power between two different modes which simultaneously propagate along the
structure.
It must be emphasized that whereas the condition (3) encompasses the results which can be obtained from Poynting's theorem, it really follows from the more general reciprocity theorem.
(C) In connection with the third conclusion to be presented, it is necessary to make use of one more basic fact:
(e) The complex field vectors are the Fourier transforms of
real time-functions at each point inside the guide, as well as at each point on the bounding wall.
Use of property (e) in connection with assumptions that
'Y + t= (4)
r-~rrrr~u.rr.~--*u~u-ru*---r~---(VIII. COM124UIICATIONS RESEARCH)
for any exponential mode on a lossless cylindrical structure of the type described heretofore. It is interesting to find once again that this
re-striction upon the propagation constant does not come from the law of con-servation of energy (Poynting's theorem). Rather, it emerges from the time-reversal or frequency-time-reversal symmetry of the lossless Maxwell equations,
in conjunction with the assumptions and facts already outlined.
(D) Finally, a tentative demonstration has been given to prove that no loss-less cylindrical structure, surrounded by an unbounded and dissipationloss-less medium, can support an exponential mode below cutoff. This demonstration is based upon the Poynting theorem, and of course includes a proof of the fact
that y cannot be complex either.
While the principal results of the investigation have now been set forth, there are a number of additional consequences of equal interest. For
instance, it is not hard to find simple examples of TE-TM modes which even below cutoff have real time-average power flowing in opposite directions at
various points of the guide cross section. To be sure, the total integrated real-power flow is zero below cutoff, but it is not to be concluded that the real part of the Poynting vector is everywhere zero within the guide. More-over, even when such a mode propagates ('=jp), and
P>0,
it is still possible to find real power flowing in opposite directions at different points of the cross section. The usual correlation between real-power flow at a point, and the sign of P, or the real or imaginary character of y, is pretty well lost in mixed TE-TM modes. It is toward similar corollary properties of TE-TM modes that attention is currently being directed, in order to determine how much of the conventional intuition about exponential modes can be carried over to these more complicated problems. Prof. L.J.Chu, R.B.Adler2. Technicues for Millimeter-Wave Transmission
Transmission through Large Metallic Waveguides. In the analysis of transmission properties of waveguides capable of transmission in two modes, the existence of periodic resonances has been established (See April 15, 1948 Quarterly Progress Report). This analysis has now been extended to include waveguides in which more than two modes can transmit energy, and in which the transmitting and receiving antennas consist of infinitesimal dipoles or arrays of such dipoles. The most important conclusion to be drawn under these con-ditions is that each resonance from each pair of modes is essentially inde-pendent of the resonances from other modes. The criteria of severity and Q which have been established for the two-mode guide may therefore be applied to the multi-mode guide under the above conditions.
(VIII. COMMUNICATIONS RESEARCH)
Experimentally, with horn antennas, more complicated phenomena are observed. Resonances are more numerous than in the two-mode guide, as expected, but are somewhat less severe. There appears to be an effect wherein the severity of a periodic strong resonance is lessened by the presence of a periodic weak resonance, but conversely the severity of the weak resonance is increased by the presence of the strong one. A theoreti-cal analysis for a three-mode waveguide and a more general type of antenna
indicates that these effects may be expected with antennas which are more complex than dipoles or dipole arrays.
Short-Range Transmission Between High-Gain Antennas The use of high-gain antennas at relatively close range in order to obtain efficient energy transmission at millimeter wavelengths has been proposed. This will require that the antennas be sufficiently close together for appreciable interaction effects to be observed. A theoretical and experimental investigation is under way to determine the nature of these interaction effects, and to deter-mine whether it is feasible to use these quasi-optical techniques at
milli-meter wavelengths. Prof. L.J.Chu, T.Moreno
G. LOCKING PHENOMENON IN MICROWAVE OSCILLATORS Prof. J.B.Wiesner J.Pitts E.E.David,Jr. W.Wicks
As reported in the October 15 Progress Report, it has been found desira-ble to investigate the phase-jitter effects associated with a synchronized oscillator. As previously noted these effects in a pulsed tube have been examined. It was believed that further and more reliable data could be obtained by the use of a c-w klystron or magnetron as the locked tube. Such experiments have shown that the phase variations, as first supposed, are due primarily to (a) reflector or plate power-supply ripple, and (b) hum from a-c heated cathodes. A report on this study is now in preparation.
When an oscillator to be synchronized has a load impedance other than Zo, the locked operation of the tube becomes a function of this impedance. An experimental and theoretical investigation of this phenomenon is now being carried out by Mr. Pitts and Mr. Wicks. The results of this analysis will allow the operating condition of a locked oscillator working into a passive load, Z' = f(w), with a synchronizing power, PS, to be uniquely predicted.