HAL Id: hal-00561130
https://hal-iogs.archives-ouvertes.fr/hal-00561130
Submitted on 31 Jan 2011HAL is a multi-disciplinary open access archive for the deposit and dissemination of sci-entific research documents, whether they are pub-lished or not. The documents may come from teaching and research institutions in France or abroad, or from public or private research centers.
L’archive ouverte pluridisciplinaire HAL, est destinée au dépôt et à la diffusion de documents scientifiques de niveau recherche, publiés ou non, émanant des établissements d’enseignement et de recherche français ou étrangers, des laboratoires publics ou privés.
Saturation of the Raman amplification by self-phase
modulation in silicon nanowaveguides
Felix Kroeger, Alexandre Baron, Aleksandr Ryasnyanskiy, Philippe Delaye,
Robert Frey, Nicolas Dubreuil
To cite this version:
Felix Kroeger, Alexandre Baron, Aleksandr Ryasnyanskiy, Philippe Delaye, Robert Frey, et al.. Sat-uration of the Raman amplification by self-phase modulation in silicon nanowaveguides. EOS Topical meeting on Nonlinear Optics and Photonics, Oct 2010, Paris, France. �hal-00561130�
Saturation of the Raman amplification by self-phase modulation in
silicon nanowaveguides
F. Kroeger, A. Baron, A. Ryasnyanskiy, P. Delaye, R. Frey, N. Dubreuil Laboratoire Charles Fabry de l’Institut d’Optique, CNRS, Université Paris-Sud,
Campus Polytechnique RD 128, F-91127 Palaiseau cedex, France email: [email protected]
Summary
We experimentally show that the self-phase modulation of picosecond pump pulses, induced by both the optical Kerr effect and free-carrier refraction, has a detrimental effect on the maximum on-off Raman gain achievable in silicon on insulator nanowave-guides, causing it to saturate, as we confirm with a simple calculationof the Raman gain. Introduction
Silicon-on-insulator (SOI) photonics has attracted a great deal of attention due to its potential solutions for on-chip optical data processing. The high refractive index com-bined with the large third-order nonlinearity exhibited by silicon [1], enable tight optical confinement in sub-micron waveguides and efficient nonlinear functionality, making SOI a promising platform for ultra-compact devices with low-command powers [2]. Stimu-latedRaman scattering is of particular interest for the amplification of optical signals. Experimental results
We have carried out pump-probe experiments with a 11-mm long ridge-type silicon nanowaveguide along the [110] crystallographic axis of silicon, which has an effective mode area of only 0.17 µm2. It was fabricated on silicon-on-insulator (SOI) wafers with a 2-µm-thick oxide layer. The pump pulses are τ =15 ps in duration with a repetition rate of
F = 80 MHz, and they are
delivered by an optical parametric oscillator (OPO). A synchronous pulsed probe of 150 ps is used to measure the Raman gain. Both pump and probe pulses are injected into the nanowaveguide with a microscope. The light is collected behind the waveguide with a similar microscope objective and then injected into a single-mode fiber that is connected to an optical spectrum analyzer (OSA). Fig. 1 shows the output spectra of both the pump (a) and probe pulses (b) for increasing input pump powers.
Fig. 2. Output spectra of (a) the pump pulses and (b) the amplified probe pulses measured for input average pump powers varying from 10 mW to 120 mW (the signal spectra are magnified by a factor 20). The spectral resolution is 0.01 nm. Fig. 1. Output spectra of (a) the pump pulses and (b) the amplified probe pulses measured for input average pump powers varying from 10 mW to 120 mW (the probe spectra are magnified by a factor 20). The spectral resolution is 0.01 nm.
Discussion
Fig. 1(a) shows the pump spectra, which are broadened due to self-phase modulation (SPM) that is induced by the Kerr effect and the free-carrier refraction (FCR). The probe spectrum, shown in Fig. 1(b), consists of a narrow peak (corresponding to the spectrum of the injected probe pulses) and a broader, blueshifted component which is generated by Raman amplification. The total optical power PS of the Raman amplified part can be
determined by applying a numerical low pass filter to the measured probe spectra. A simple analytical model that we have developed allows for the definition of a parameter X, which is proportional to the
peak intensity of the pump pulses in the waveguide, so that the output probe power PS in dBm is
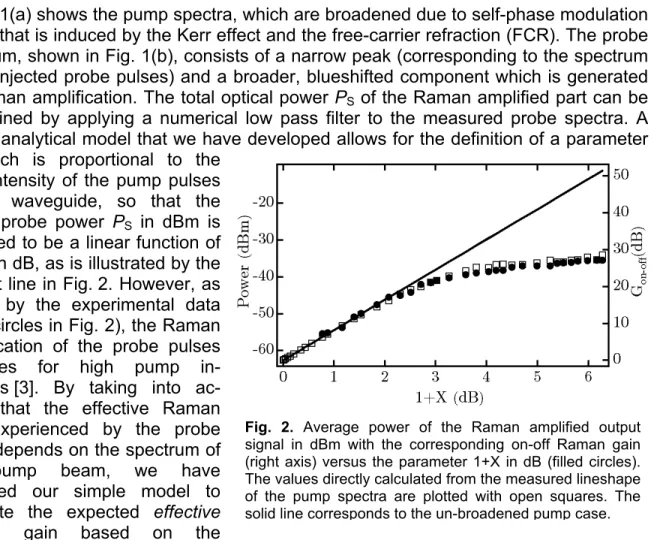
expected to be a linear function of (1+X) in dB, as is illustrated by the straight line in Fig. 2. However, as shown by the experimental data (filled circles in Fig. 2), the Raman amplification of the probe pulses saturates for high pump in-tensities [3]. By taking into ac-count that the effective Raman gain experienced by the probe beam depends on the spectrum of the pump beam, we have extended our simple model to calculate the expected effective Raman gain based on the
measured pump spectra shown in Fig. 1(a). The resulting values are depicted as the open squares in Fig. 2. They show an excellent agreement with the experimental data, and they allow to determine a value of the CW Raman gain coefficient of silicon to be γR= 8.9 cm/GW [3], which is also in good agreement with previously published values.
Conclusion
In conclusion, we have experimentally shown a saturation of the Raman gain in a SOI nanowaveguide in the ps regime which is caused by a nonlinear spectral broadening of the pump beam, governed by both the optical Kerr and free carrier effects. With a simple model, using the lineshapes of the outgoing pump spectra, we reproduce the saturated behavior of the on-off Raman gain along with its maximum value (28 dB).
References
[1] M. Dinu et al., Appl. Phys. Lett. 82, 2954 (2003).
[2] B. Jalali et al., J. Lightwave Technol., 24, 4600-4615, 2006 [3] F. Kroeger et al., Appl. Phys. Lett., 94, 2010 (tbp)
Fig. 2. Average power of the Raman amplified output signal in dBm with the corresponding on-off Raman gain (right axis) versus the parameter 1+X in dB (filled circles). The values directly calculated from the measured lineshape of the pump spectra are plotted with open squares. The solid line corresponds to the un-broadened pump case.