HAL Id: hal-01154672
https://hal-upec-upem.archives-ouvertes.fr/hal-01154672
Submitted on 22 May 2015
HAL is a multi-disciplinary open access
archive for the deposit and dissemination of
sci-entific research documents, whether they are
pub-lished or not. The documents may come from
teaching and research institutions in France or
abroad, or from public or private research centers.
L’archive ouverte pluridisciplinaire HAL, est
destinée au dépôt et à la diffusion de documents
scientifiques de niveau recherche, publiés ou non,
émanant des établissements d’enseignement et de
recherche français ou étrangers, des laboratoires
publics ou privés.
A regionalized automated measurement of ciliary
beating frequency
Élodie Puybareau, Hugues Talbot, G Pelle, B Louis, J.-F Papon, A Coste,
Laurent Najman
To cite this version:
Élodie Puybareau, Hugues Talbot, G Pelle, B Louis, J.-F Papon, et al..
A regionalized
auto-mated measurement of ciliary beating frequency. ISBI 2015, Apr 2015, New-York, United States.
�10.1109/ISBI.2015.7163927�. �hal-01154672�
A REGIONALIZED AUTOMATED MEASUREMENT OF CILIARY BEATING FREQUENCY
E. Puybareau
1,2, H. Talbot
1, G. Pelle
2,3,4, B. Louis
2,3,4, J.-F. Papon
2,3,4,5, A. Coste
2,3,4,5, L. Najman
11
Universit´e Paris-Est, Laboratoire d’Informatique Gaspard Monge , CNRS UMR8049;
2
Inserm UMR955, Cr´eteil, 94000, France;
3
CNRS ERL 7240 Cr´eteil, 94000 France;
4
Universit´e Paris-Est Facult´e de M´edecine, Cr´eteil, 94000, France;
5
AP-HP, Hˆopital Henri-Mondor, A Chenevier et Hˆopital intercommunal, service d’ORL et de chirurgie cervico-faciale, Cr´eteil, Fr-94010.
ABSTRACT
Cilia are slender, microscopic, hair-like structures or or-ganelles that extend from the surface of nearly all mam-malian cells. Motile cilia, such as those found in the lungs and respiratory tract, present a beating motion that keep the airways clear of mucus and dirt. They are thus of primary importance in many respiratory diseases. The performance of mucous transportation in the nasal cavity can be represented by a ciliary beating frequency. In this paper, we propose a fully automated method that computes the beating frequency from a sequence of images taken with high-speed videomi-croscopy. The advantage of our approach is its capacity in computing regionalized frequencies, i.e., various frequencies each associated with one region in the image. Moreover we propose a preprocessing pipeline to alleviate acquistion arte-facts due to the camera or to the cell proper motions. We demonstrate the robustness of our approach, and illustrate its performance in comparison to the state-of-the-art.
Index Terms— Cilia, mucociliary clearance, optical flow, registration, segmentation
1. INTRODUCTION
Muco-ciliary clearance is a crucial mechanism of defense against aerial environmental attacks such as micro-organisms or pollution. This clearance is achieved by the coordinated beating of the cilia covering the nasal epithelium. Cilia motility impairment can be either of genetic (primary ciliary dyskinesia) or acquired origin due to environmental attacks and may entailing chronic diseases such as chronic sinusitis and bronchitis. It is of interest for practitioners to evaluate ciliary beating frequency (CBF) easily, robustly and reliably. The estimation of ciliary beating frequency has been a re-search topic since the middle of the 20th century. One of the first method of reference for measurement of cilary beating frequency was proposed in 1962 and used a photo-sensitive cell [1]. Stroboscopic methods have been replaced by more accurate techniques that use photomultiplier, photodiode and
high-speed imaging. Those methods are described and com-pared in [2]. Analysis via high-speed videomicroscopy is now considered the most accurate method. Hence, the most com-monly used technique today for evaluating ciliary function in human being consists of collecting ciliated cells from nasal or tracheobronchial surface mucosa, to observe them under a microscope and to record their motion via high-speed video acquisition. Evaluation, via these records, of ciliary beating frequency and ciliary beating pattern was reported helpful in the diagnosis of primary ciliary dyskinesia [3, 4, 5]. In clini-cal research, there exist several methods that estimate ciliary beating frequency. Cinematic analyzis [6] counts the number of frames required to complete 10 ciliary beat cycles. It is a time-consuming and user-dependent method, which has to be repeated several times to obtain a reliable result. Kymograph analysis [7] is a linescan-like method where the grey level of a line drawn by the user is analyzed. It is sensible to illumi-nation and vibrations, depends on the location of the line, and is thus also user-dependent.
Some attempts to automate the measurement of CBF have been proposed in the literature. The SAVA System [8] es-timates frequencies from small 4×4 pixels windows. Whole frequency spectra can be simultaneously estimated. It is based on grey-level intensity variation, which has shown some lim-itation if the contrast is not sufficient, rendering the reliability of the technique questionable [9]. CiliaFA [10] provides a frequency histogram of a large number of small regions of in-terest, assuming low noise and no cell proper motion. The method proposed in [11] uses a sparse optical flow to esti-mate a single frequency per image. Thus, it is not applica-ble when several different beating patterns are present in the sequence. Moreover, the method is very sensitive to noise and is easily perturbed by cells proper motion. A linescan-based technique is proposed in [12], coupled with the Fast Fourier Transform, and is evaluated on slices on brain ciliated epithelium. It deals with acquisition problems: the removal of artefacts due to the camera sensor, and frame stabilization. However, the removal needs a blank acquisition sequence and thus access to the camera. More problematic for our
applica-tion, the straight linescan technique needs a straight border of cells, something not always possible with harvested cells.
In this paper, we propose a novel, fully automated tool for the frequency estimation of beating cilia, that overcomes the various limitations of the above methods. In particular, as de-tailed in section 2.1, our method removes the camera artifacts and stabilizes the inner parts of the cells, leading to greater measurement robustness. More importantly, we propose in section 2.2 to segment the cilia in several zones, each of pre-senting a consistent area with the same beating frequency that can be estimated using a dense optical flow. We demonstrate in section 3 the validity of our approach, by comparing it to two established methods for cilia beating frequency estima-tion. Section 4 concludes the paper.
2. METHODOLOGY
In the field of view, multiple cell groups are often visible, and cilia on a given cell can beat at different frequencies. As a result, many frequencies can be measured in a single field of view. Such frequencies provide information on cilia syn-chronization, and ultimately on the status of the cells under scrutiny. We seek to segment the field of view into regions that are consistent from the point of view of the beating pat-tern.
Our method is described as follows: in section 2.1, we re-move acquisition artifacts due to the camera and to the exper-imental protocol. We then segment the images into consistent regions in section 2.2. We first remove the static elements from each image of the sequence, obtaining images where only moving cilia are visible. Inter-images variance allows us to segment each image of the sequence into regions with sim-ilar beating pattern. A dense optical flow provides an estimate of the beating frequency on each one of those regions. 2.1. Preprocessing
Two different acquisition artifacts, inherent to the experi-ment, need to be dealt with: a fixed sensor pattern (a grid-like structure), due to the camera, is visible on the sequence, and harvested cells live in a liquid environment, inducing unde-sirable cell motion.
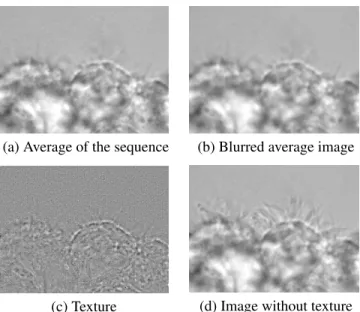
Sensor-pattern removal. A sensor pattern is often present on high-speed camera. Since it is associated with the sensor, it never moves, contrary to the content of the acquired se-quence, consequently the pixel-wise average I = n1P
jIj
of the image sequence integrates the non-moving parts, as well as some residual texture due to the moving parts. A Gaussian filter erases this texture. Subtracting the blurred av-erage frame from the avav-erage frame yields a texture image It = I − (I ? Gσ=1). This texture image is then subtracted
from each image of the sequence, leading to a pattern-free sequence, as illustrated on Fig. 1.
(a) Average of the sequence (b) Blurred average image
(c) Texture (d) Image without texture
Fig. 1. Sensor-pattern removal (see text).
Sequence stabilization. We developped a robust adaptative rigid registration technique, relying on SIFT keypoints [13]. We first remove SIFT outliers by brute-force matching. We then compute candidate transforms by matching points in pairs, obtaining a similarity transform. We project the trans-form to the unit circle to estimate a rigid transtrans-form. As a final step, we select the most explanatory model between identity, translation-only and rigid transform. The result is a texture-free, stabilized sequence Is.
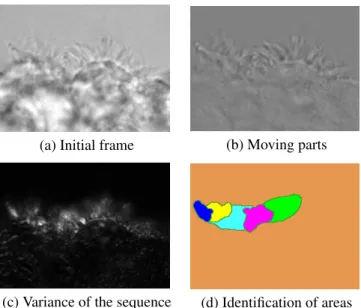
2.2. Region segmentation and frequency estimation By subtracting from each frame the mean of the stabilized sequence, we obtain a sequence Imov of moving elements on a grey-level background, i.e. ∀j ∈ {1 . . . n}, Ijmov = Is
j − 1 n P kI s
k (Fig. 2.b). We compute the variance V of Sdiff,
the sequence of difference of frames (Imov
i − Ii+1mov)i. We
then apply a Gaussian filter (G) on V leading to an image G = V ? Gσ=5 in which each zone with a similar beating
pattern forms a white blob. We threshold G at 30% of the maximum intensity, obtaining Gs= G≥0.3∗max(V). We
calcu-late M1, the markers of the blobs by morphological erosion
and dilation on Gs. We then segment the blobs using a
water-shed WS [14] with k ∇(G) kMthe morphological gradient of
G
R = WS(k ∇(G) kM, M1) (1)
We compute a dense optical flow using F¨arneback’s al-gorithm [15], through which we obtain a dense displacement vector field. In each one of the previously segmented regions, the median of the vectors contained in that region provides the displacement of that region.
(a) Initial frame (b) Moving parts
(c) Variance of the sequence (d) Identification of areas
Fig. 2. The segmentation of the field of view into regions with similar beating pattern relies on the variance of the sequence of the difference between consecutive frames.
speed variation (i.e., the norm of the displacement vector) over time (Fig. 3).
3. RESULTS AND VALIDATION
Data. We analyzed 10 nasal brushing biopsies from patients of the ENT departement of Henri Mondor Hospital (Cr´eteil, France). Nasal brushing produces significant amounts of cells with beating cilia. The diversity in sequence appearances can be appreciated on Fig. 4.
Brushings were recorded under a microscope minutes after the biopsy, at 358 frames per second with a high speed cam-era. The spatial resolution was 0.13µm, and the resolution was 256×192 pixels. The record was taken on the border of the groups.
(a) Speed variation (b) Frequency spectrum
Fig. 3. Fourier analysis of speed variation for one of the sam-ple yields to a frequency of 12.10 Hz.
Fig. 4. Four examples of ciliated cells, showing the large vari-ability in our samples.
Software. We developped our method using python 2.7.6, Pink [16] for python, numpy, scipy and OpenCV for python. Our application runs in less than 20 seconds on an iMac 3.5GHz Core I7, with 32 GB of memory.
Validation. Bland-Altman diagrams show a repartition of the distance between our method and the two methods of refer-ence (cinematic analysis and kymography). We can observe that our frequency estimations are all contained in the confi-dence interval of 95% when compared with the kymography method. By comparison with the cinematic anaysis, only one measure is out of the interval, which remains acceptable.
Importance of preprocessing. Preprocessing steps are meaningful in our context. Removing camera artefacts is necessary for the success of image analysis process. The importance of stabilization can be highlighted by some of the image sequences. Indeed, one example shows a dead cell sequence. If the stabilization is not performed, both our algorithm and the classical techniques estimate a beating fre-quency of 12Hz. A closer look to the video demonstrates that this frequency corresponds to the motion of the cell due to vibrations. After the stabilization, we obtained a frequency of 0 Hz, as expected.
(a) Cinematic analysis (b) Kymography
Fig. 5. Bland-Altman plots show the consistency between our proposed approach vs. cinematic analyis and kymography.
4. CONCLUSION
In this paper, we propose a regionalized automated mea-surement of the ciliary beating frequency, capable of coping with several cell groups, each with their own beating pat-tern. Preprocessing deals with camera artefacts and stabilizes cell proper movement and camera motion to enable a seg-mentation of the moving parts that remain. Those moving parts are cilia, and are segmented according to their motion. Comparison with semi-automated kymography and cinematic analysis for frequency measurement in the same segmented areas shows that our results are significant.
In future work, we will confirm that our approach is in-deed able to process more than one cell group in each field of view. We will also validate our method on a larger database. Furthermore, we believe that we can measure other charac-teristics beyond frequency from the segmented regions. In particular, an analysis of the qualitative components of beat-ing patterns seems achievable, includbeat-ing a full description of range, rhythm and structure.
5. REFERENCES
[1] Tore Dalhamn and Ragnar Rylander, “Frequency of cil-iary beat measured with a photo-sensitive cell,” 1962. [2] Chris O’Callaghan, Kulvinder Sikand, and M Chilvers,
“Analysis of ependymal ciliary beat pattern and beat fre-quency using high speed imaging: comparison with the photomultiplier and photodiode methods,” Cilia, vol. 1, no. 1, pp. 8, 2012.
[3] A Barbato, T Frischer, CE Kuehni, D Snijders, I Azevedo, G Baktai, L Bartoloni, E Eber, A Escrib-ano, E Haarman, et al., “Primary ciliary dyskinesia: a consensus statement on diagnostic and treatment ap-proaches in children,” European Respiratory Journal, vol. 34, no. 6, pp. 1264–1276, 2009.
[4] Wendy A Stannard, Mark A Chilvers, Andrew R Rut-man, Chris D Williams, and Chris O’Callaghan, “Di-agnostic testing of patients suspected of primary ciliary dyskinesia,” American journal of respiratory and criti-cal care medicine, vol. 181, no. 4, pp. 307–314, 2010. [5] Jean-Franc¸ois Papon, Laurence Bassinet, Gwena¨elle
Cariou-Patron, Francoise Zerah-Lancner, Anne-Marie Vojtek, Sylvain Blanchon, Bruno Crestani, Serge Amse-lem, Andre Coste, Bruno Housset, et al., “Quantitative analysis of ciliary beating in primary ciliary dyskinesia: a pilot study,” Orphanet journal of rare diseases, vol. 7, no. 1, pp. 78, 2012.
[6] Mark A Chilvers and Christopher O’Callaghan, “Analy-sis of ciliary beat pattern and beat frequency using
digi-tal high speed imaging: comparison with the photomul-tiplier and photodiode methods,” Thorax, vol. 55, no. 4, pp. 314–317, 2000.
[7] RT Doyle, T Moninger, N Debavalya, and WH Hsu, “Use of confocal linescan to document ciliary beat fre-quency,” Journal of Microscopy, vol. 223, pp. 159–164, 2006.
[8] JH Sisson, JA Stoner, BA Ammons, and TA Wyatt, “All-digital image capture and whole-field analysis of ciliary beat frequency,” Journal of microscopy, vol. 211, no. 2, pp. 103–111, 2003.
[9] Johanna Raidt, Julia Wallmeier, Rim Hjeij, J¨org Große Onnebrink, Petra Pennekamp, Niki T Loges, Heike Ol-brich, Karsten H¨affner, Gerard W Dougherty, Heymut Omran, et al., “Ciliary beat pattern and frequency in ge-netic variants of primary ciliary dyskinesia,” European Respiratory Journal, pp. erj00520–2014, 2014.
[10] Claire M Smith, Jana Djakow, Robert C Free, Petr Djakow, Rana Lonnen, Gwyneth Williams, Petr Po-hunek, Robert A Hirst, Andrew J Easton, Peter W An-drew, et al., “ciliafa: a research tool for automated, high-throughput measurement of ciliary beat frequency using freely available software,” Cilia, vol. 1, no. 1, pp. 1–7, 2012.
[11] Woojae Kim, Tae Hwa Han, Hyun Jun Kim, Man Young Park, Ku Sang Kim, and Rae Woong Park, “An auto-mated measurement of ciliary beating frequency using a combined optical flow and peak detection,” Healthcare informatics research, vol. 17, no. 2, pp. 111–119, 2011. [12] Olivier Meste, Fr´ed´eric Brau, and Alice Guyon, “A New Method for the Robust Estimation of the Motile Cilia Beating Frequency,” Tech. Rep. hal-00806681, Labo-ratoire d’Informatique, Signaux, et Systmes de Sophia-Antipolis (I3S), Apr. 2013.
[13] D G Lowe, “Object recognition from local scale-invariant features,” in IEEE ICCV, 1999, vol. 2, pp. 1150–1157.
[14] Jean Cousty, Gilles Bertrand, Laurent Najman, and Michel Couprie, “Watershed cuts: Minimum spanning forests and the drop of water principle,” Pattern Anal-ysis and Machine Intelligence, IEEE Transactions on, vol. 31, no. 8, pp. 1362–1374, 2009.
[15] G Farneb¨ack, Polynomial Expansion for Orientation and Motion Estimation, Ph.D. thesis, Link¨oping, 2002. [16] Michel Couprie, Laszlo Marak, Hugues Talbot, et al.,
“Pink image processing library,” in Poster European Python Scientific Conference, 2011.