Computational methods for studying cellular
differentiation using single-cell RNA-sequencing
by
Hui Ting Grace Yeo
Submitted to the Department of Computational and Systems Biology
in partial fulfillment of the requirements for the degree of
Doctor of Philosophy in Computational and Systems Biology
at the
MASSACHUSETTS INSTITUTE OF TECHNOLOGY
September 2020
c
○ Massachusetts Institute of Technology 2020. All rights reserved.
Author . . . .
Department of Computational and Systems Biology
August 30, 2020
Certified by . . . .
David K. Gifford
Professor of Electrical Engineering and Computer Science
Thesis Supervisor
Accepted by . . . .
Christopher B. Burge
Professor of Biology
Director, Computational and Systems Biology Graduate Program
Computational methods for studying cellular differentiation
using single-cell RNA-sequencing
by
Hui Ting Grace Yeo
Submitted to the Department of Computational and Systems Biology on August 30, 2020, in partial fulfillment of the
requirements for the degree of
Doctor of Philosophy in Computational and Systems Biology
Abstract
Single-cell RNA-sequencing (scRNA-seq) enables transcriptome-wide measurements of single cells at scale. As scRNA-seq datasets grow in complexity and size, more complex computational methods are required to distill raw data into biological insight. In this thesis, we introduce computational methods that enable analysis of novel scRNA-seq perturbational assays. We also develop computational models that seek to move beyond simple observations of cell states toward more complex models of underlying biological processes. In particular, we focus on cellular differentiation, which is the process by which cells acquire some specific form or function.
First, we introduce barcodelet scRNA-seq (barRNA-seq), an assay which tags in-dividual cells with RNA ‘barcodelets’ to identify them based on the treatments they receive. We apply barRNA-seq to study the effects of the combinatorial modula-tion of signaling pathways during early mESC differentiamodula-tion toward germ layer and mesodermal fates. Using a data-driven analysis framework, we identify combinatorial signaling perturbations that drive cells toward specific fates.
Second, we describe poly-adenine CRISPR gRNA-based scRNA-seq (pAC-seq), a method that enables the direct observation of guide RNAs (gRNAs) in scRNA-seq. We apply it to assess the phenotypic consequences of CRISPR/Cas9-based alterations of gene cis-regulatory regions. We find that power to detect transcriptomic effects depend on factors such as rate of mono/biallelic loss, baseline gene expression, and the number of cells per target gRNA.
Third, we propose a generative model for analyzing scRNA-seq containing un-wanted sources of variation. Using only weak supervision from a control population, we show that the model enables removal of nuisance effects from the learned repre-sentation without prior knowledge of the confounding factors.
Finally, we develop a generative modeling framework that learns an underlying differentiation landscape from population-level time-series data. We validate the mod-eling framework on an experimental lineage tracing dataset, and show that it is able to recover the expected effects of known modulators of cell fate in hematopoiesis.
Thesis Supervisor: David K. Gifford
Acknowledgments
I am incredibly grateful to all the people who have supported me throughout my Ph.D. journey, and who have contributed to my scientific and personal growth.
First, I would like to thank my Ph.D. advisor David Gifford for his mentorship and guidance throughout my graduate career. Dave has built for his students an incredible environment in which we are continuously encouraged to learn and to chal-lenge ourselves. His unwavering support has never failed to get me through various challenges and setbacks. I will always aspire to his level of scientific passion and intellectual rigor. I would also like to thank my thesis committee members Ernest Fraenkel, Phillip Sharp and Hynek Wichterle for their invaluable feedback and advice. Second, I would like to thank the members of the Gifford lab, past and present, for making the lab a fun, welcoming and collaborative workplace. I especially thank Nisha Rajagopal and Yuchun Guo, who helped me get started in the lab during my initial rotation; Haoyang Zeng, who braved with me the arcane intricacies of cluster management; and Ziheng (Tony) Wang and Sachit Saksena, for the inspiring discus-sions and collaborations on scRNA-seq projects. Thanks also to Tatsu Hashimoto, Matt Edwards, Jonas Mueller, Saber Liu, Jennifer Hammelman, Konstantin Krismer, Siddhartha Jain, Benjamin Holmes, Brandon Carter, Wilson Louie and Zheng Dai for the friendship and camaraderie over the years. I would also like to thank Jeanne Darling and Patrice Macaluso for their administrative help and warm support.
I also want to thank the Sherwood Lab, without whom much of the work in the thesis would not exist. In particular, I would like to thank Richard Sherwood, who made possible all of the extraordinary collaborative work, and whose passion for science as well as astute vision and insight has continuously inspired me. Thanks also to Qing Chen and Budhaditya Banerjee, for always indulging to explain every experimental detail, and for the many experimental collaborations.
I am also grateful to the scientific mentors who set me on this path. I would like to thank Niranjan Nagarajan, Andreas Wilm and Denis Betrand at the Genome Institute of Singapore for first introducing me to the world of computational biology.
That one summer will come to define my entire academic career. I would also like to thank Rachel Karchin, Rachel Green, Nicholas Guydosh, Peter Froehlich and Joanne Selinski for helping me to learn and to grow as a scientist during my undergraduate years at Johns Hopkins University. Thanks also to the A*STAR Graduate Academy, who made all this possible in the first place, and to Christopher Burge, Jacqueline Carota and the Computational Systems Biology Department for the opportunity to come to MIT.
I also want to thank all my friends, near and far, who have brought meaning and happiness to my life amidst the stresses of graduate school. To my 415 RGS classmates, to the NSS Ph.D. scholarship class of 2014, to all those from Hopkins who moved to the greater Boston area (and then away again), and those who didn’t: I hope to see you all again soon. And of course, thank you to Tristan for being by my side every step of the way. You are my best friend, and you make everyday a little brighter just by being there. I am also thankful for Tristan’s family, especially Anne, George, Gerold and Tracey, for always making me feel welcome in their homes.
Finally, I would like to thank my family for their unconditional love and for their support of my scientific pursuits, even when it took me far, far away from home. To my parents especially: I could not have done any of this without you.
Contents
1 Introduction 19
1.1 Background . . . 19
1.1.1 Cellular differentiation . . . 19
1.1.2 Single cell RNA-sequencing . . . 20
1.1.3 Computational methods . . . 21
1.2 Thesis outline . . . 25
1.3 Previously published work . . . 25
1.4 Collaborators . . . 26
I
Computational methods for perturbational assays
27
2 A multiplexed barcodelet single-cell RNA-seq approach elucidates combinatorial signaling pathways that drive ESC differentiation 29 2.1 Summary . . . 292.1.1 Abstract . . . 29
2.1.2 Contributions . . . 30
2.2 Introduction . . . 31
2.3 Results . . . 34
2.3.1 Barcodelet scRNA-seq enables the observation of hundreds of treatment conditions in a single highly-multiplexed experiment 34 2.3.2 Combinatorial treatments induce specific and consistent expres-sion profiles . . . 39
2.3.3 A regression analysis framework identifies combinatorial
inter-actions in signaling pathways . . . 42
2.3.4 Specific differentiation conditions correspond to in vivo embry-onic cell types . . . 48
2.3.5 Combinatorial treatments drive mesendodermal cells cells to-ward diverse and specific fates . . . 53
2.4 Discussion . . . 57
2.5 Computational methods and analyses . . . 60
2.5.1 Assignment of treatment condition . . . 60
2.5.2 Transcriptome preprocessing . . . 61
2.5.3 Internal validation . . . 61
2.5.4 A Bayesian regression analysis framework for modeling gene expression . . . 62
2.5.5 Concordance of scRNA-seq and reporter data . . . 62
2.5.6 Scoring cells using classifiers trained on existing in vivo data . 62 2.5.7 Unsupervised de novo discovery of cell subpopulations . . . . 63
2.5.8 Characterization of Foxa2GFP+ population . . . 64
3 Detection of gene cis-regulatory element perturbations in single-cell transcriptomes 65 3.1 Summary . . . 65 3.1.1 Abstract . . . 65 3.1.2 Contributions . . . 66 3.2 Introduction . . . 66 3.3 Results . . . 68
3.3.1 Adding a 3’ poly-adenine tract to gRNAs enables robust detec-tion in oligo(dT)-primed reverse transcripdetec-tion without compro-mising mutagenic activity . . . 68
3.3.2 Mutations at regulatory regions produce a diverse array of geno-typic and phenogeno-typic outcomes . . . 70
3.3.3 High-confidence detection of 25A-gRNAs in scRNA-seq datasets 72
3.3.4 pAC-Seq analysis of cis-gRNA-targeted cells with defined
phe-notypes . . . 77
3.3.5 A simulated-based power analysis framework guides future ex-perimental design . . . 78
3.4 Discussion . . . 82
3.5 Computational methods and analyses . . . 84
3.5.1 Assignment of gRNAs to single-cells. . . 84
3.5.2 Preprocessing of transcriptome . . . 85
II
Computational models for deeper biological insight
86
4 Disentangling unwanted sources of variation in single-cell RNA-sequencing data under weak supervision 87 4.1 Summary . . . 87 4.1.1 Abstract . . . 87 4.1.2 Contributions . . . 88 4.2 Introduction . . . 88 4.2.1 Motivation. . . 88 4.2.2 Related Work . . . 89 4.3 Results . . . 904.3.1 Learning a disentangled representation using only weak super-vision . . . 90
4.3.2 Cell cycle as a confounding source of variation . . . 92
4.3.3 rb-VAE-e achieves lower reconstruction error on both control and treatment datasets . . . 94
4.3.4 rb-VAE-e learns a more disentangled representation of pertur-bational effects . . . 94
4.4 Discussion . . . 98
4.5.1 Model implementation . . . 100
4.5.2 Data preprocessing . . . 101
4.5.3 Cell cycle genes . . . 101
5 Generative modeling of single-cell population time series for identi-fying cell differentiation landscapes 103 5.1 Summary . . . 103
5.1.1 Abstract . . . 103
5.1.2 Contributions . . . 104
5.2 Introduction . . . 104
5.3 Results . . . 107
5.3.1 Learning a generative model of cellular differentiation from high-dimensional scRNA-seq data . . . 107
5.3.2 Generative model recovers population at held-out time point . 110 5.3.3 Incorporating cell proliferation greatly improves fate prediction 113 5.3.4 Generative modeling framework generalizes to data points not observed during training . . . 118
5.3.5 in silico perturbations produce expected changes in final cell proportions . . . 119
5.4 Discussion . . . 122
5.5 Methods . . . 126
5.5.1 Identifying the latent dynamics of cellular differentiation . . . 126
5.5.2 Incorporating cell proliferation. . . 127
5.5.3 Model implementation and optimization . . . 129
5.5.4 Preprocessing of Weinreb et al. experimental lineage tracing dataset. . . 130
5.5.5 Evaluation of model performance on recovering a held-out time point . . . 130
5.5.6 Evaluation on predicting cell fate bias. . . 132
6 Conclusions 135
6.1 Perturbational experimental design . . . 136
6.2 Integrating single cell measurements. . . 138
III
Appendix
141
A Additional experimental results related to barRNA-seq 143 A.1 Survival and gene expression of mouse ESCs (mESCs) and their deriva-tives were unaffected by RNA transfection of barcodelets . . . 143A.2 Enhancers and promoters can implement signaling based combinatorial control of gene expression . . . 144
A.3 Experimental materials and methods . . . 148
B Additional experimental results and methods related to pAC-seq 149 B.1 Supplementary figures . . . 149
B.2 Experimental materials and methods . . . 154
B.2.1 Plasmids, cloning, and molecular biology . . . 154
B.2.2 Cell culture and knock-in lines . . . 154
B.2.3 MERA screening and analysis . . . 155
B.2.4 Deep sequencing of genomic DNA . . . 155
List of Figures
2-1 A multiplexed barcodelet single-cell RNA-seq approach elucidates
com-binatorial signaling pathways that drive ESC differentiation . . . 30
2-2 barRNA-seq enables combinations of a set of treatments to be observed
in a single highly-multiplexed experiment . . . 32
2-3 Barcodelets enable assignment of treatment combinations to single cells 36
2-4 Summary of datasets collected . . . 38
2-5 Combinatorial treatments induce specific and consistent expression
profile . . . 40
2-6 Model accuracy is higher when predicting combinatorial pathway status 41
2-7 Gene expression at the germ layer stage requires highly complex
inter-actions between signaling pathways . . . 43
2-8 Bayesian model regression analysis of genes in cells starting at the
mESC stage.. . . 45
2-9 Clustering reveals genes sharing similar regulatory logic . . . 46
2-10 Gene-level analysis of cells starting at the mesendoderm stage . . . . 47
2-11 Schematic of two approaches for identifying specific different conditions
under which cells are driven to particular fates . . . 48
2-12 Specific differentiation conditions starting from mESC correspond to
known embryonic cell types . . . 49
2-13 Mesendodermal cells are directed to diverse fates by combinatorial
sig-naling . . . 51
2-15 Unsupervised clustering analysis for cells independently discovers cell
subpopulations identified by the supervised approach . . . 54
2-16 Unsupervised clustering identifies additional cell sub-populations . . . 55
2-17 Cells expressing notochord markers are selected for by activating Tgf𝛽+ 56 3-1 Polyadenylated guide RNAs retain activity and are robustly detectable in dT-primed reverse transcription. . . 69
3-2 Mutations at Msh2 regulatory regions infrequently induce biallelic loss of expression. . . 70
3-3 pAC-Seq faithfully recovers gRNA identity and transcriptomic differ-ences in pooled single cell RNA-seq of pre-sorted populations . . . 73
3-4 PCR-based enrichment of specific transcripts increases UMI-unique reads without skewing relative abundance . . . 75
3-5 Target genes are significantly down-regulated in cell populations re-ceiving guides targeting those genes . . . 76
3-6 Detection of rare loss of expression events caused by CRISPR/Cas9 non-coding mutation in wildtype cell pools . . . 79
3-7 Simulated-based power analysis for detecting downregulation of target gene with varying size of treatment population . . . 80
3-8 Simulated-based power analysis for detecting downregulation of target gene with varying total loss fractions . . . 81
4-1 Control and treatment populations from a perturbational experiment are jointly modeled as being generated from two sets of disentangled latent variables . . . 89
4-2 Block diagrams describing rb-VAE/rb-VAE-e and linear baselines . . 93
4-3 UMAP visualization of s . . . 95
4-4 UMAP visualization of u . . . 96
4-5 UMAP visualization of [s; u] . . . 97
5-1 Current methods for fate prediction either summarize observations in
a model-free manner or are limited in modeling capacity . . . 105
5-2 A generative model of cellular differentiation . . . 108
5-3 Generative modeling enables fate prediction for in silico cell states . . 109
5-4 Generative modeling framework predicts marginal populations at
train-ing and testtrain-ing time points . . . 111
5-5 Training and testing performance improves over training epochs . . . 112
5-6 Generative modeling framework predicts cell fate biases in neutrophil/macrophage
lineages . . . 114
5-7 Generative modeling framework learns underlying potential function
parameterizing differentiation landscape . . . 115
5-8 Incorporating cell proliferation greatly improves model performance on
predicting cell fate . . . 116
5-9 Estimated cell proliferation correlates weakly but significantly with
measured cell proliferation rates . . . 117
5-10 Upregulating TFs associated with neutrophil fate increases fraction of
neutrophils . . . 119
5-11 in silico perturbations of hematopoeisis results in expected shifts in
fate distribution . . . 121
5-12 Increasing magnitude of perturbation results in larger shifts in final
cell fate distribution . . . 123
5-13 Ensemble perturbations result in consistent changes in fate distributions124
5-14 Lowering training rate reduces model divergence . . . 131
5-15 Ensembling predictions over last 5 epochs stabilizes fate prediction
performance . . . 134
A-1 RNA transfection of barcodelets have no detectable effect on survival
or gene expression. . . 144
A-2 Sequence features implement signaling-based combinatorial control of
A-3 ChIP-seq tracks for the RA effector Rarg and Wnt effector Tcf7l2 for
Evx1, Pbx1, Lefty and Cdx1. . . 147
B-1 Consistently robust activity of 25A-gRNAs . . . 150
B-2 Cis-gRNA targeting of Tdgf1GFP/mCherry knock-in lines . . . . 151
B-3 Flow cytometric purity of GFP-mCherry- populations after double
sorting . . . 152
List of Tables
2.1 Gene expression is strongly predictive of pathway status . . . 41
3.1 Comparison with CROP-seq . . . 75
4.1 Model benchmarking results on reconstruction . . . 94
4.2 Model benchmarking results on s for predicting perturbation identity 95
4.3 Model benchmarking results on u for predicting perturbation identity 96
4.4 Model benchmarking results on [s; u] for predicting perturbation identity 97
Chapter 1
Introduction
This chapter opens with a brief overview of single-cell RNA-sequencing (scRNA-seq) technology and its application to studying cellular differentiation. It describes current computational methods within the scRNA-seq analysis pipeline and their limitations, providing context for the work presented in this thesis. An outline of the thesis is then set out in section 1.2.
1.1
Background
1.1.1
Cellular differentiation
Cellular differentiation refers to the process by which a cell acquires some specific form or function. It is the underlying biological phenomenon that gives rise to the vast diversity of cell types forming any given multi-cellular organism. One useful framework for thinking about cellular differentiation is via the ‘epigenetic landscape’, a concept first introduced by Conrad Waddington in 1957. In his landscape, Wadding-ton compared cells to marbles rolling down a hill toward troughs that correspond to cell fates. The study of the natural process of differentiation is then the study of how cells traverse this landscape [39, 74].
A central goal of regenerative medicine is not only just to describe this landscape, but also to efficiently manipulate how cells travel along it in vitro. The ability to
create any in vivo cell type on demand is of great importance to disease research and cell-based therapies that require cell types that scientists have otherwise limited access to [23]. Several strategies exist today for in vitro manipulation. In directed differentiation, growth factors and/or small molecules are used to direct cells from pluripotency toward specialized fates. These protocols often attempt to replicate natural conditions leading to specification of that cell type, and hence depend heavily on what prior knowledge is available of how these cell types are formed naturally [99]. In reprogramming, fully differentiated cells are either converted back into pluripotent or multipotent states, or are directly transdifferentiated into the target cell type without passing through an intermediate stage [23, 66]. Famously, Takahashi and Yamanaka showed that a cocktail of Oct3/4, Sox2, Klf4, and c-Myc could be used to induce pluripotent stem cells from mouse embryonic fibroblasts (MEF) and adult mouse tail-tip fibroblasts [141, 126]. In Waddington’s landscape, this could either correspond to shoving the marble back up the hill via injection of an external force, or a transformation of the underlying landscape itself [74].
It is the great hope of regenerative medicine that a better understanding of the features shaping the differentiation landscape would lead to an improved capacity to arbitrarily manipulate cell fates. Waddington had originally coined the term ‘epige-netics’ to describe how the causal interactions of genes could result in cells adopting different forms and functions despite sharing the same genotype. Today, ‘epigenetics’ more broadly refers to heritable phenotypic changes that occur without alternations to the underlying DNA [46]. The most well-studied of these phenotypic changes is gene expression.
1.1.2
Single cell RNA-sequencing
Although the process of differentiation is often thought of in terms of decision-making at the level of a single cell, it was not until the advent of single-cell RNA-sequencing (scRNA-seq) that it became possible to make transcriptome-wide measurements of single cells at scale. In the past, measurements of single cells were limited by cost and labor to a small set of genes. In contrast, bulk transcriptomic methods were able
to profile full transcriptomes but could only offer measurements averaged over cell populations. This obscured much of the heterogeneity and stochasticity present in any given cell population. Specific subpopulations could still be studied via sorting but this required a priori knowledge of the existence of that subpopulation and its associated markers [142].
In droplet-based scRNA-seq, cells are encapsulated into droplets such that during reverse transcription of poly-adenylated RNAs within each droplet, resulting cDNAs are tagged with a cell-specific barcode that identifies the cell from which they origi-nated. Droplets are subsequently broken and the resulting cDNAs are amplified and prepared for sequencing [88, 163]. This breakthrough has enabled thousands of cells to be profiled in a single sequencing run. More recent methods such as SPLiT-seq profiled >100,000 single-cell transcriptomes from the developing mouse brain and spinal cord using a split-pool strategy where cells are repeatedly split into 96-well plates, barcoded, pooled, and then split again. The authors estimate this combina-torial barcoding strategy to enable library preparation costs of as low as ∼$0.01 per cell [114].
These high-throughput scRNA-seq technologies have proven to be a powerful tool for studying natural cell populations. They have been used for a variety of appli-cations, from uncovering rare subpopulations in an unbiased manner [47, 61, 152], to estimating gene expression dynamics. Much effort is currently being expended toward the goal of comprehensively cataloging all cell types in humans (as well as in other organisms) [108, 140, 49, 100, 3, 85], and in fact to clarify the very concept of the cell type itself. Increasingly, scRNA-seq studies have shown that cells often exist along cell state continuums, making simple definitions of distinct cell types or states challenging [108, 146].
1.1.3
Computational methods
A single scRNA-seq experiment can produce a massive amount of data that has to be distilled into coherent biological insight. In human or mice experiments, a typical amount of data produced by an scRNA-seq experiment is on the order of thousands
to hundreds of thousands of cells multiplied by the total number of genes detected. The total number of genes detected depends in turn on the total sequencing coverage of the experiment, with deeper coverage enabling more complete profiling.
Experimental design
scRNA-seq is most commonly used to profile unperturbed cell populations. However, as the technology has matured, it has been increasingly used in more complicated experimental designs where the goal is not only to profile expression, but to also link expression with other measurements or external perturbations. Computational tools are required to reliably detect and process these other observations or perturbations, and then to relate them to expression in a meaningful manner.
Examples of measurements in non-perturbational settings include data collected by approaches like experimental lineage tracing methods [153, 149, 9], multimodal single cell approaches [18, 95, 164], spatial transcriptomic methods [21, 133, 96], and many more. Although these also pose interesting computational challenges, they are not the focus of this thesis.
scRNA-seq has also been employed downstream of large-scale perturbation assays, such as in combination with CRISPR-mediated gene knockout or repression [1, 32,
27]. By treating each cell as an experiment, scRNA-seq enables high information content read-out of the consequences of these perturbational technologies, which had previously been otherwise limited to studying a small set of gene markers or a specific cellular phenotype. In general, coupling these perturbational technologies to scRNA-seq is a matter of making the perturbation itself also detectable in scRNA-scRNA-seq. Then, the perturbation that the cell had observed can be recovered computationally in the scRNA-seq readout.
In the first part of the thesis, we introduce two novel perturbational assays and specialized computational methods that enable their analysis. In chapter2, we show how small molecule/growth factor perturbations can be made observable in scRNA-seq data via RNA barcodelets, and apply the assay that we have developed to study mESC differentiation toward germ layer and mesodermal fates. In chapter 3, we
study when the transcriptomic effects of CRISPR-based cis-regulatory element per-turbations are detectable in scRNA-seq data.
Preprocessing and quality control
Analysis of scRNA-seq data begins with the transformation of raw sequencing reads to cell-by-gene counts, which are then further preprocessed for downstream analy-sis. This component of the analysis borrows heavily from prior work in bulk RNA-sequencing. To extract counts from raw reads, existing transcriptomic alignment pipelines have been adapted to address specific problems in scRNA-seq [163, 131]. For example, droplet-based scRNA-seq commonly also tags cDNA with a unique molecular identifier in addition to the cell barcode to account for biases arising in the amplification step. These unique molecular identifiers are used in conjunction with the cell barcodes and alignments to deduplicate final counts. As another example, be-cause multiple cells can sometimes be encapsulated in the same droplet and hence get tagged with the same cell barcode, doublet or multiplet detection methods have been described for identifying these anomalies and removing them prior to downstream analysis [136, 157].
After obtaining the cell-by-gene count matrix, preprocessing typically proceeds via the following steps [86, 16, 92]. First, quality control metrics such as proportion of mitochondrial reads or total counts/genes detected per cell are computed and used to filter outliers. Then, counts are normalized for cell-specific effects such as sequencing depth via estimates of size factors, or using spike-in transcripts. While these effects are usually technical in nature, there is also interest in removing biological confounding effects that are of no interest to downstream analysis. Existing methods for this tackle specific effects such as cell cycle, but require a priori knowledge of the confounding effects [16, 13]. More general methods that do not necessitate expert knowledge or tedious curation of gene sets is hence desirable. This motivates our generative modeling framework described in chapter4that is able to remove confounding effects using only weak supervision from a control dataset containing only the nuisance variation.
Following normalization, since genes that do not vary between cells are often not of interest to downstream analysis, a feature selection method is next applied to determine a set of highly variable genes. This reduces computational overhead and complexity in downstream analysis.
Downstream analysis
Downstream analysis of preprocessed counts largely depends on the kind of analyses the experimental design permits, and the original goals of the study [86,16,92]. For example, if multiple cell populations had been assayed to study the differences between them, a typical approach might be differential expression analysis. In hypothesis-free settings where the goal might be to uncover subpopulations in a de novo manner, unsupervised approaches such as dimensionality reduction and clustering would be more appropriate. Differential expression can then proceed using these discovered subpopulations.
Again, bulk RNA-sequencing methods may apply, but more specific methods have also been described to deal with specific characteristics of scRNA-seq data [150]. For example, one unique challenge of scRNA-seq data is dropout, where expression of a given gene is present in reality but undetected in the data, making it difficult to distinguish true zeros from zeros arising from incomplete capture. As such, scRNA-seq-specific differential expression and dimensionality reduction methods sometimes explicitly model dropout to ameliorate its confounding effects [65, 41, 102, 79]. An-other difference between scRNA-seq data is bulk sequencing data is the heterogeneity present within a given cell population or sub-population, and the capacity of the tech-nology to detect this heterogeneity. As such, while differential expression analysis in the bulk setting is concerned only with changes in mean expression, differential ex-pression analysis in the scRNA-seq setting can also test more complicated hypotheses such as distributional shifts [97].
Finally, more specific methods have been developed for particular biological set-tings. In the case of cellular differentiation, a popular category is trajectory inference methods, in which cells are ordered statistically along an arbitrary measurement called
’pseudo-time’ [117,146,142]. A related task is cell fate prediction, where the goal is to predict for a given progenitor its final cell fate distribution [120,54,154]. These tasks can be framed as specific applications of models that seek to describe the dynamic or stochastic nature of the cellular differentiation process. However, existing models merely provide summaries of cell states and their couplings and have limited to no capacity to model the underlying differentiation process. A more complete discussion as well as a generative modeling framework for generating stochastic differentiation trajectories [52] is described in chapter5.
1.2
Thesis outline
This thesis is organized into two thematic sections.
The first section concerns specialized computational methods for perturbational assays. In chapter 2, we explore the hypothesis that we can systematically explore a large number of non-genetic cellular perturbations by tagging individual cells with RNA ’barcodelets’ based on the treatments they receive. In chapter 3, we introduce poly-adenine CRISPR gRNA-based single-cell RNA-sequencing (pAC-seq) to inves-tigate if we can improve upon existing methods for observing guide RNAs (gRNAs) in scRNA-seq.
The second section concerns more complex computational models for analyzing scRNA-seq data that share the goal of developing deeper biological insight. In chapter
4, we study if weak supervision from a control population can be used to disentangle unwanted sources of variation in single-cell RNA-sequencing data. In chapter 5, we examine if underlying cell differentiation landscapes can be recovered from single-cell population time series data via a generative modeling framework.
1.3
Previously published work
Chapter 2 is derived from work published by Yeo et al. [160]. Chapter 4 is derived from work included in the proceedings of MLCB 2019 [161]. Chapters 3 and 5 are
derived from manuscripts being prepared for publication.
1.4
Collaborators
This thesis would not have been possible without several close experimental and computational collaborations with members of the Gifford Lab and the Sherwood Lab. In particular, all experimental and validation work from chapters 2and 3were performed by members of the Sherwood Lab, including Lin Lin, Celine Yueyue Qi, Minsun Cha, Oschar Juez, Qing Chen, Budhaditya Banerjee, Lendy Chu, May Sabry, Ive Logister and Richard Sherwood. Computational results for MERA from chapter
3were by Max Shen from the Gifford Lab. The work in chapter 5arose from a close collaboration with Sachit Saksena from the Gifford Lab.
Part I
Computational methods for
perturbational assays
Chapter 2
A multiplexed barcodelet single-cell
RNA-seq approach elucidates
combinatorial signaling pathways
that drive ESC differentiation
2.1
Summary
2.1.1
Abstract
Empirical optimization of stem cell differentiation protocols is time-consuming, labor-intensive, and typically does not comprehensively interrogate all relevant signaling pathways. Here we describe barcodelet single-cell RNA-seq (barRNA-seq), which en-ables systematic exploration of cellular perturbations by tagging individual cells with RNA ‘barcodelets’ to identify them based on the treatments they receive. We apply barRNA-seq to simultaneously manipulate up to seven developmental pathways and study effects on embryonic stem cell (ESC) germ layer specification and mesodermal specification, uncovering combinatorial effects of signaling pathway activation on gene expression. We further develop a data-driven framework for identifying combinato-rial signaling perturbations that drive cells toward specific fates, including several
annotated in an existing scRNA-seq gastrulation atlas, and utilize this approach to guide ESC differentiation into a notochord-like population. We expect barRNA-seq will have broad utility for investigating and understanding how cooperative signaling pathways drive cell fate acquisition.
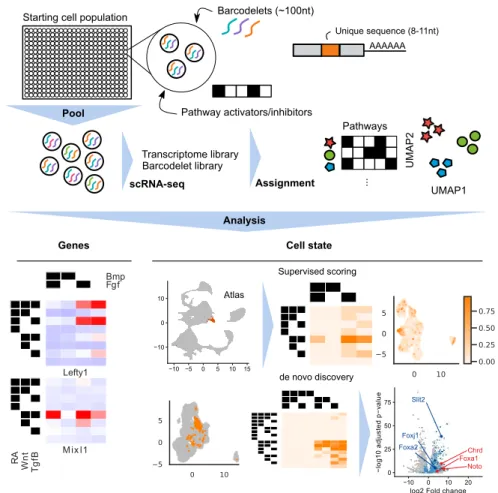
Starting cell population Barcodelets (~100nt)
Transcriptome library Barcodelet library UMAP1 UMAP 2 ... Pathways Pool scRNA-seq Assignment Pathway activators/inhibitors Analysis AAAAAA Unique sequence (8-11nt)
Genes Cell state
Bmp Fgf Lefty1 R A W n t Tg fB Mix l1 −10 0 10 −10 −5 0 5 10 15 Model Train Score Barcodelet data Analysis
Rank treatment conditions by mean score, identify cell type markers
Unsupervised Barcodelet data Fit
Clustering 0.40 0.45 NVI) Per classifier Atlas Supervised scoring de novo discovery Slit2 Foxj1 Foxa2 Chrd Noto Foxa1 0 25 50 75 −10 0 10 20
log2 Fold change
− lo g 1 0 a d ju st e d p − va lu e
Figure 2-1: A multiplexed barcodelet single-cell RNA-seq approach elu-cidates combinatorial signaling pathways that drive ESC differentiation. barRNA-seq tags cells with RNA ’barcodelets’, enabling simultaneous read-out of a cell’s transcriptome and the combination of treatments that it has received via scRNA-seq. We apply barRNA-seq to study the consequences of combinatorial mod-ulation of signaling pathways during early mESC differentiation toward germ layer and mesodermal fates.
2.1.2
Contributions
Conceptualization, Methodology, Writing – Original Draft and Writing – Reviewing and Editing: G.Y. (Grace Hui Ting Yeo), D.K.G. (David K. Gifford) and R.I.S. (Rich
Sherwood); Software, Formal Analysis and Visualization: G.Y. and R.I.S.; Investiga-tion and ValidaInvestiga-tion: L.L. (Lin Lin), C.Y.Q. (Celine Yueyue Qi), M.C. (Minsun Cha), and R.I.S.; Funding Acquisition and Supervision: D.K.G. and R.I.S.
2.2
Introduction
Embryonic stem cells (ESCs) can be directed to differentiate into a variety of valu-able cell types for disease modeling, drug screening, and regenerative medicine via the precise combinatorial and temporal manipulation of a relatively small set of inter-cellular signaling pathways [23, 126]. While many protocols have been developed to direct the differentiation of ESCs into a variety of cell types using lessons learned from embryonic patterning of those cell types, many cell types of therapeutic value are in-accessible because the appropriate spatiotemporal combination of signaling pathways involved in specifying them has not been elucidated.
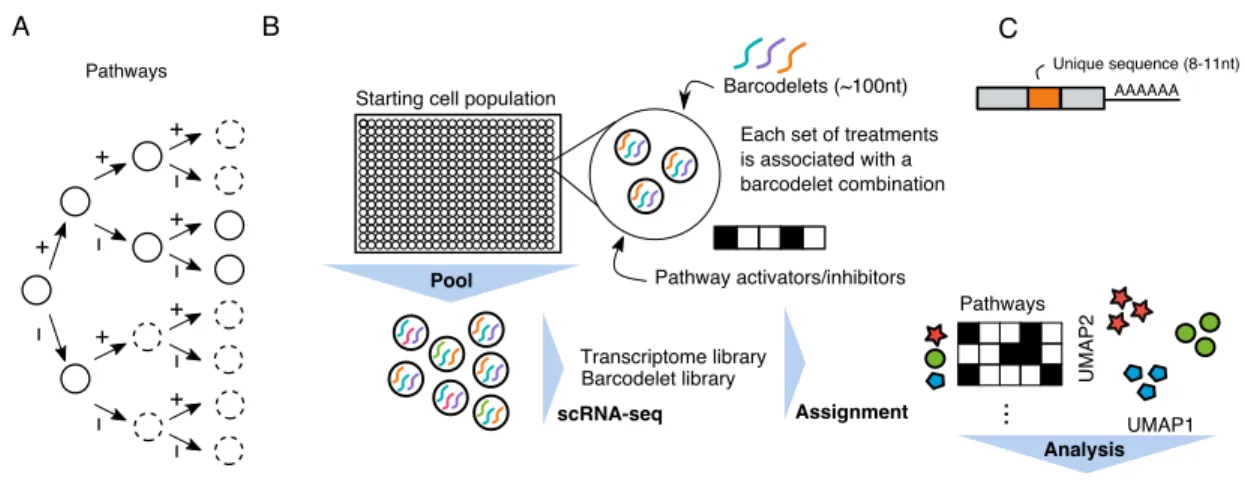
Current methods for discovering protocols to differentiate cells into a desired state are highly empirical. If ESC differentiation, like embryonic cell fate determination, is represented as a progressively branching lineage tree, current approaches collect de-tailed data on specific branching paths while leaving most branches unstudied (Figure
2-2A). We hypothesize that a systematic cataloging of the gene expression effects of each path through a lineage tree would aid our understanding of what cell types arise from alternative conditions.
To address our hypothesis, we developed barcodelet single-cell RNA-sequencing (barRNA-seq) to systematically examine an entire lineage tree defined by the combi-national modulation of signaling pathways. In barRNA-seq, barcodelets are simply added to a treatment condition, become durably associated with individual cells, and appear as unique messages in scRNA-seq data (Figure2-2B-C). We apply our assay to study the consequences of the combinatorial modulation of signaling pathways during early mESC differentiation toward germ layer and mesodermal fates.
We chose to study mESC differentiation toward germ layer and mesodermal fates because it faithfully models in vivo germ layer specification and patterning, for which
+ − + − + − + − + − + − + − Pathways A B AAAAAA Unique sequence (8-11nt) C
Starting cell population Barcodelets (~100nt)
Transcriptome library Barcodelet library UMAP1 UMAP 2 ... Pathways Pool scRNA-seq Assignment
Each set of treatments is associated with a barcodelet combination
Pathway activators/inhibitors
Analysis
Figure 2-2: barRNA-seq enables combinations of a set of treatments to be observed in a single highly-multiplexed experiment. (A) Cell fate determina-tion depicted as a decision tree. Circles in dashed lines depict unexplored branches. (B) Schematic of barRNA-seq experiment. Cells are treated with a set of activators and inhibitors targeting pathways of interest, and transfected with a combination of barcodelets associated with the set of treatments they observed. Cells are subse-quently pooled for scRNA-seq. Barcodelets are readily observed in scRNA-seq, and can then be used to assign a treatment group to each cell (C) Schematic of barcodelet. Barcodelets are small RNA molecules containing adapter sequences, a variable bar-code, an RT-qPCR primer and a polyA tail for oligo-dT binding
there is a wealth of existing gene expression data available. The emergence of droplet-based single cell RNA sequencing (scRNA-seq) [70, 88] has allowed developmental biologists to produce atlases of gene expression at different stages of mouse embryonic development [59, 103].
Combinatorial modulation of signaling pathways has been shown to govern de-velopmental transitions [81, 82, 28]: Wnt and Tgf𝛽 signals are vital in specification of mesendoderm, which is further specified to endoderm and mesoderm by Tgf𝛽 and Bmp signals. Anterior-posterior axial patterning is accomplished primarily through Wnt, Fgf and retinoic acid (RA) signaling inputs, dorsal-ventral specification is pri-marily influenced by Bmp and Shh signaling, and left-right axis determination in-stigated by Notch and Tgf𝛽 signaling [94]. The complex interplay of these seven signaling pathways have been implicated in development of all germ layers and axes. Nonetheless, a comprehensive view of how signaling inputs combine to modulate cell fate is still lacking.
One reason for the lack of comprehensive understanding of combinatorial signaling input is the lack of suitably high-throughput approaches to measure their transcrip-tional consequences. Bulk transcriptomic approaches have been hampered by high cost and effort per sample. Droplet-based scRNA-seq has primarily been used to map diversity in unmanipulated samples, but has more recently been used to multiplex a large number of samples together in a single experiment (Adamson et al., 2016; Dixit et al., 2016; Jaitin et al., 2016; Kang et al., 2018). Recently, methods complementary to barRNA-Seq have been developed to barcode cells by treatment condition prior to scRNA-seq (Shin et al., 2019; Stoeckius et al., 2017), but thus far these methods have not been applied to systematic dissection of stem cell differentiation.
We use barRNA-Seq to measure transcriptome-wide expression in 32 to 384 dis-tinct populations per experiment at single cell resolution. We systematically explore the combinatorial effects of activation/inhibition of up to seven signaling pathways during ESC germ layer patterning. We start by showing that the expression of an underappreciated fraction of genes are dependent on the combinatorial activation and inhibition of these signaling pathways. We probe the mechanistic basis of combina-torial signaling control of individual gene expression by the functional evaluation of individual enhancers, identifying individual promoters and promoter/enhancer pairs that carry out combinatorial gene regulation. We develop an analysis framework that identifies treatment combinations associated with distinct expression states via both a supervised approach that leverages a reference atlas to score our in vitro cells, as well as an unsupervised approach that relies only on the assay data. We show how this data-driven framework enables us to propose specific combinatorial signaling logics that give rise to well-defined cell types by then using it to guide differentiation of a Foxa2+ notochord-like cell population. Altogether, this work highlights the promise of highly multiplexed scRNA-seq in elucidating the drivers of stem cell differentiation.
2.3
Results
2.3.1
Barcodelet scRNA-seq enables the observation of
hun-dreds of treatment conditions in a single highly-multiplexed
experiment
To simultaneously record scRNA-seq measurements for hundreds of populations in a single experiment, we developed a barcoding method compatible with oligo(dT)-based reverse transcription. We performed in vitro transcription to produce 100 nt RNA molecules we call barcodelets composed of an Illumina sequencing adapter sequence, a variable 8-11 nt condition-specific barcode, a primer sequence for RT-qPCR quantification, and a 28 nt poly-adenine stretch for oligo(dT) binding (Figure
2-2C). We tested several RNA transfection approaches to introduce barcodelets into cells, identifying TransIT-mRNA to be optimal for high-efficiency RNA integration into cells (Figure A-1A). We found the survival and gene expression of mouse ESCs (mESCs) and their derivatives to be unaffected by RNA transfection up to 72 hours post-transfection, with no detectable differential expression (<= 1 gene differentially expressed at corrected p < 0.01, Figure A-1B-C). Cellular populations are labeled with a unique combination of 2-5 distinct barcodelet species. The combinatorial complexity of this labeling strategy allows the theoretical disambiguation of hundreds of thousands of populations per experiment.
We perform single-cell RNA-seq using 10X Chromium droplet-based scRNA-seq and produce a cDNA library from all of the cells in a single experiment [163]. We divide cDNA molecules that include 10x Chromium cell barcodes (separate from our condition barcodelets) into separate short cDNA (<500-bp) and long cDNA (>500-bp) pools. Barcodelet cDNA is 170-180-bp long, and so we perform barcodelet-specific library preparation on the short pool and transcriptome library preparation on the long pool. This separation is crucial since barcodelets are present at extremely high levels that would swamp out transcriptome reads if prepared together. Cell barcodes allow for the association of barcodelets with their associated transcriptome reads. For
our experiments we collected > 4 × 10⁸ transcriptome reads and > 1 × 10⁷ barcodelet reads per experiment.
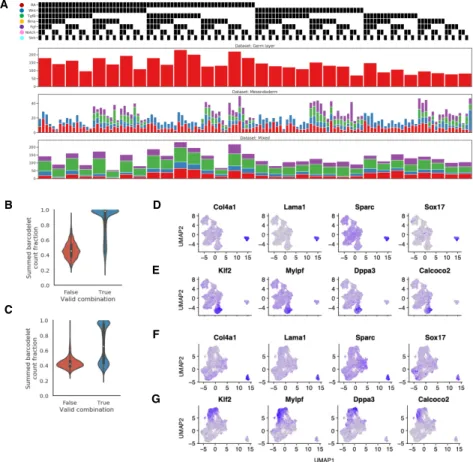
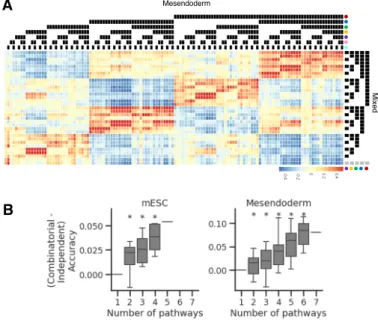
We first applied barRNA-seq to systematically discover signaling pathway interac-tions during mESC germ layer specification. Epiblast-stage mESCs were divided into 32 treatment groups comprising every combination of activation or inhibition of five key developmental signaling pathways: Wnt, retinoic acid (RA), Tgf𝛽, Bmp, and Fgf. Activators comprised a mix of growth factors and small molecule agonists, inhibitors were all small molecule antagonists, and all activators and inhibitors were dosed at concentrations predetermined to be active. While serum is used during differentia-tion, which has been shown to enable endogenous activation of signaling pathways [162], the use of small molecule inhibitors that function intracellularly should effec-tively prevent such signaling. The 32 populations were each transfected with a unique combination of 5 of 10 unique barcodelet species, each corresponding to either the activator or inhibitor of a pathway (Figure 2-3A). Populations were then pooled for 10X Chromium droplet-based scRNA-seq. We refer to this dataset as the germ layer dataset.
To assign each cell a treatment combination, we inspect the top barcodelets in the data. We note that since each of the 32 treatment conditions is specified by a combi-nation of 5 from a pool of 10 possible barcodelet species, only 12% of combicombi-nations would be valid. In this germ layer dataset, we observe that the most abundant bar-codelets in 75.6% of cells cells form a valid combination (Figure 2-3B). Furthermore, cells in which the top barcodelets form a valid combination have a higher summed barcode count fraction over the most abundant barcodelets than cells in which the top barcodelets do not form a valid combination (Figure 2-3B, 2-4B-C). Hence, by thresholding on the summed barcode count fraction, we are able to control the false positive rate of our assignments. To ensure the fidelity of our labeling system for downstream analysis, we choose a strict false positive rate of 1%, which allowed us to assign 6369, or 68.2% of cells in which at least 10 barcodelet UMIs were observed (Figure 2-3D), with a median of 131 cells in each group.
A
B
C
Dataset: Germ layer 5 pathways, 32 conditions
Starting state: mESC
4350 cells (68.2%*)
6369 cells (75.6%)
Dataset: Mesendoderm 7 pathways, 128 conditions, 2-4 replicates
Starting state: Mesendoderm 2899 cells (42.6%*)
6800 cells (53.2%)
Dataset: Mixed
5 pathways + Control, 144 conditions, 2-4 replicates Starting state: mESC and Mesendoderm
4869 cells (81.9%*)
5943 cells (99.9%) >10 barcodelet UMIs observed
Valid barcodelet combination Assignment at 1% FPR D
False True
Valid com binat ion
0.0 0.2 0.4 0.6 0.8 1.0 S u m m e d b a rc o d e le t co u n t fr a ct io n V a lid + -R A In v a lid + -W n t + -Tg fB + -B m p + -F g f
Barcodelet count fract ion
−4 0 4 8 −5 0 5 10 15 mESC −5 0 5 −5 0 5 10 15 Mesendoderm UMAP1 UMAP2 −4 0 4 8 −5 0 5 10 15 mESC −5 0 5 −5 0 5 10 15 Mesendoderm UMAP1 UMAP2
Figure 2-3: Barcodelets enable assignment of treatment combinations to single cells. (A) Barcodelet count fraction in germ layer dataset. Cells are grouped based on the whether the top 5 most abundant barcodelets form a valid combination (B) Distribution of summed barcodelet count fraction of top 5 most abundant bar-codelets in germ layer dataset, grouped by whether or not the top 5 most abundant barcodelets form a valid combination (C) UMAP visualization of cells collected at each starting point (top: mESC, bottom: mesendoderm). Cells are colored according to source dataset (left) and whether they were control cells (right) (D) Summary of datasets. Asterisks indicate percentages reported with respect to cells in which >10 barcodelet UMIs were observed
events by starting with a population of already differentiated cells. We hence ap-plied barRNA-seq to mesendodermal cells. To produce these anterior primitive streak mesendodermal cells, epiblast-stage cells were treated for 24 hours with agonists of Wnt, Tgf𝛽, and Fgf and inhibitors of RA and Bmp. As has been shown [82], we find that co-activation of Wnt, Tgf𝛽, and Fgf supports maximal induction of primi-tive streak mesendoderm genes T, Mixl1, and Mesp1, and inhibition of Bmp biases toward anterior primitive streak with maximal expression of Gsc and Eomes. We then exposed these anterior primitive streak mesendodermal cells to all combinations of activation or inhibition of seven pathways, adding Hedgehog and Notch pathways to the previous five pathways. This setup yielded 128 unique combinatorial treat-ments, which were performed with 2-4 biological replicates to yield a median of 21 cells for 384 unique populations (Figure 2-3D, 2-4A). We refer to this dataset as the mesendoderm dataset.
Finally, to enable us to assess replicate consistency and to boost power for down-stream analysis, we repeated the experiment with both starting states using the 5 original pathways assayed in the germ layer dataset, for a median of 64 cells across 144 conditions with 2-4 biological replicates. This dataset also includes cells which received no treatments, which we refer to as control cells. We refer to this dataset as the mixed dataset (Figure 2-3D, 2-4A).
Expression data for each dataset was first processed individually (see 2.5.2), and then cells corresponding to each starting state (mESC, mesendoderm) were combined for downstream analysis and visualization (Figure2-3C,2-4A). In addition, we further filtered transcriptomic outgroups of extraembryonic endoderm (ExEn) using a semi-supervised, smoothed clustering approach initialized with known gene markers. ExEn cells are known to arise from aberrant differentiation of ESCs, and they comprise 4-5% of cells in all treatment groups, largely independent of treatment. The ExEN outgroup is highly transcriptionally distinct (Figure 2-4D-G), and hence removing them reduces noise in downstream analyses. We note that in bulk transcriptomic approaches, confounding populations cannot be accounted for in analysis.
A D E F G B C
Figure 2-4: Summary of datasets collected. (A) Number of cells collected per treatment condition across datasets. Different colors correspond to different replicates multiplexed within the same dataset (B, C) Distribution of summed barcodelet count fraction of top 3 most abundant barcodelets in mesendoderm dataset (B) and mixed dataset (C), grouped by whether or not the top 3 most abundant barcodelets from a valid combination (D, F) Expression of known ExEN gene markers for mESC (D) and mesendoderm (F) starting states (E, G) Expression of known mESC gene markers for mESC (E) and mesendoderm (G) starting states
2.3.2
Combinatorial treatments induce specific and consistent
expression profiles
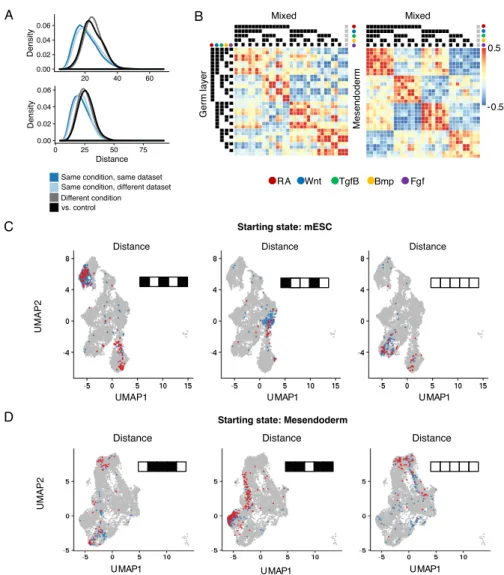
We first performed two internal validation checks to assess if barcodelets have correctly labeled the cells with the treatments they observed. First, we hypothesized that cells assigned the same treatment group should be closer in expression space than cells assigned different treatment groups. We observe this to be the case both when comparing the expression distance in PCA space between pairs of cells receiving the same/different sets of treatments across datasets (Figure 2-5A, Mann-Whitney p-value « 0.01), and by visualizing the cells from each dataset using UMAP (Figure
2-5C-D, S2). Cells that received the same treatment combination are also more likely to be closer in expression space even if they are from different datasets, and there is strong correlation of aggregated expression profiles across datasets, suggesting good replicate consistency (Figure 2-5B, 2-6A).
Secondly, we hypothesized that gene expression should be strongly predictive of the activation/inhibition status of each individual signaling pathway. To test this, we trained logistic regression models to predict the signaling status of each pathway given gene expression. Our classifiers mostly achieved excellent classification performance in a held-out test set (median AUROC = 0.957 for mESC, 0.955 for mesendoderm) (Table 2.1). The lower performance of Notch and Shh models may be because their effects on gene expression are not as readily observed except in combination with other pathways. We examined the genes with the highest positive coefficients for each classifier, and found that genes were consistent between the two starting states, and that many have previously been described to be downstream of these pathways (Table
2.1). This includes several well-known targets of Wnt signaling such as Cdx1, Cdx2, Lef1, Wnt6, and Axin2 [125], as well as Id1, Id2, and Id3, which have previously been shown to be downstream effectors of Bmp signaling [57]. We note that even for Notch and Shh, the genes with highest positive coefficients are Nrarp and Ptch1, which are known feedback inhibitors of the respective pathways ([76]; [137]). Altogether, these results indicate that barRNA-seq allows accurate labeling of multiplexed populations
Mixed Mixed Germ laye r Mesend oderm 0.5 -0.5 RA Wnt TgfB Bmp Fgf UMAP 2 UMAP1 UMAP1 UMAP1 Distance Distance
Starting state: mESC
Distance Distance
UMAP
2
UMAP1 UMAP1 UMAP1
Starting state: Mesendoderm
Distance Distance Distance
B C D A 0.00 0.02 0.04 0.06 20 40 60 Density 0.00 0.02 0.04 0.06 0 25 50 75 Distance Density 0.00 0.02 0.04 0.06 20 40 60 80 Distance Density
Same condition, same dataset Same condition, different dataset Different condition vs. control 0.00 0.02 0.04 0 25 50 75 Distance Density
Figure 2-5: Combinatorial treatments induce specific and consistent expres-sion profiles.(A) Distribution of distances between pairs of cells across conditions and datasets. Distance is computed as Euclidean distance in PCA space. Distances between cells within the same condition are significantly smaller than distances be-tween cells from different conditions, and bebe-tween treatment and control cells (Mann-Whitney p-value « 0.01) (B) Heatmap depicting correlation of mean expression pro-files for cells assigned to each treatment combination across datasets. The last column (indicated by grey circles) corresponds to control cells (C, D) Visualization of cells assigned to a few treatment groups for both starting states (mESC: RA+Wnt-Tgf𝛽-Bmp-Fgf-). UMAP visualization of cells assigned to that treatment condition, colored by dataset
Starting state: mESC Mesendoderm
RA Wnt TgfB Bmp Fgf RA Wnt TgfB Bmp Fgf Notch Shh
AUROC 0.966 0.957 0.953 0.962 0.897 0.965 0.95 0.946 0.944 0.851 0.674 0.689 1 Mdk Grsf1 Lefty2 Id1 S100a6 Mdk Cdx1 Lefty2 Id1 S100a6 Nrarp Ptch1 2 Rbp1 Cdx1 Pycr2 Id3 Etv4 Cdx1 Grsf1 Pmepa1 Id3 Lgals1 Slc25a4 Dleu7 3 Str8 Wnt6 Pitx2 Dusp9 Lgals1 Rbp1 Axin2 Smad7 Id2 Tmsb4x Gbp3 Ntng1 4 Hotairm1 Lef1 Lefty1 Id2 Tmsb4x Cyp26a1 Gfgbp3 Lefty1 Tbx3 Etv4 Hspa8 Cd24a 5 Hoxa1 Cdx2 Pmepa1 Tbx3 Utf1 Fgfbp3 Sp5 S100a10 Smad7 Ldha Lyar Myh10 6 Cdx1 Fgfbp3 S100a10 Msx2 Mest Nrip1 Notum Dppa5a Msx2 Arpc1b Mum1l1 Gm10116 7 Crabp2 Axin2 Sfn Smad7 Dusp4 Aes Tcg7 Pitx2 Dusp9 Perp Hmmr Slc23a2 8 Rarb Pdgfa Igfbp2 Bambi Peg10 Nr6a1 Hsp90ab1 Spsb1 Smad6 Spry2 Tpi1 Rpl22l1 9 Csn3 Sp5 Taok3 Sct Dusp6 Dhrs3 Sccpdh Pycr2 Sct Peg10 Hk2 Smad6 10 Cotl1 1700097N02Rik Tdgf1 Rnf128 Gng3 Hoxa1 Lad1 Taok3 Msx1 Tcf15 Rock2 Pdk1
Table 2.1: Gene expression is strongly predictive of pathway status. Table showing results on pathway status classification task. In addition to AUROC, top 10 genes ranked by coefficient are shown.
derived from combinatorial signaling treatment of germ-layer mESC.
To check if gene expression is also predictive of combinatorial pathway activation,
A M ixe d Mesendoderm B
Figure 2-6: Model accuracy is higher when predicting combinatorial path-way status. (A) Heatmap depicting correlation of mean expression profiles for cells starting at the mesendoderm stage assigned to each treatment combination. The last column (indicated by grey circles) corresponds to control cells. Legend colors are as in Figure 2-4(A) (B) Difference in model accuracy on randomly-held out test set with increasing number of pathways when predicting combinatorial pathway status vs. each pathway independently. * indicates bonferonni-corrected p-value for paired t-test < 0.05
we also fit logistic regression models using 5-fold cross-validation on a training set consisting of 80% of the data to predict combinatorial pathway status (multi-task) for increasing numbers of pathways. This is in contrast to when each pathway is predicted independently (multi-label). For a given number of pathways, difference in model accuracy was then assessed for the randomly held-out test sets (remaining 20%) via paired t-test. We found that model accuracy is consistently higher when predicting combinatorial pathway status than predicting pathway independently, suggesting that combinatorial gene expression effects are present in our data (Figure 2-6B).
2.3.3
A regression analysis framework identifies combinatorial
interactions in signaling pathways
Inspection of the mean gene expression within each treatment condition highlights complex interactions between pathways in regulating gene expression (Figure 2-7A). To assess in a principled manner the extent to which genes are under combinato-rial control of these signaling pathways, we developed a Bayesian regression analysis framework to identify the effects of these pathways on the top 2000 most variable genes within the barRNA-seq dataset. Scaled normalized expression of each gene was modeled as arising from a normal distribution, with the mean dependent on the treatments that each cell had received. For each gene, we compared the fit of models that included varying orders of interaction terms to determine optimal model complexity. To provide a conservative estimate as to the extent as to which genes are under combinatorial control in our data, we defined the optimal model to be the model with the lowest complexity that has a model score within the 95% confidence interval of the best model score (See 2.5.4). Of these top 2000 most variable genes, we found that the optimal model for 60% of genes include second-order and higher terms, suggesting that the majority of differentially expressed embryonic genes are under combinatorial signaling control. (Figure 2-7C)
Focusing first on cells starting in the mESC state, our results not only recapitulate known linear and combinatorial pathway effects, but also uncover genes whose
expres-Bm p Fgf
Cdx2 Hoxa1 Left y1 Mest
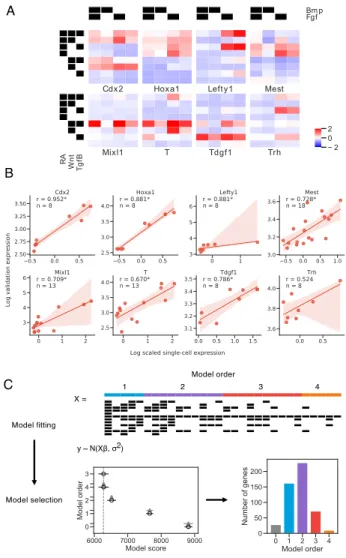
R A W n t Tg fB Mixl1 T Tdgf1 Trh − 2 0 2 A X = Model fitting Model selection Model order 1 2 3 4 y ~ N(Xβ, σ2) B C
Figure 2-7: Gene expression at the germ layer stage requires highly complex interactions between signaling pathways. (A) Mean scaled gene expression of genes chosen for validation of cells that observed different treatment combinations (B) Correlation of average scRNA-seq expression with GFP expression for reporter cell lines. Spearman rank correlation coefficient is reported for each gene and is significant at p < 0.05 for all genes except Trh. 95% confidence intervals are estimated via bootstrap (n = 1000). (C) Schematic of Bayesian regression analysis framework. Model fitting: X is a covariate matrix with order of each term annotated above. Black indicates 1. Models are fit with varying orders of terms included. Model comparison: Model comparison plot for an example gene, with model order on the y-axis and estimate of model fit on the x-axis. The vertical grey-dashed line indicates the score of the best model fit. Empty circles indicate the mean score of that model, black horizontal lines indicate the standard deviation of the score, and grey horizontal lines indicates the standard deviation of the difference between the score of that model and the best model. (See 2.5.4) Lower scores imply a better model fit.
sion requires previously unknown combinatorial signaling at the germ layer stage. For example, Lefty1 is known to be a Tgf𝛽 target gene [8], and we do find that activation of Tgf𝛽 increases Lefty1 expression. However, we find that Lefty1 expression is greatly increased when RA and Tgf𝛽 are co-activated, and that Bmp activation ablates this effect. Hence, RA+Tgf𝛽+Bmp- conditions induce highest Lefty1 expression. Exam-ples of other genes include: Hoxa1, a canonical RA-induced gene [129], which we find to be also dependent on Wnt and Fgf input, and Mixl1, a mesendoderm-specific gene [51] which we find to depend on the appropriate combinatorial input of four signaling pathways (Figure 2-7A, 2-8A-B).
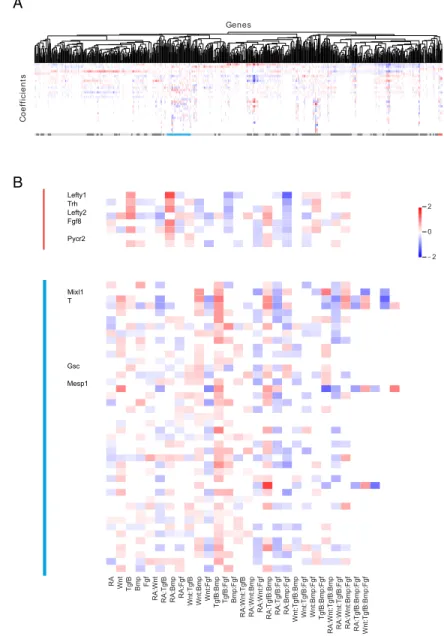
To discover genes sharing similar regulatory logic, we clustered genes by their optimal model coefficients using correlation as the distance metric (see 2.5.4), and found that sets of genes share the same combinatorial regulation profile (Figure 2-9D). For example, Lefty1, Lefty2, and Pycr2, which lie in a contiguous stretch on chromosome 1, all share a combinatorial regulatory pattern that favors high expres-sion in RA+Tgf𝛽+Bmp- conditions (Figure2-7A, 3D). Several other genes that are in distinct chromosomal locations, including Fgf8 and Trh, share a highly similar combi-natorial regulatory logic. Genes with similar combicombi-natorial regulatory logic to Mixl1 (high expression in RA-Wnt+Tgf𝛽+Fgf+ conditions, (Figure2-7A) include additional key mesendodermal genes such as T, Gsc, and Mesp1. (Figure 2-9E).
To validate the highly combinatorial regulation of some of these developmen-tal genes we monitored the expression of eight genes (Cdx2, Hoxa1, Lefty1, Mest, Mixl1, T, Tdgf1, Trh) by constructing corresponding GFP knock-in reporter cell lines through CRISPR/Cas9-based homology-directed repair [5]. We compared av-erage scRNA-seq expression among cells in each combinatorial treatment condition with GFP expression in the GFP cell lines and find strong concordance (Figure2-7B). Analysis of these GFP reporter cell lines reveals that, in optimal inductive conditions, the vast majority (64.9-97.6%) of cells display above-control transgene fluorescence for Brachyury, Hoxa1, and Lefty1 (Fig. S3G-I), suggesting that differentiation is rel-atively uniform. This suggests that barRNA-seq can reliably detect combinatorial control of these genes without laborious experiments investigating each gene
individ-A
B
Figure 2-8: Bayesian model regression analysis of genes in cells starting at the mESC stage. (A) Model comparisons for validation genes. Empty circles indicate the mean score of that model, black horizontal lines indicate the standard deviation of the score, and grey horizontal lines indicates the standard deviation of the difference between the score of that model and the best model. Lower scores imply a better model fit. (B) 95% credible intervals on coefficients for optimal models
RA Wnt TgfB Bmp Fgf RA:Wnt RA:TgfB RA:Bm
p RA:Fgf Wnt:TgfB Wnt:Bmp Wnt:Fgf TgfB:B mp TgfB:Fgf Bmp:F gf
RA:Wnt:TgfB RA:Wnt:Bmp RA:Wnt:Fgf RA:TgfB:
Bmp RA:TgfB: Fgf RA:Bmp:F gf Wnt:TgfB:Bmp Wnt:TgfB:Fgf Wnt:Bmp:Fgf TgfB:Bmp :Fgf RA:Wnt:Tgf B:Bmp RA:Wnt:TgfB:Fgf RA:Wnt:Bmp: Fgf RA:TgfB:Bmp: Fgf Wnt:TgfB:B mp:Fgf −2 0 2 Lefty1 Trh Lefty2 Fgf8 Pycr2 Mixl1 T Gsc Mesp1 A B Genes C o e ff ic ie n ts
Figure 2-9: Clustering reveals genes sharing similar regulatory logic (A) Hi-erarchical clustering of top 2000 most variable genes. Clusters are annotated beneath with alternating dark/light grey. (B) The Lefty1 cluster (red, *) and T/Mixl1 cluster (blue, **) are magnified and relevant genes indicated
ually. Thus, unbiased analysis of barRNA-seq data allows the discovery of hundreds of genes regulated by highly combinatorial signaling logic.
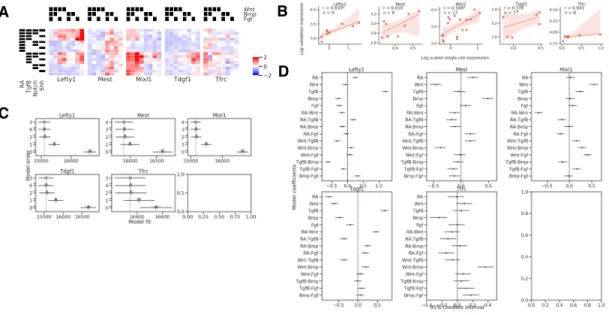
For cells starting in the mesendoderm state, we again observed complex signal-ing interactions (Figure 2-10), and validated the accuracy of the differences in gene expression in barRNA-seq across different treatment conditions by comparing
aver-aged scRNA-seq expression of Lefty1, Mixl1, Mest, Tdgf1 and Tfrc with flow cyto-metric GFP expression (Lefty1, Mixl1, Mest, Tdgf1) or antibody staining (Tfrc) in matched conditions. Again, we found that expression in our validation expression cor-relates with average scRNA-seq expression (Figure2-10B), demonstrating again that barRNA-seq yields faithful gene expression information. However, the correlation is weaker than in the previous experiments, likely as a result of the reduced power from multiplexing a larger number of conditions into a single experiment.
A B
C
D
Figure 2-10: Gene-level analysis of cells starting at the mesendoderm stage. (A) Mean scaled gene expression of genes chosen for validation of cells that observed different treatment conditions (B) Correlation of average scRNA-seq expression with GFP expression for reporter cell lines. Spearman rank correlation coefficient is re-ported for each gene and is significant at p < 0.05 for Lefty1 and Mixl1. 95% confi-dence intervals are estimated via bootstrap (n = 1000). (C) Model comparisons for validation genes. Empty circles indicate the mean score of that model, black hor-izontal lines indicate the standard deviation of the score, and grey horhor-izontal lines indicates the standard deviation of the difference between the score of that model and the best model. Lower scores imply a better model fit. (D) 95% credible intervals on coefficients for optimal models
−10 0 10 −10 −5 0 5 10 15 UMAP1 UMAP2 Reference atlas Model Train Score Barcodelet data Analysis
Rank treatment conditions by mean score, identify cell type markers
Supervised
Per classifier
Unsupervised
Barcodelet data Fit
Clustering
Stability analysis
Analysis
Rank treatment conditions by cluster membership, identify cell type markers
0.25 0.30 0.35 0.40 0.45 −1.0 −0.5 0.0 0.5 1.0 Log2 resolution Stability (NVI) Per cluster
Figure 2-11: Schematic of two approaches for identifying specific different conditions under which cells are driven to particular fates. Left: A supervised approach, using an external atlas to score cells. Right: An unsupervised approach that identifies stable subpopulations
2.3.4
Specific differentiation conditions correspond to in vivo
embryonic cell types
We next turn from gene-level to cell-state level analysis, developing an analysis frame-work for identifying specific differentiation conditions under which cells are driven to particular fates. To do so, we employed two complementary approaches: (1) a super-vised approach, where we used published labeled in vivo data to score our dataset, and (2) an unsupervised approach, where we identified stable subpopulations from our data de novo (Figure2-11A).
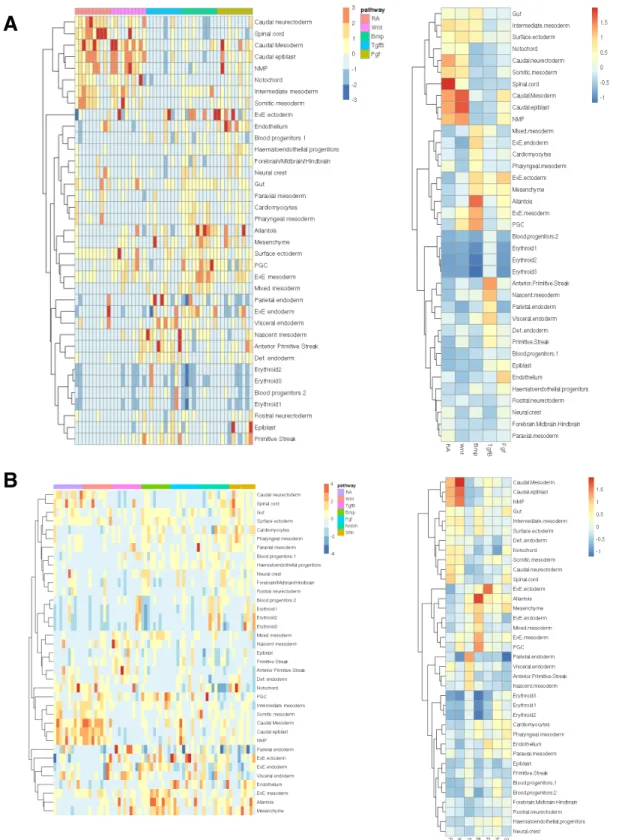
For the supervised approach, we hypothesized that many cell types found in vivo during early development would be present amongst our exhaustive examination of 160 in vitro differentiation conditions. To investigate this, we used a published dataset of single cell RNA-seq profiles of 116,312 cells derived from E6.5 - E8.5 mouse embryos [103]). We first built classifiers for each of the 37 labeled cell types manually annotated in this published dataset. Our classifiers achieved >0.8 accuracy on all subpopulations in held-out test sets. We then used these classifiers to score cells from our experiments and ranked treatment conditions by the mean score in each treatment condition.
Applying this approach to cells starting at the mESC state, we found that spe-cific combinatorial signaling conditions are associated with particular embryonic sub-populations (Figure 2-12). We found that induction of the anterior primitive streak was indeed associated with RA-Wnt+Bmp-Fgf+ conditions, as previously shown [82]. These cells are enriched for mesendodermal T, Mixl1, and Mesp1, and were used as precursors to our mesoderm differentiation experiments.
A B C
Figure 2-12: Specific differentiation conditions starting from mESC corre-spond to known embryonic cell types. (A) Heatmap depicting mean score of each cell type classifier for cells assigned to each treatment combination (B) Distri-bution of classifier scores visualized on the UMAP (C) Expression of gene markers identified for each cell type classifier visualized on the UMAP. Gene markers shown are within the top 20 genes most correlated with the cell type classifier score
We also identified a number of additional embryonic populations associated with specific combinatorial differentiation conditions. For example, induction of annotated neural crest cells was associated most strongly with cells receiving inhibition of Wnt,