HAL Id: hal-01510195
https://hal.archives-ouvertes.fr/hal-01510195
Submitted on 12 Oct 2017
HAL is a multi-disciplinary open access
archive for the deposit and dissemination of
sci-entific research documents, whether they are
pub-lished or not. The documents may come from
teaching and research institutions in France or
abroad, or from public or private research centers.
L’archive ouverte pluridisciplinaire HAL, est
destinée au dépôt et à la diffusion de documents
scientifiques de niveau recherche, publiés ou non,
émanant des établissements d’enseignement et de
recherche français ou étrangers, des laboratoires
publics ou privés.
Perceptual interference between regional accent and
voice/speech disorders
Alain Ghio, Médéric Gasquet-Cyrus, Juliette Roquel, Antoine Giovanni
To cite this version:
Alain Ghio, Médéric Gasquet-Cyrus, Juliette Roquel, Antoine Giovanni. Perceptual interference
be-tween regional accent and voice/speech disorders. Interspeech 2013 14thAnnual Conference of the
International Speech Communication Association, Aug 2013, Lyon, France. pp.2138-2142.
�hal-01510195�
Perceptual interference between regional accent and voice/speech disorders
Alain Ghio, Médéric Gasquet-Cyrus, Juliette Roquel, Antoine Giovanni
Aix Marseille University, CNRS, Laboratoire Parole et Langage, Aix-en-Provence, France
Abstract
We present a study where we examined the influence of a regional accent in the perception of voice and/or speech disorders. These aspects are most of the time overshadowed in clinical context. This protocol, involving multiple sources of speech variations, is also interesting for perception theories. For the experiment, speakers with or without a Southern French accent and with or without speech/voice disorders were recorded on reading a text. The samples were then randomly played back to two groups of listeners (familiar vs unfamiliar with the regional accent), specialists in speech therapy. The task was the perceptual evaluation of voice quality, articulation disorders and dysprosody. We focused in this paper on the voice dimension. The main results on this part concern the weak influence of regional accent on the perception of moderate or severe dysphonia, where the speech signal is strongly disturbed by the disorder. By contrast, the effect of regional accent is important on normal voices perception: listeners unfamiliar with the regional accent judge speakers with accent without voice disorder as slightly dysphonic. This last result can be interpreted as a form of perceptual interference between different dimensions of speech variations around a central position.
Index Terms: voice disorders, speech disorders, regional
accent, paralinguistic cues, speech perception, sociolinguistics
1. Introduction
1.1. Perceptual assessment of voice/speech disorders
The aim of this study was to examine the influence of a regional accent in the perception of voice and/or speech disorder. Most of the time, patients with such disorders are evaluated perceptually by clinicians who listen to the speaker and judge by ear the specificity and severity of the disorder. For instance, in the case of dysarthria ("speech disorders resulting from disturbances in muscular control… due to damage to the central or peripheral nervous system" [1]), Darley et al. proposed a multidimensional rating scale with 38 items exploring speech dimensions as pitch, loudness, voice quality, nasality, respiration, articulation… Each dimension can be judged with a seven-point scale of severity in which 1 represents normality and 7 represents very severe deviation from normal. In the same way, dysphonia (phonatory disorder) is usually perceptually evaluated with the GRBAS scale of Hirano [2], where G is the degree of hoarseness (or the global severity), R is the grade of roughness, B is the grade of breathiness, A is the overall weakness of voice (asthenicity) and S is the "strained quality”. Each of those dimensions can be graded perceptually from 0 (normal) to 3 (severe disorder). In clinical practice, perceptual assessment is considered the gold standard for rating voice and/or speech disorder. However, although these perceptual scales are the most widespread methods in use today, and although attentive listening makes an undeniable contribution to painting a
complete clinical picture of the patient, the actual utility of these scales as a reliable assessment device is a subject of regular debate. Many studies have found clear evidence of variability in judgments of the same voice made by different listeners, and in judgments made by the same listener at different times [3].
This lack of reliability can be explained by the fact that: - the speech signal transports a flood of very rich and varied information (sounds carry sense, lexical elements, syntactic structure, contextual semantic information, emotional or physiological state of the speaker, social or geographical origin…) from which the clinician must extract the information which relates only to the dysfunction by disregarding other source of information which can be considered, in this task, like noise;
- the task is a judgment of quality including subjective, prescriptive or normative dimensions which is not a linguistic task;
- the cognitive standards of the listener relating to the judgment of quality vary according to extra/paralinguistic processes and from the phonological subsystems specific to each listener.
1.2. Is the perception of voice quality universal?
In a previous study [4], we presented an experiment where voice quality of French and Italian dysphonic speakers was evaluated by French and Italian listeners, specialists in phoniatrics. Results showed that both groups of speakers were perceived in the same way by the two groups of listeners in term of overall severity and breathiness. But the perception of roughness was clearly language dependant. Italian listeners underestimated roughness compare to French listeners, which indicates the language dependency of such perceptual mechanism. These cross-linguistic aspects could be seen as minor from a clinical point of view, except in multilingual countries, but it could reveal more serious issues if we consider other forms of more common variations such as regional variations or sociolinguistic particularities. Moreover, these aspects are most of the time overshadowed in clinical context. It is the reason why we investigated the influence of a regional accent in the perception of voice and/or speech disorder.
1.3. Perceptual interference
A more general question is tackled here: is there a possible perceptual interference between multiple sources of variation in comparison with "standard" position? In our case, the two dimensions are:
- the phonetico-phonological axis with a regional variety of French vs. a considered "standard" variety
- the variation related to the pathological disturbance. Before describing the experimentation, it appears important to reconsider this concept of "standard".
2. The concept of "standard"
2.1. Sociolinguistic aspects
When we evoke regional accents, we are interested in the phonetic and prosodic characteristics which characterize the pronunciation of a speaker of a specific geographical area. This is the phonetician point of view [5]. However, the definition of the accent has a different character for the speaker himself: it takes all his importance in social and identitarian dimension [6] which can be in conflict with some standardization processes.
The concept of linguistic "standards" can be considered with different point of views [7]. A descriptive approach records the observed facts, without hierarchical consideration or value of judgment. For instance, in French, the utterance "j’ai été au
cinema" is often observed and accepted as a variation of "je suis allé au cinéma" ("I went to the cinema"). In contrast,
prescriptive standards give a set of objective rules as a model to follow, as "The" standard. The highlighted forms are generally characterized by a higher frequency of usage in a given social group (elders, upper class…). Most of the scholar books seem to describe the language exhaustively, but they do only for a variety of language which is the written school French in France and prescribe it as the correct way to practice the language. In terms of pronunciation, the situation is quite the same.
Southern French is the French spoken in the south of France. It is more particularly the accent of the South-East which interests us in our study. The phonetic characteristics of this accent compared to a "standard" French are as following [5], [8], [9]:
- Particular nasal vowels
- The quasi-systematic realization of "schwas"
- The opposition between semi closed and semi opened vowels (/e/ vs / /, /o/ vs / /) follow a position law - The reduction of the complex consonant clusters - A prosodic specificity
2.2. Regional accents, speech therapy and standards
In France, recent sociolinguistic studies have demonstrated the existence of actual discriminations due to the perception of accents, whether foreign [10][11] or regional. Gasquet-Cyrus [12] has collected discourses and facts of discriminations among journalists, actors, singers and other people with several varieties of Southern French, all involved in jobs where the voice is of crucial importance.
Concerning the aspects of accents or dialects variation, the American Speech-Language-Hearing Association (ASHA) has published some recommendations in order not to discriminate professional speaking nonstandard linguistic varieties [13]. Authors reported that "Many educational programs have discouraged speakers of certain nonstandard linguistic varieties from majoring in communication sciences and disorders. Other programs have not permitted or have restricted clinical practicum experiences for students who speak [certain] nonstandard linguistic varieties of English." Cheng [14] "presents a discussion of some of the fundamentals surrounding accent: it seeks a macrodefinition of accent, proposes a paradigm shift, and provides some clinical suggestions for moving beyond accent." This discussion had an echo in France where Rozenn tackled ethical questions for professionals in speech and voice therapy [15]:
"Should we accept to modify the accents of speakers who practice the dialects the least highlighted (afro-American for example). It is not a question of rehabilitation within the framework of pathologies but only of purely normative step…" The author continue then the discussion by tackling the question about patients with speech disorders: "To what extent an accent can interfere with the effectiveness of the professional practice? Which are the minimal conditions of standard correction in the exercise of assessment and occupational functions? Do we need speech therapists culturally various to work near the similar populations and which is the relevance of their exercise near the standard population?"
An excellent observation showing the complexity of the question is the study of Foulkes & Docherty [16]. They report the case of labiodentalisation of /r/ in English, which was stigmatized twenty years ago as "an infantilism, or indicative of affected or disordered speech" but which is now considered as an accent feature of non-standard south-eastern accents.
3. Perception of unfamiliar accent
3.1. Impact of a foreign accent on speech perception
In a psycholinguistic approach, Munro and Derwing [17] studied the impact of a foreign accent on the semantic and syntactic processing in a sentence verification task. The main result was that the judgment of the truth requires more time when the sentence is pronounced with a foreign accent (Chinese speaking English) compared to native speakers. In the same way, Schmid and Yeni-Komshian [18] presented to American listeners sentences produced by native and non native speakers, containing or not intentional mis-pronunciations. The results showed that the subjects detected better the errors in the sentences produced by the native speakers. The authors conclude that the processing of a foreign accent had a cognitive cost due to the intervention of top-down mechanisms, similar to those in the phonemic restoration [19].
3.2. Impact of a regional accent on speech perception
Different studies highlighted the impact that the internal phonological variation in the speaker's language could have on the spoken communication and especially in perception [20], [21]. In the study of Floccia et al.[22], authors highlighted the existence of a delay of identification for words placed at the end of sentences when those were produced in a unfamiliar accent for the listener. In [23], the same authors showed that the presence of a unfamiliarregional accent disturbs the perceptual mechanism of lexical identification when the utterances are long enough (17 to 19 syllables). Indeed, a robust effect of the familiar regional accent, which increases according to the length of the sentences, was observed. These facts suggest that the adaptation process to the regional accent requires a mechanism of short-term adjustment, which requires a certain quantity of information to be effective, and which disturbs the speech processing temporarily.
In the present study, we examined the influence of a regional accent in the perception of voice and/or speech disorder. This protocol, involving multiple sources of speech variations, is interesting in a clinical context but also for perception theories.
4. Material and methods
4.1. Corpus
We selected a first set of 40 speakers reading a text from the Aix-Marseille pathological speech database [24]. This set of data was composed of
- Dysphonic speakers recorded in the ENT Department of the Timone University Hospital in Marseille, France. - Dysarthric speakers recorded in the Neurology
Department of the Aix-en-Provence Hospital, France. - Healthy speakers recorded in the same condition than the
previous ones
Half of the data was initially labeled as South East French Accent speakers (SEAcc), half of the data were selected as neutral French accent (NAcc). To validate the categorization of the accent, we asked 6 listeners familiar with the South East French Accent to listen to the recordings and to categorize the speaker on a binary decision (SEAcc vs NAcc). We keep only samples where 5 or 6 listeners agreed on this categorization. The corpus was finally composed by:
- 10 healthy speakers
- 10 dysphonic speakers (5 nodules/polyps, 2 laryngeal paralysis, 2 sulcus, 1 Reinke's oedema)
- 10 dysarthirc speakers (6 Parkinson' disease, 1 parkinsonian syndrome, 1 stroke, 1 cerebellar, 1 Amyotrophic lateral sclerosis )
Each of this subgroup was composed by 5 SEAcc + 5 NAcc.
4.2. Listeners and perception task
The 11 participants in the perception test were all specialists in voice therapy (ENT, phoniatricians, speech therapists). 4 listeners were familiar with SEAcc (Marseille) and 7 were not familiar with SEacc (Lyon, Paris, Besançon).
The task was the perceptual evaluation of the disorders using a 4 dimensions scale (phonation, articulation, nasality and prosody). For each trial, the participant listened to the sample (several times if he wanted). For each dimension, the listener gave a note: 0 if normal, 1 if slightly impaired, 2 if moderately impaired, 3 if extremely impaired. All participants were familiar with this task similar to the ones described in § 1.1. The test was individual. The trial order was randomized. A training phase was proposed in order to familiarize each participant to the experimental environment.
5. Results
5.1. Data processing
For the statistical analysis, we used ‘R’ software version 2.14 (www.r-project.org). For the statistical analysis, we considered a value significant when p < 0.05. Results are based on 11 listeners * 30 speakers * 4 dimensions = 1320 perceptual tests. It is well known that in this kind of perceptual assessment, an important variability inter listeners is observed [3]. In order to evaluate this variability inside each group of listeners, we measured the intra-class correlation coefficient (ICC) which represents agreements between several raters on the same set of subjects [25].
The main aspect that we wanted to observe was the effect of the speaker accent on listeners depending on the listener's group : familiar listener (FAL) vs non familiar (NFL). In order to obtain a robust and reliable measure per sample and per group of listeners, we have explored 3 possibilities: the mode, the mean and the median. Modal value is the most frequent
value on a set of data, which is a sort of filtering by majority vote (ex: 0 0 0 1 1 0 => 0). It is similar to the well-known consensus method and has been used in [4] and [26]. But our set of data was sometimes very heterogeneous. For instance, for the speaker n°20, the individual results for NFL group was 1 3 2 3 3 2 1, which gives 3 as the modal value which appears as non reliable on such a set. The second solution was the mean but it is well-known in statistics that such method is sensitive to outliers. We finally use the median value because it appears as the most representative of the group in the judgment of a sample. In the previous example, the set {1 3 2 3 3 2 1} ordered as {1 1 2 2 3 3 3} provides a median value of 2 more representative than the modal value 3. We call "score" the median value of each group.
5.2. Phonatory disorders
We present in this section the results relative to the perception of phonatory disorder.
In term of intra-class correlation, NFL group is less coherent than FAL group (Table 1). We can explain this result by the fact that FAL listeners all belong to the same hospital (Timone, Marseille) and the professional proximity has allowed a more uniform way to judge a voice disorder (shared knowledge). On the contrary, NFL is composed of isolated specialists scattered across several towns in France (Paris, Lyon, Besançon) with probably non uniform common ground. This effect is intensified on speakers with a unfamiliaraccent.
Table 1. Intra-class correlations for phonatory
disorder perception
Familiar Listeners Non Familiar
SEacc speakers 0.71 0.51
NAcc speakers 0.71 0.55
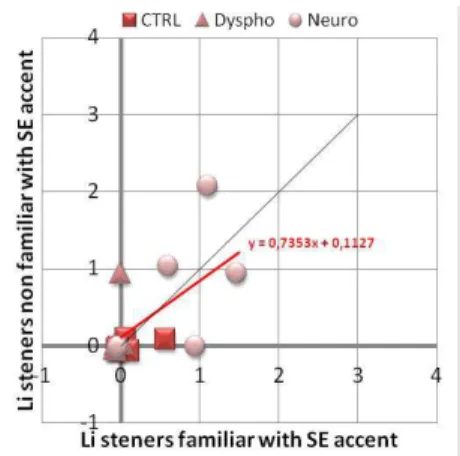
Figure 1 (SEacc speakers) and Figure 2 (NAcc speakers) showed the correlation between the score of NFL vs. FAL groups. On these figures, we also separated the clinical characteristics of speakers (CTRL Ù healthy, Dyspho Ù Dysphonic, neuro Ù Dysarthric) in order to distinguish graphically the raw results. We used a linear correlation model on the entire set of data comparing the NFL score vs. FAL with the speakers' accent as a factor (SEacc vs. NAcc). This model provides a correct coefficient of determination (Adjusted R² = 0.82) and a significant effect on the intercept (b=0.43) which indicates that NFL listeners have perceived more severely SEacc speakers than FAL group when the score is null (normal voice) for FAL group. But we found no significant difference between the intercepts depending of the SEacc vs. NAcc factor (0.43 vs. 0.15), neither on slopes. So, we cannot conclude that there is a difference in the perception of dysphonia severity between listeners groups and so, whatever the speakers' accent.
If now, we extract a subset of data by excluding dysphonic speakers, we obtained significant differences between listeners' groups depending of the speakers' accent. There is a significant difference (-0.5) between the intercepts of the correlation model, depending of the SEacc vs. NAcc factor (0.52 vs. 0.02) and also on slopes. What does it means? When a speaker had a neutral accent, normal voices were perceived as normal by the two groups of listeners (b=0.02). But when speakers had a SEAcc, voices considered as normal by FAL group are perceived as slightly dysphonic by unfamiliarlisteners (0.52).
Figure 1: Correlation of phonatory disorder perception between listeners non familiar with SE accent vs. familiar listeners for speakers with SEAcc
Figure 2: Correlation of phonatory disorder perception between listeners non familiar with SE accent vs familiar listeners for speakers with NAcc
5.3. Articulation disorders
We present in this section the results relative to the perception of articulation disorder.
In term of intra-class correlation, the greatest consistencies are found when the listeners listen to the speakers of their own group: FAL with SEacc, NFL with NAcc (Table 2).
Table 2. Intraclass correlations for articulatory
disorder perception
Familiar Listeners Non Familiar
SEacc speakers 0.56 0.43
NAcc speakers 0.45 0.65
Figure 3 (SEacc speakers) and Figure 4 (NAcc speakers) showed the correlation between the score of NFL vs. FAL groups. For the statistical analysis, we used a linear correlation model on the entire set of data comparing the NFL score vs. FAL with the speakers' accent as a factor (SEacc vs. NAcc). This model provides a poor coefficient of determination (Adjusted R² = 0.47) and no significant differences. The only interesting tendency concerns the slopes differences (+0.90; p=0.54) between the group of speakers SEAcc vs NAcc. But the poor validity of the model and the non uniform distribution of data force us to prudence in interpreting these results.
Figure 3: Correlation of articulation disorder perception between listeners non familiar with SE accent vs. familiar listeners for speakers with SEAcc
Figure 4: Correlation of articulation disorder perception between listeners non familiar with SE accent vs familiar listeners for speakers with NAcc
6. Discussion and conclusion
First of all, in a methodological point of view, the experiment should be replicated with more adapted data: only various dysphonic and healthy speakers to explore the voice dimension, only dysarthric or post oral cancer surgery for the articulation dimension, only cleft palate or velopharyngeal insufficiencies for nasality… This adaptation could be better to obtain a more uniform distribution of data for each dimension (from normal to severe disorders).
To the question "is there a perceptual interference between regional accent and voice disorder?" We can answer by the affirmative. This interference does not occur for moderate or severe dysphonia where the most prevalent perceptual information is carried by the physiological disturbance. On the contrary, the influence of the regional accent is more salient on normal voices or slight dysphonia. In fact, the interference occurs on "normality" where the unfamiliarlisteners to a regional accent perceive a deviation according to their own references and can "interpret" this phonetic variation as a physiological divergence (because they are in a task of perceptual assessment of a disorder). As done by Kuhl with the theory of 'magnet effect' [27], we can make an analogy with magnetism where two fields of forces (phonetic variation vs physiological disturbance) can interfere at proximity of "normality" in our case. Finally, this study calls for further developments with theoretical, clinical and social issues.
7. References
[1] Darley, F. L., Aronson, A. E., & Brown, J. R. (1975). Motor Speech Disorders. Saunders.
[2] Hirano, M. (1981). Clinical Examination of Voice. Wien: Springer Verlag.
[3] Kreiman, J., Gerratt, B. R., Precoda, K., & Berke, G. S. (1992). Individual differences in voice quality perception. Journal of Speech and Hearing Research, 35(3), 512-520.
[4] Ghio, A., Weisz, F., Baracca, G., Robert, D., Woisard, V., Fussi, F., & Giovanni, A. (2011). Is the Perception of Voice Quality Language-Dependent? A Comparison of French and Italian Listeners and Dysphonic Speakers. Proceed. Interspeech, Firenze, 525-528.
[5] Carton, F., Rossi, M., Autesserre, D. & Léon, P. (1983). Les accents du français. Paris : Hachette, De Bouche à Oreille. [6] Gasquet-Cyrus, M. (2010). L’accent : concept (socio)
linguistique ou catégorie de sens commun?, in H. Boyer (ed.), Pour une épistémologie de la sociolinguistique, Limoges, Lambert-Lucas, 179-188
[7] Moreau, M.-L. (1998). Sociolinguistique, concepts de base. Coll. Psychologie et sciences humaines, Mardaga, Belgique
[8] Durand J. (2009), « Essai de panorama phonologique: les accents du midi»,in L. Baronian et F.Martineau (eds) Le français d’un continent à l’autre. Mélanges offerts à Yves-Charles Morin, Québec, Presses de l’Université Laval, 123-170.
[9] Blanchet, P. (1991). Dictionnaire du français régional de Provence. Paris: Bonneton.
[10] Fries S., Deprez C., 2003, « L’accent étranger : identification et traitement social en France et aux Etats-Unis », Cahiers du français contemporain 8, Lyon, ENS Editions, 89-105.
[11] Meyer J., 2010, « Analyse des discriminations par l’accent en milieu professionnel », Ecarts d’identité 116, 12-20.
[12] Gasquet-Cyrus, M. (2012) La discrimination à l’accent en France : idéologies, discours et pratiques. In C. Trimaille et J.-M. Eloy (éds), Idéologies linguistiques et discriminations, Carnets d’Atelier de Sociolinguistique 6, Paris, L’Harmattan, 227-245.
[13] ASHA Joint Subcommittee of the Executive Board on English Language Proficiency. (1998). Students and Professionals Who Speak English with Accents and Nonstandard Dialects: Issues and Recommendations (No. TR1998-00154). Rockville, MD: American Speech-Language-Hearing Association.
[14] Cheng, L.-R. L. (1999). Moving beyond Accent: Social and Cultural Realities of Living with Many Tongues. Topics in Language Disorders, 19(4), 1-10
[15] Rozenn H. (2000), Moving beyond Accent: social and cultural realities of living with many tongues, Actualités Orthophoniques Mars 2000 (volume 4, n°1)
[16] Foulkes, P., & Docherty, G. J. (2000). Another chapter in the story of /r/: ‘Labiodental’ variants in British English. Journal of Sociolinguistics, 4(1), 30–59
[17] Munro, M. J., & Derwing, T. G. (1995). Processing time, accent and comprehensibility in the perception of native and foreign-accented speech. Language and Speech, 38, 289-306.
[18] Schmidt, P. M. & Yeni-Komshian, G. H. (1999). The effects of speaker accent and target predictability on perception of mispronunciations. Journal of Speech, Language and Hearing Research, 42, 56-64.
[19] Warren, R. M., & Warren, R. P. (1970). Auditory illusions and confusions. Scientific American, 223(6), 30̻36.
[20] Dufour, S., Nguyen, N., & Frauenfelder, U. H. (2007). The perception of phonemic contrasts in a non-native dialect. The Journal of the Acoustical Society of America, 121(4), EL131-136.
[21] Clopper, C. G., & Bradlow, A. R. (2008). Perception of Dialect Variation in Noise: Intelligibility and Classification. Language and speech, 51(Pt 3), 175-198.
[22] Floccia, C., Goslin, J. & Girard, F. (2004). Processing inter-speaker variability: the case of regional accents. Proceedings of the Journées d’Etudes Linguistiques, Université de Nantes. [23] Floccia, C., Goslin, J., Girard, F., & Konopczynski, G. (2006).
Does a regional accent perturb speech processing? Journal of
experimental psychology. Human perception and performance, 32(5), 1276-1293.
[24] Ghio, A., Pouchoulin, G., Teston, B., Pinto, S., Fredouille, C., De Looze, C.,, … Giovanni, A. (2012). How to manage sound, physiological and clinical data of 2500 dysphonic and dysarthric speakers? Speech Communication, 54(5), 664̻679.
[25] Shrout, P.E., & Fleiss, J.L. (1979), Intraclass correlation: uses in assessing rater reliability. Psychological Bulletin, 86, 420-428. [26] H. Yamaguchi, R. Shrivastav, M. L. Andrews, S. Niimi, "A
Comparison of Voice Quality Ratings Made by Japanese and American Listeners Using the GRBAS Scale", Folia Phoniatr Logop, 55: 3, 147-157, 2003.
[27] Kuhl, P. K. (1991). Human adults and human infants show a « perceptual magnet effect » for the prototypes of speech categories, monkeys do not. Perception & psychophysics, 50(2), 93-107.